
Originally published: 12/04/2023 08:43
Publication number: ELQ-45008-1
View all versions & Certificate
Publication number: ELQ-45008-1
View all versions & Certificate

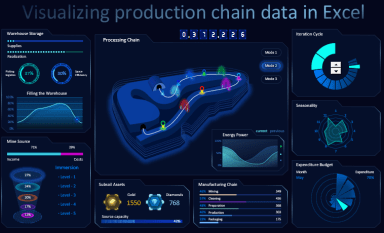
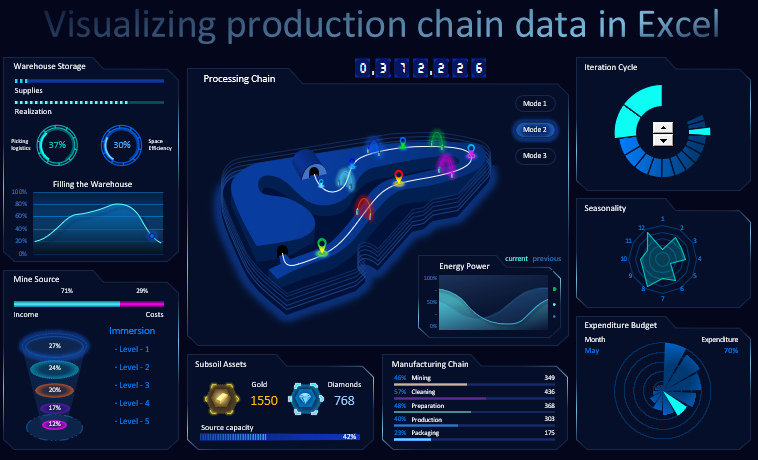
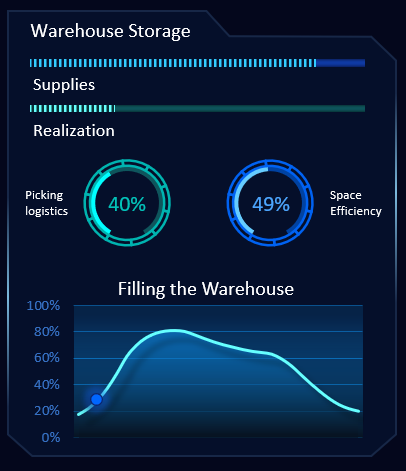
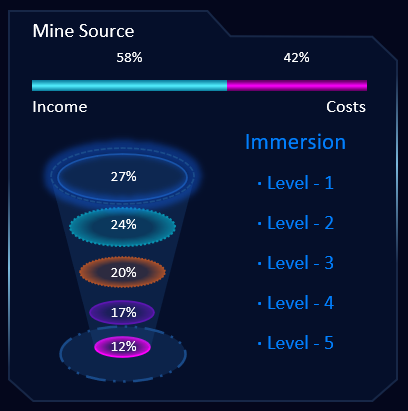
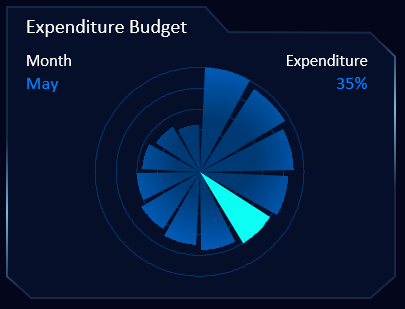
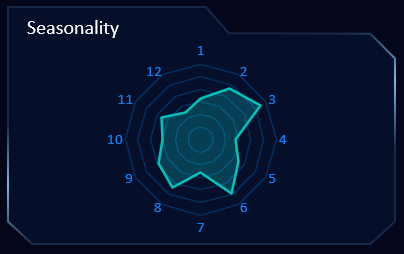
Gamification dashboard for business
Dashboard intended to have immediate view of overall performance of a company through indicators of efficiency of all its main processes and their interrelation
I work as finance professional in a Spanish subsidiary of a global multinational company in the IT sector since more than twenty years.Follow
Further information
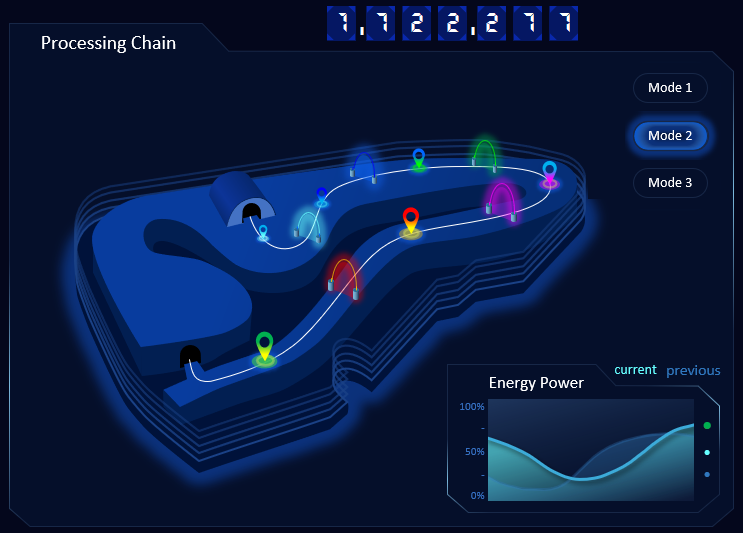
Show comprehensive pictue of interconnected processes withine one company, from acquisition of resorces to their effective usage to achieve company results.
Production company
