

Originally published: 07/06/2022 08:25
Publication number: ELQ-99941-1
View all versions & Certificate
Publication number: ELQ-99941-1
View all versions & Certificate

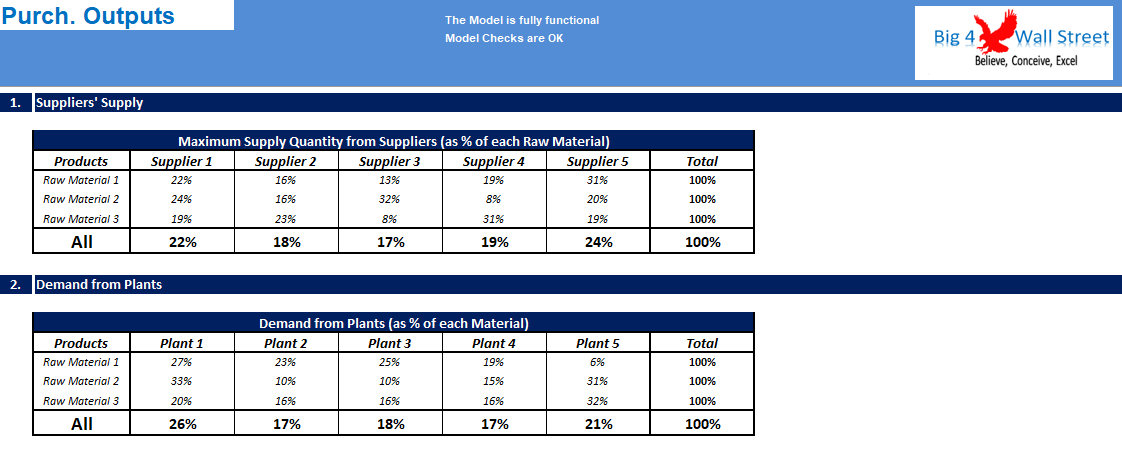
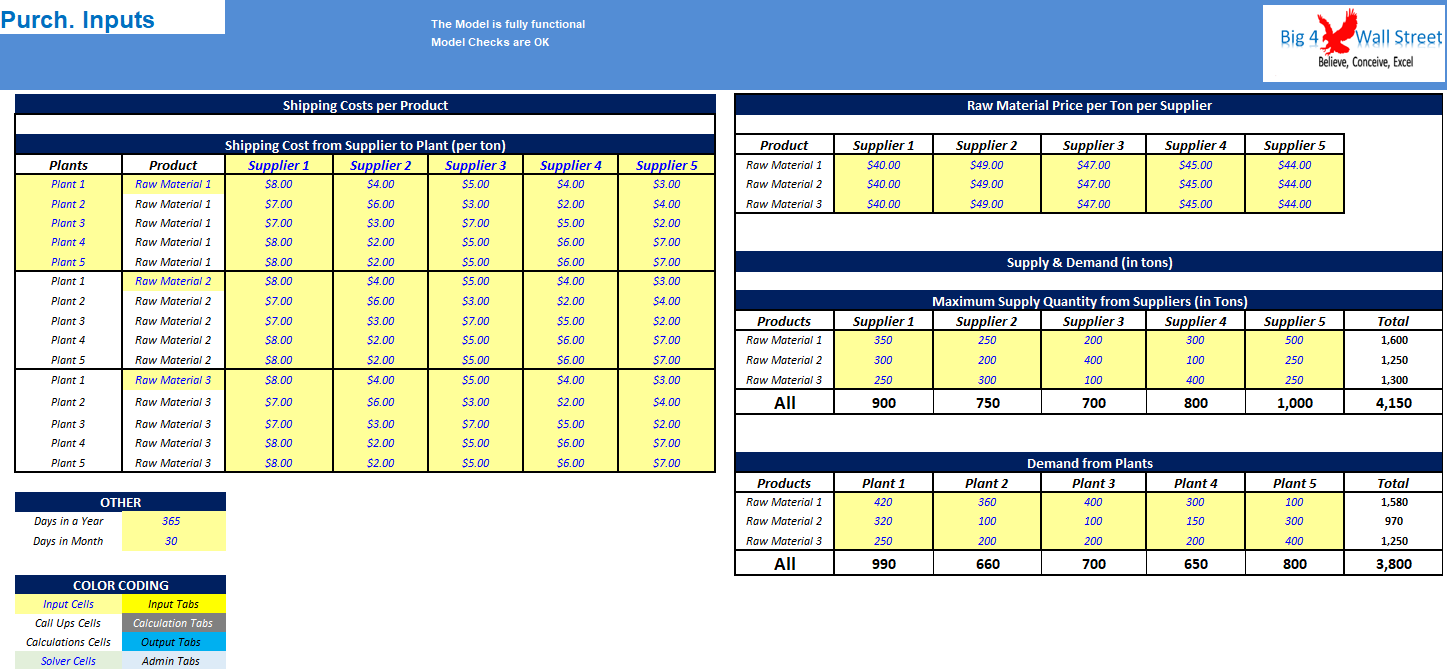
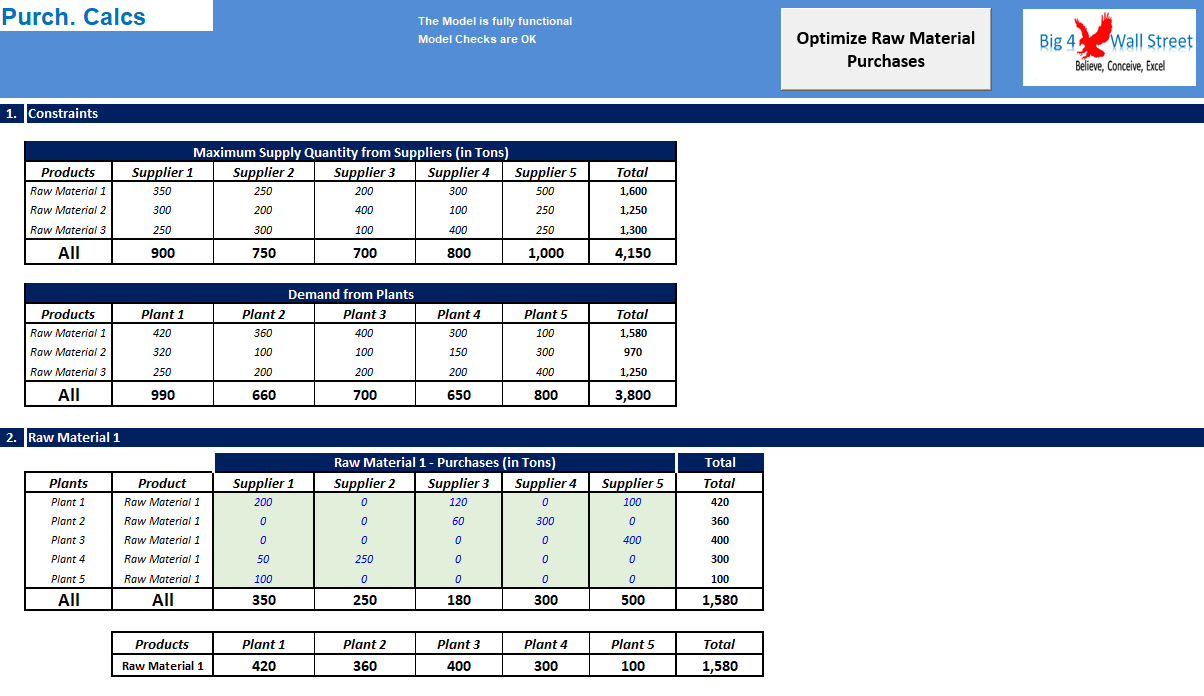
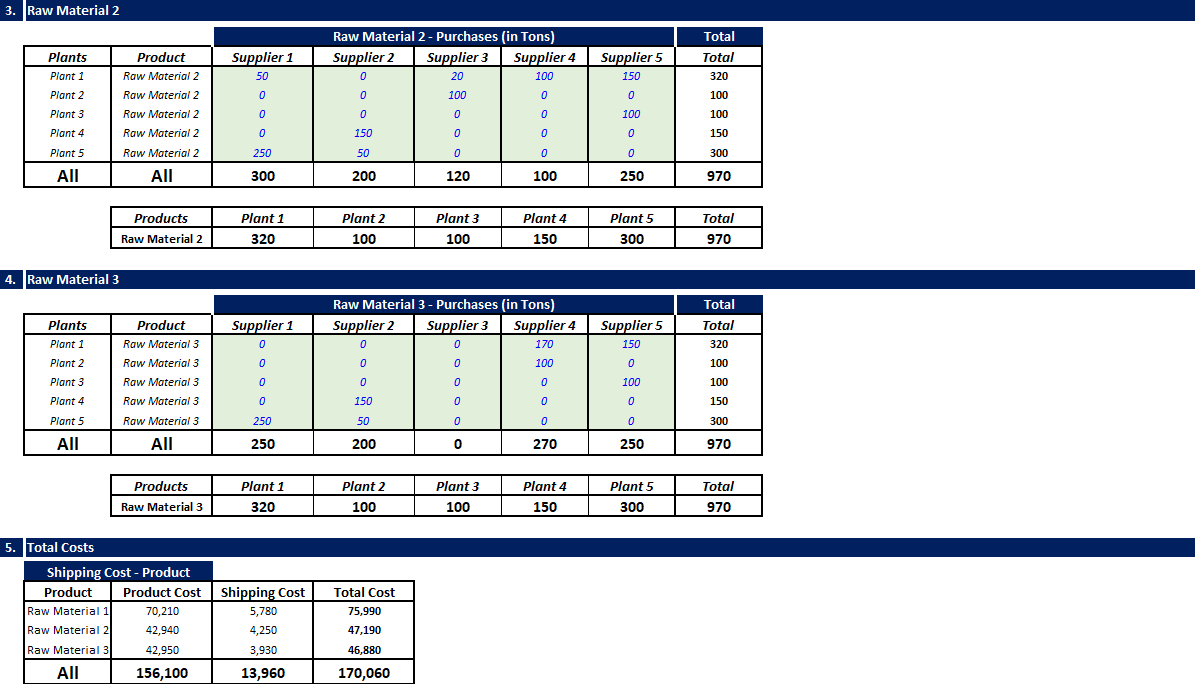
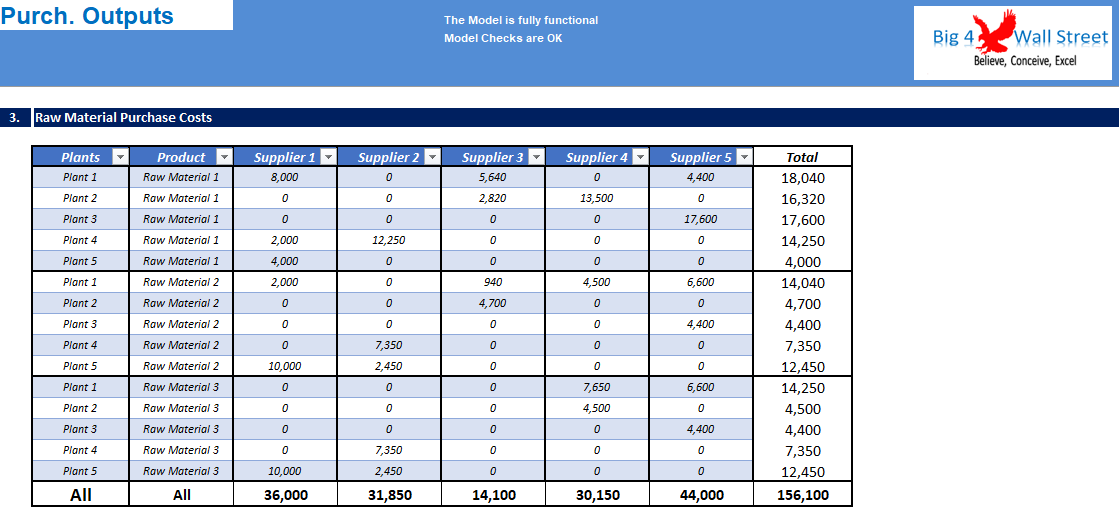
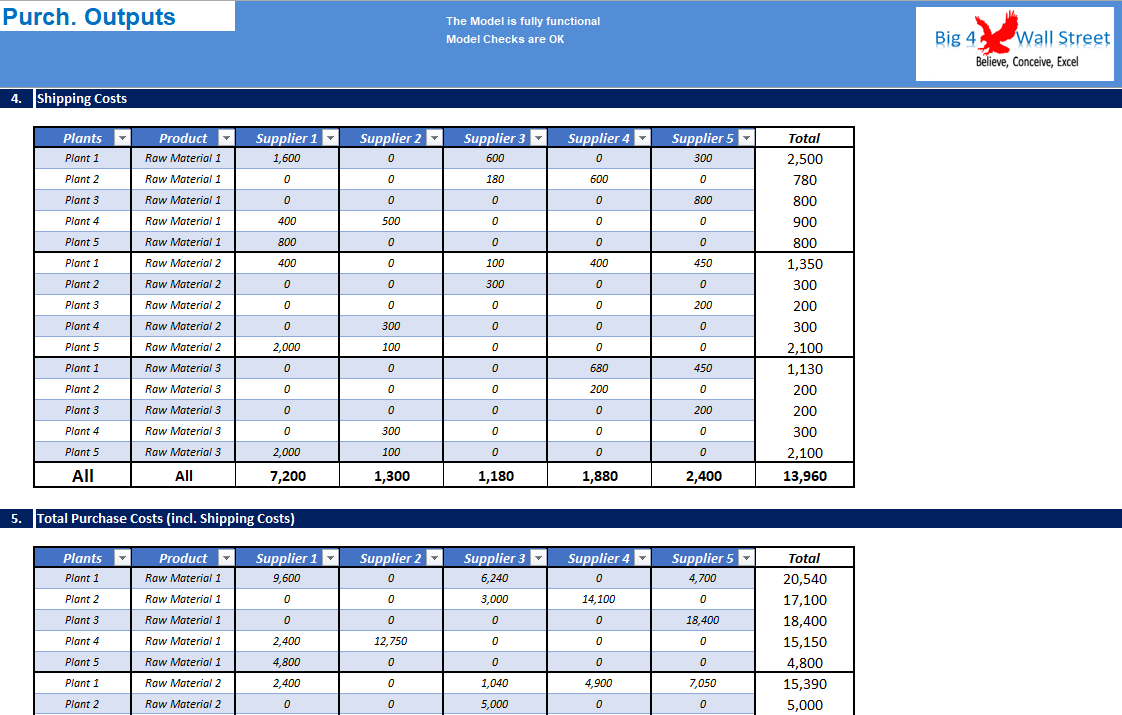
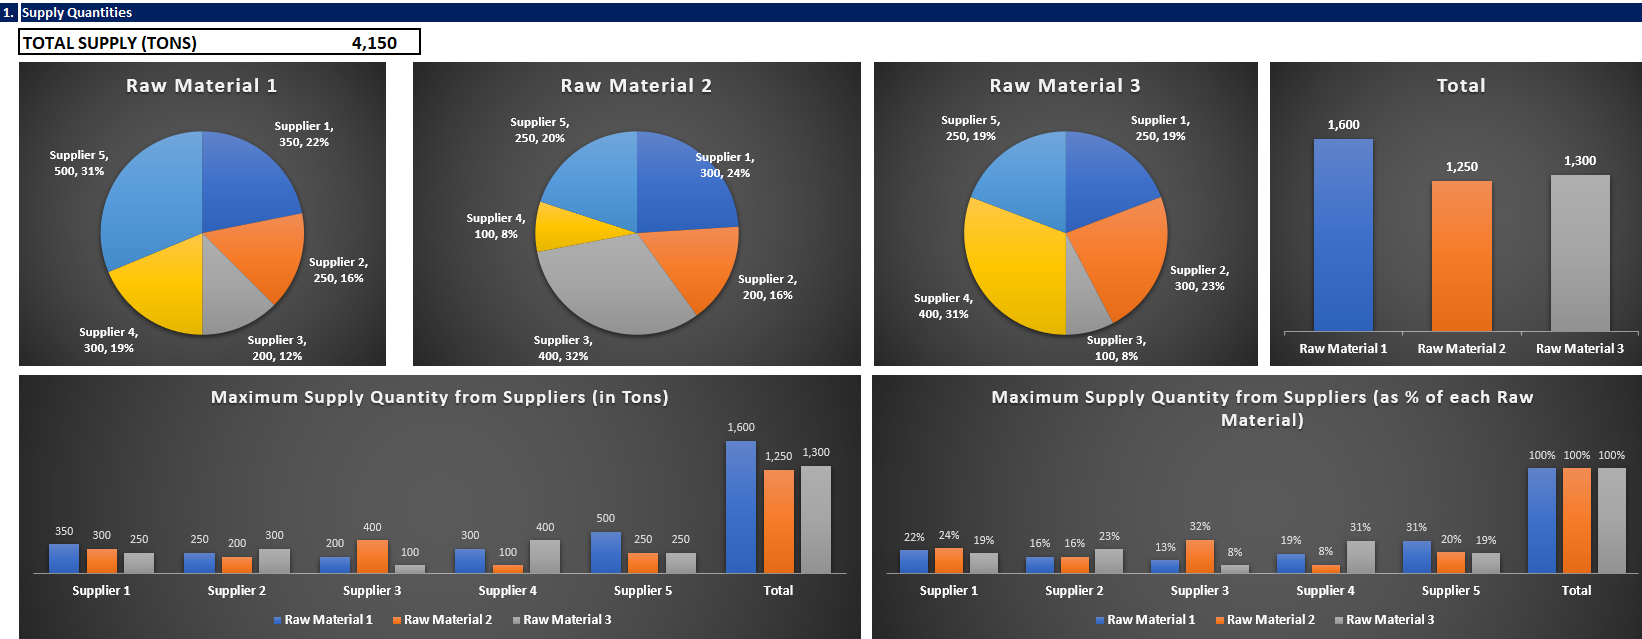
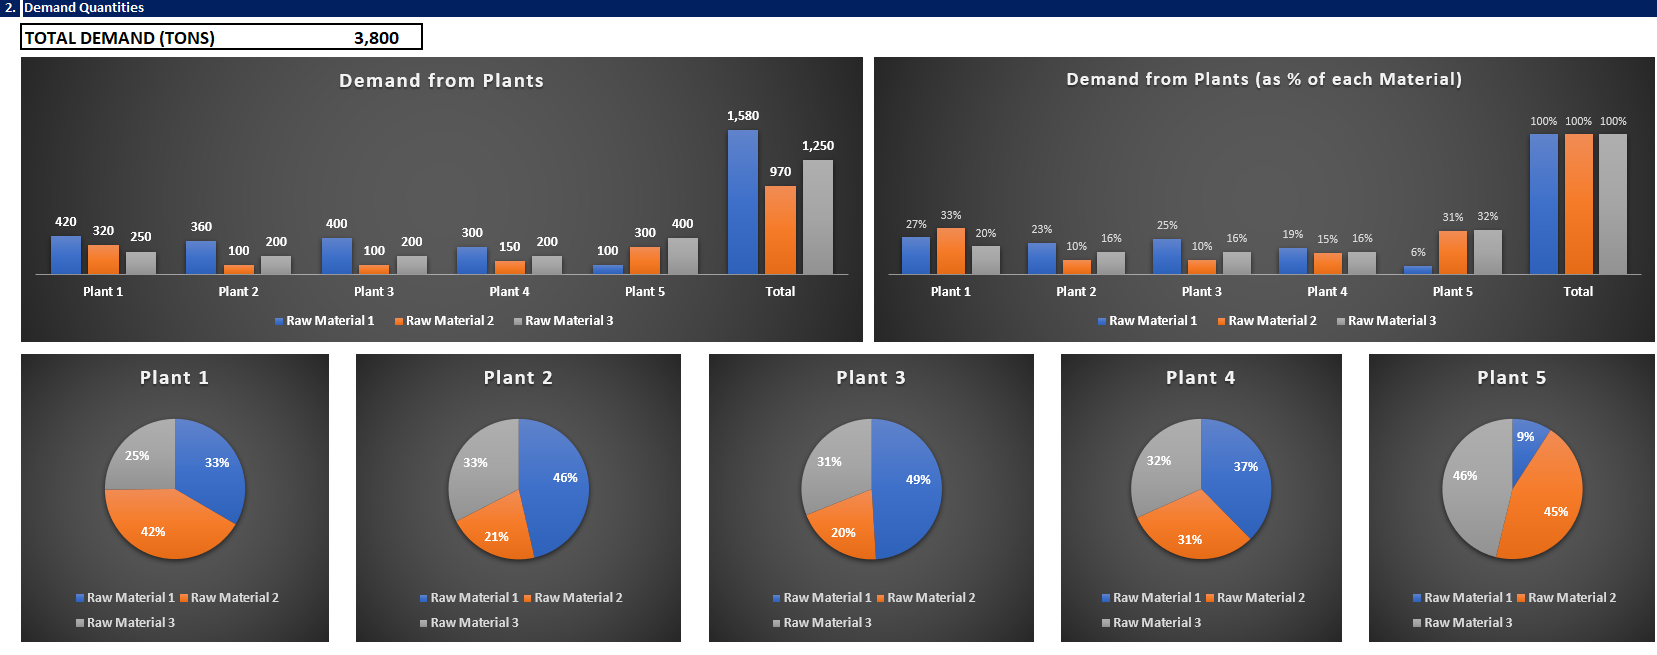
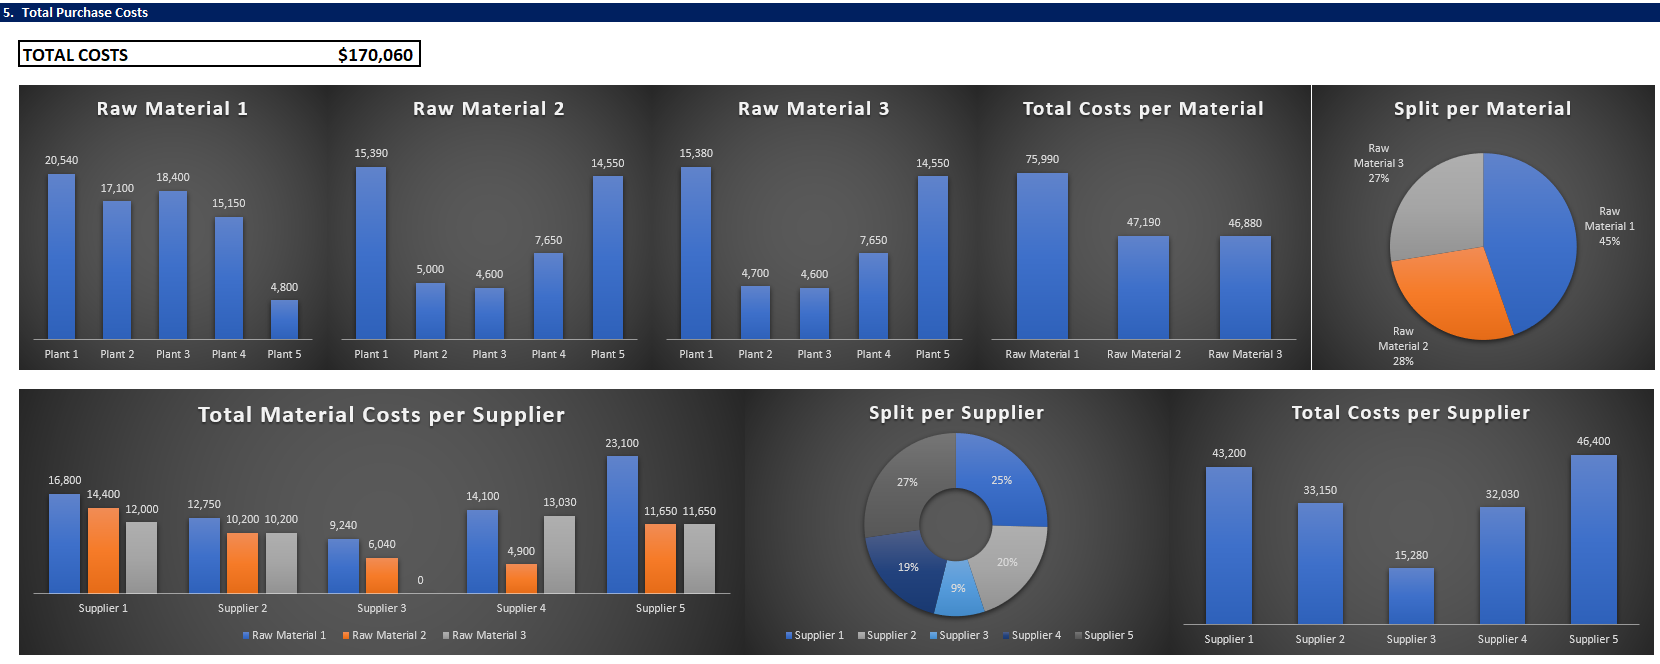
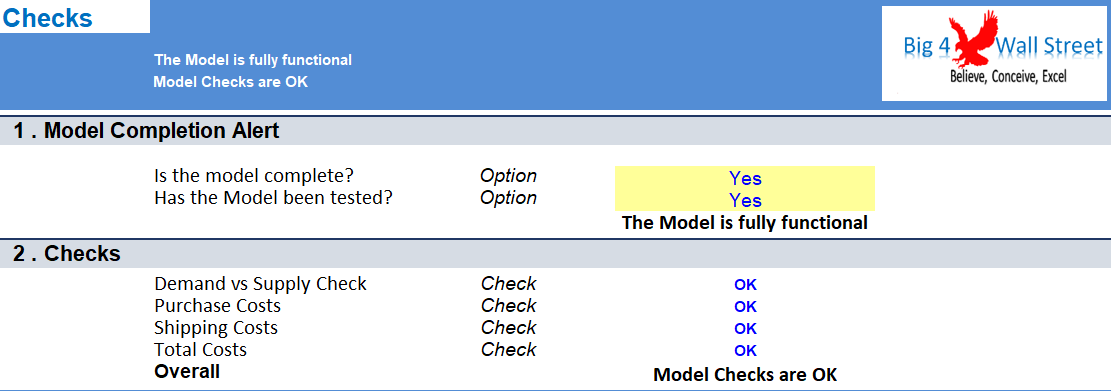
Purchasing Model in Excel
Purchasing Model consists of a model which optimizes the purchasing of 3 different raw materials from 5 different suppliers for 5 different plants.
