Originally published: 02/08/2021 14:48
Publication number: ELQ-94864-1
View all versions & Certificate
Publication number: ELQ-94864-1
View all versions & Certificate

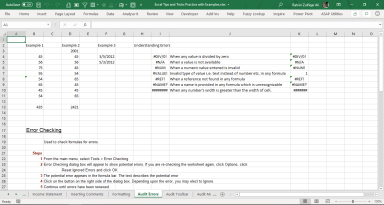
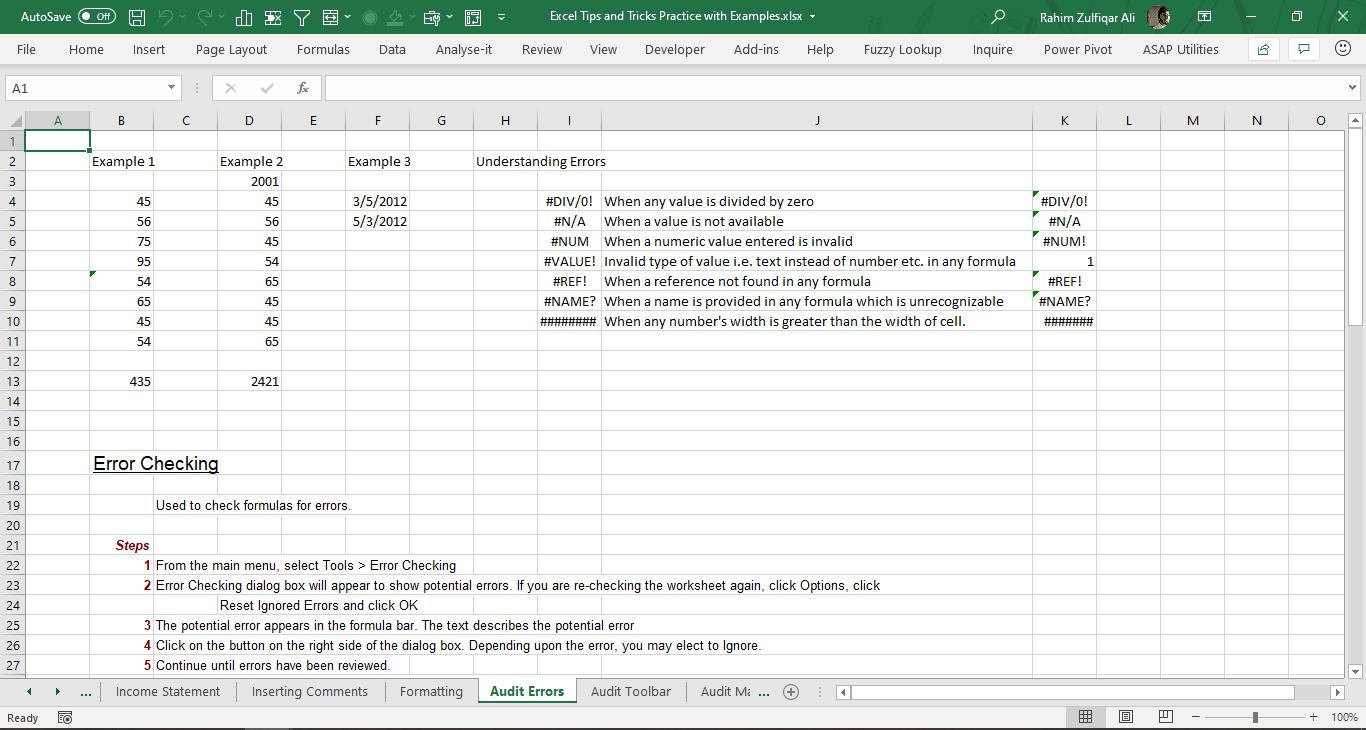
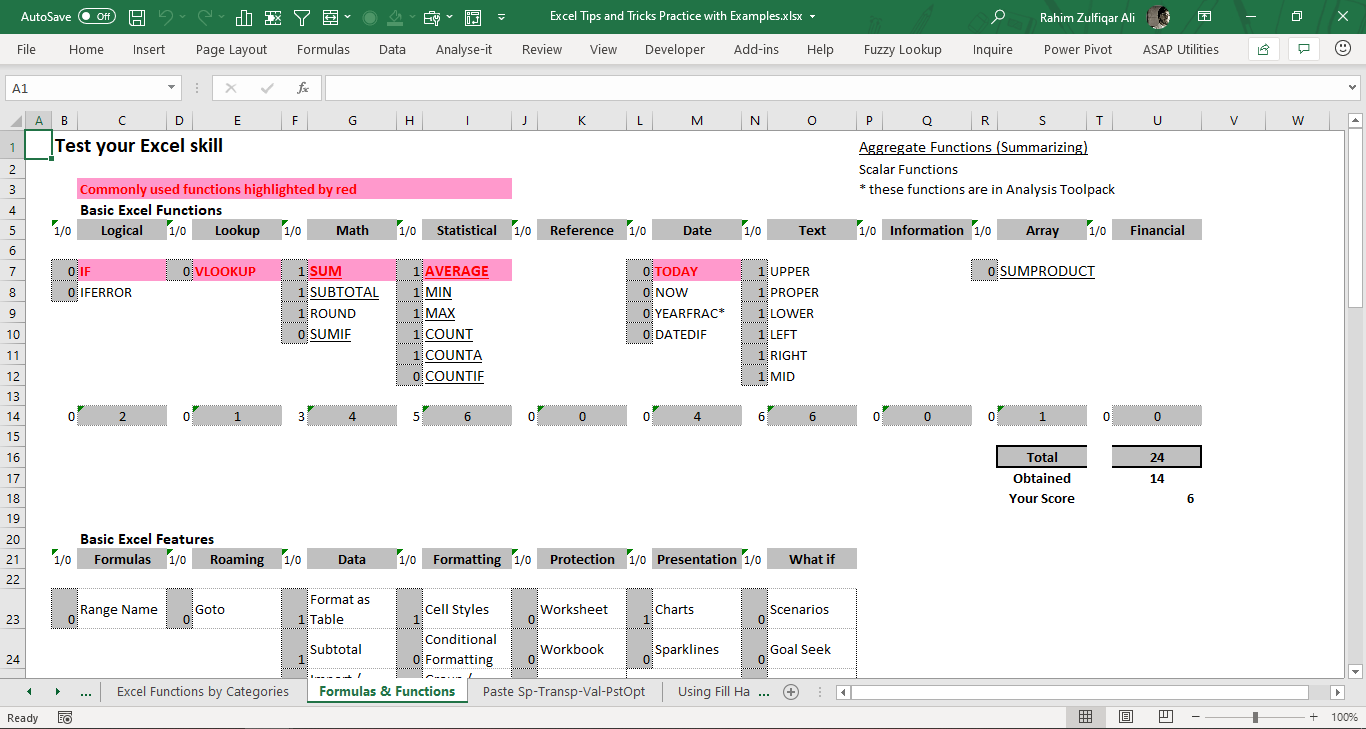
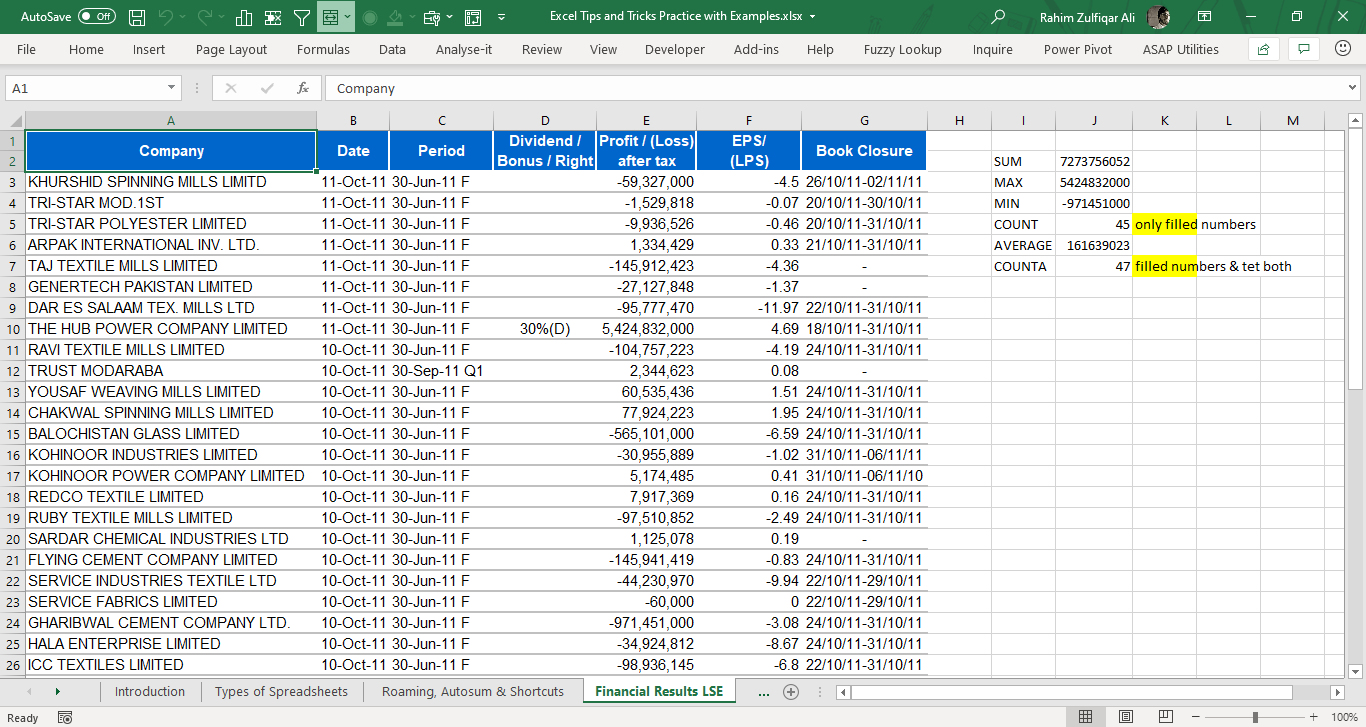
Microsoft Excel Tips and Tricks Practice with 30+ Examples
Microsoft Excel Tips and Tricks Practice with 30+ Examples
Founder & CEO - Excel Basement, Microsoft MVP (Excel) 2025, MCT, MSOM, Excel & POWER BI Trainer & Consultant, MBA (MIS), Emerging Data ScientistFollow 463
