Originally published: 21/09/2021 11:36
Publication number: ELQ-24917-1
View all versions & Certificate
Publication number: ELQ-24917-1
View all versions & Certificate

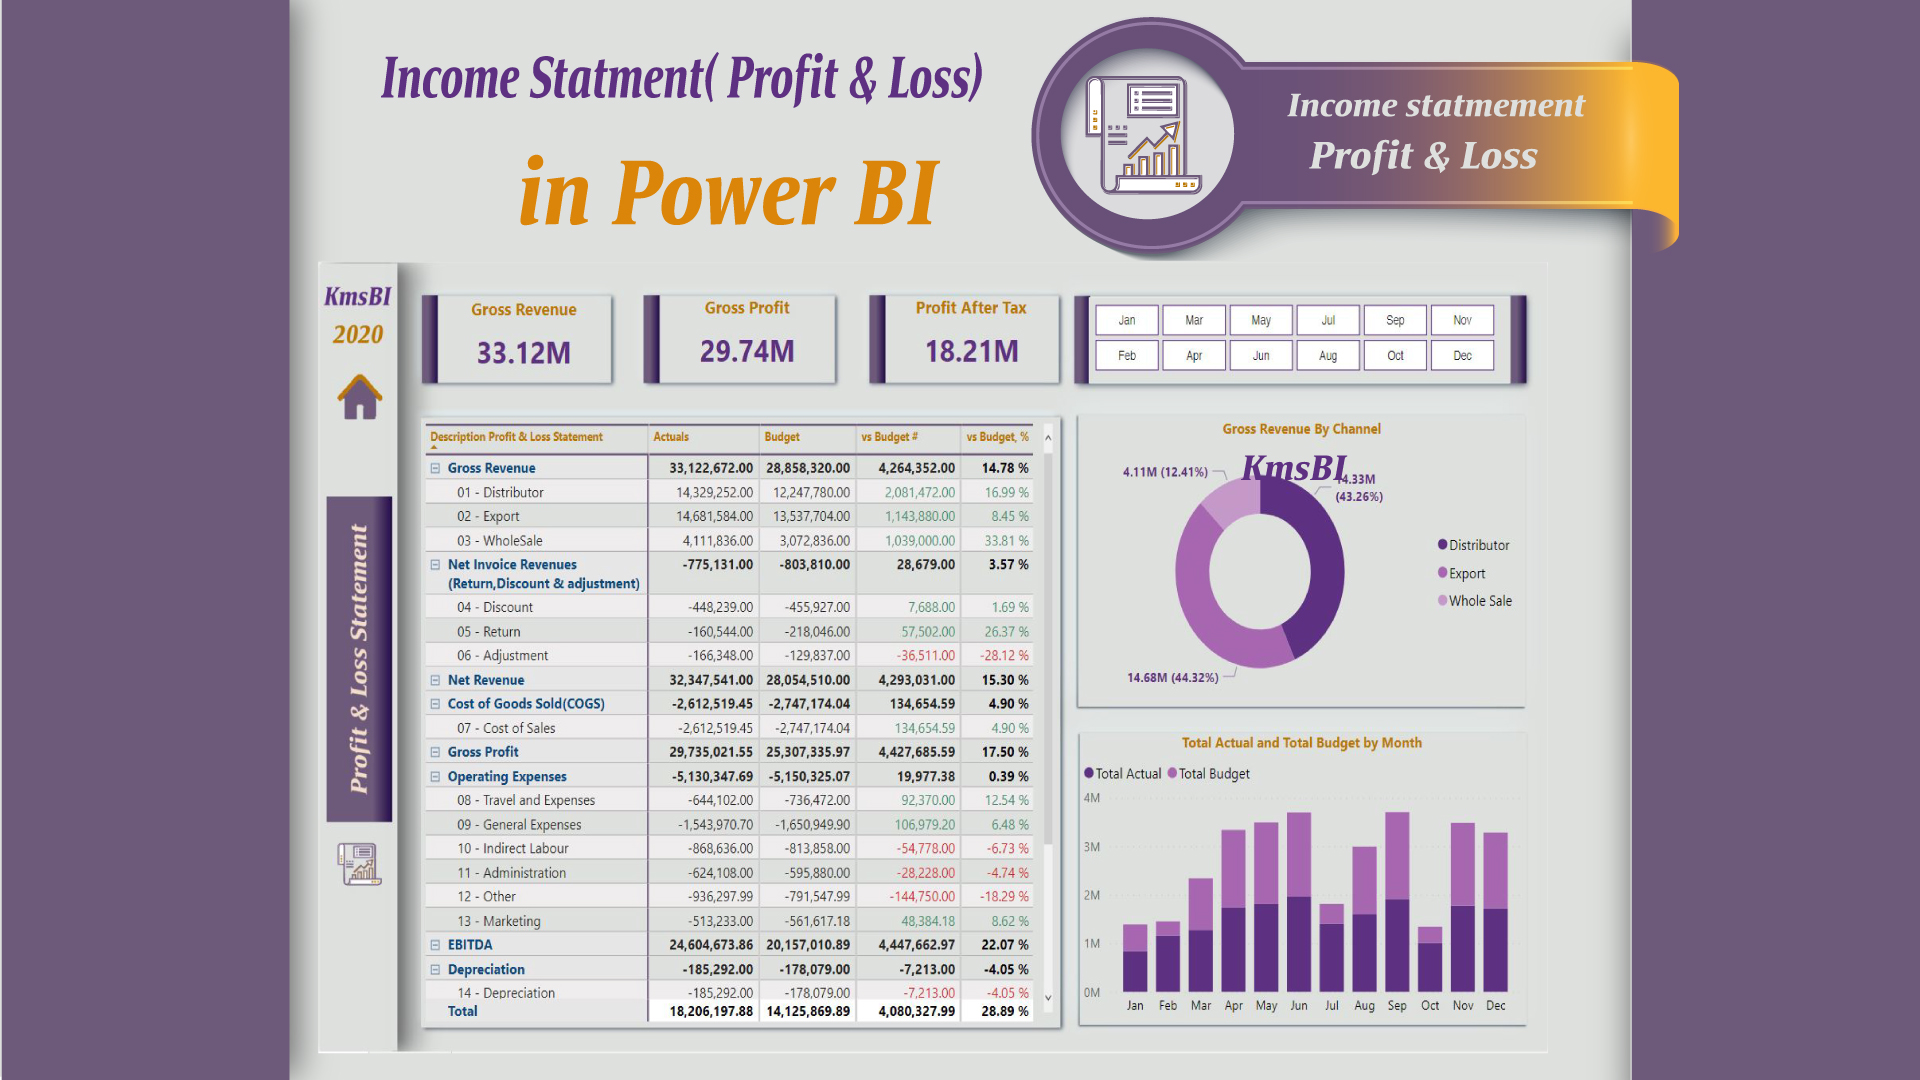
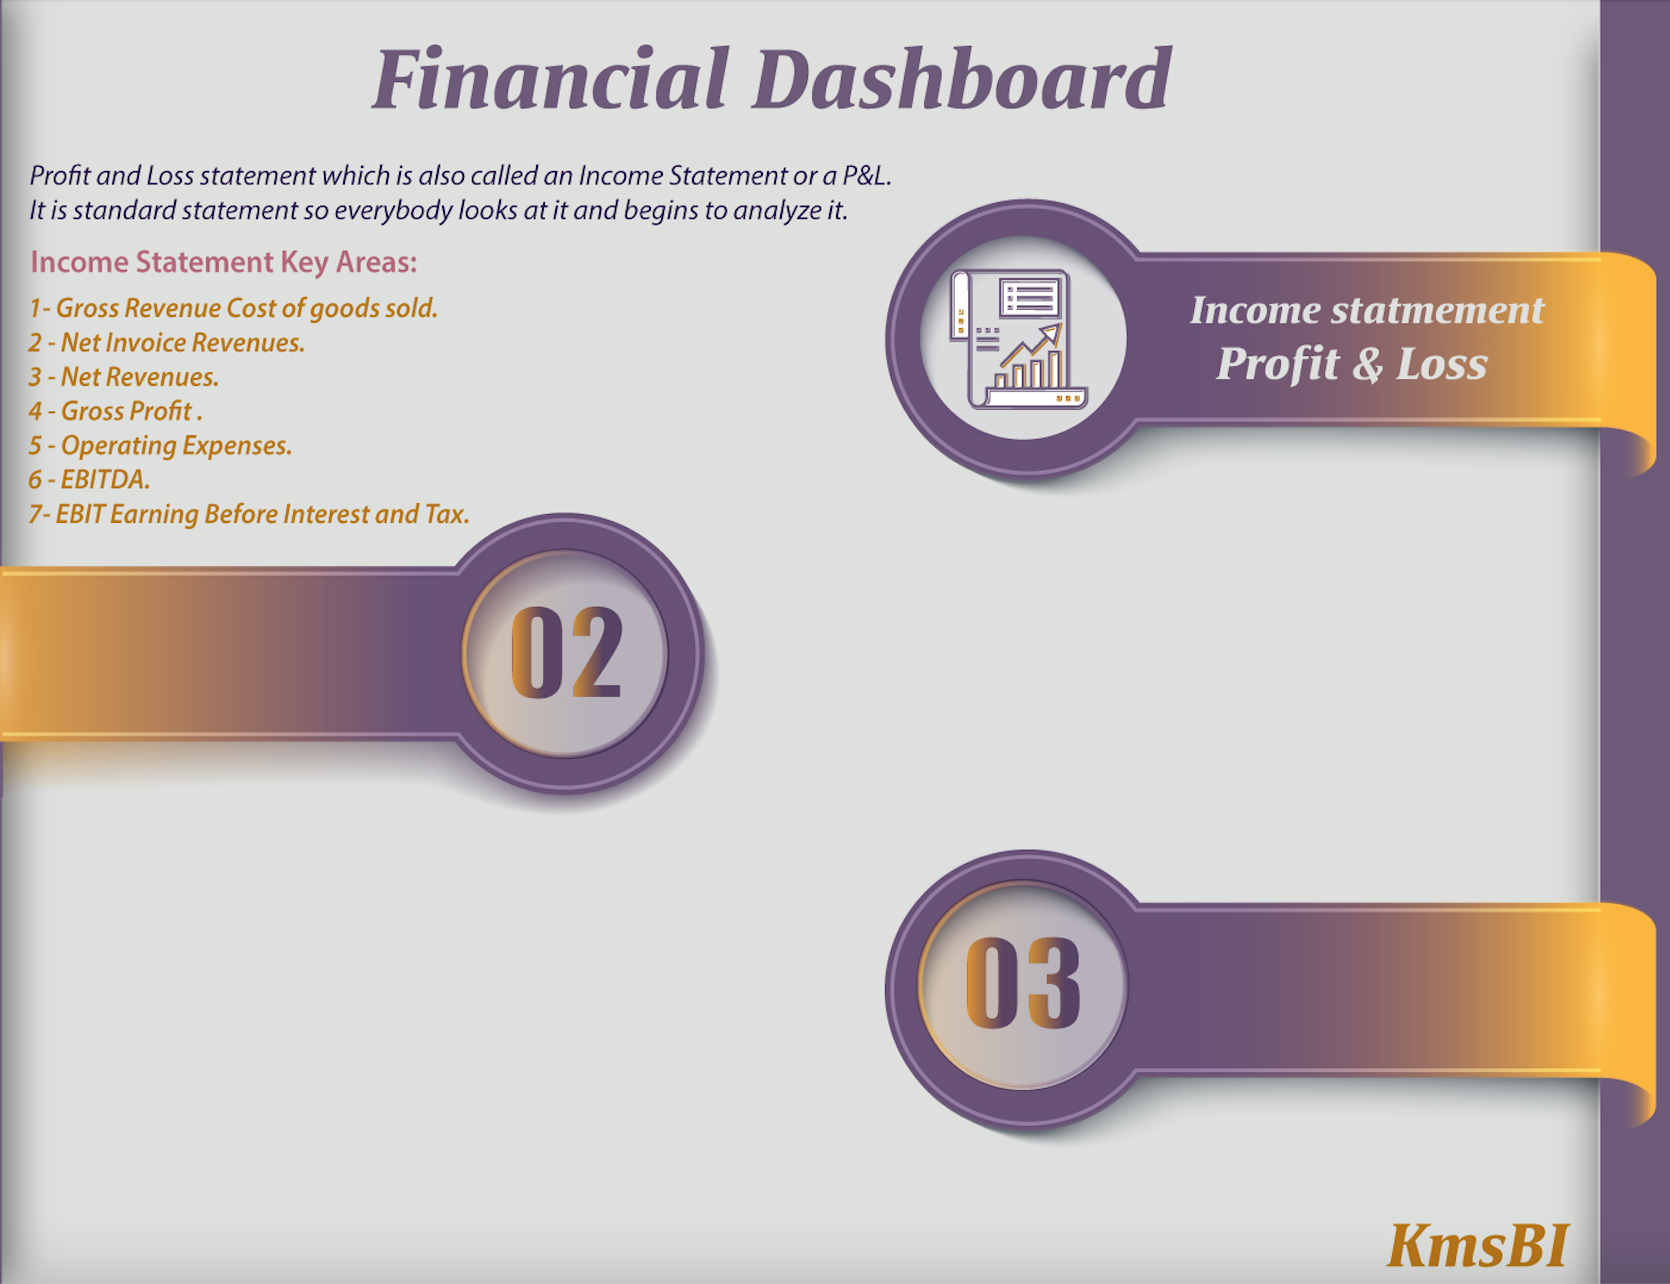
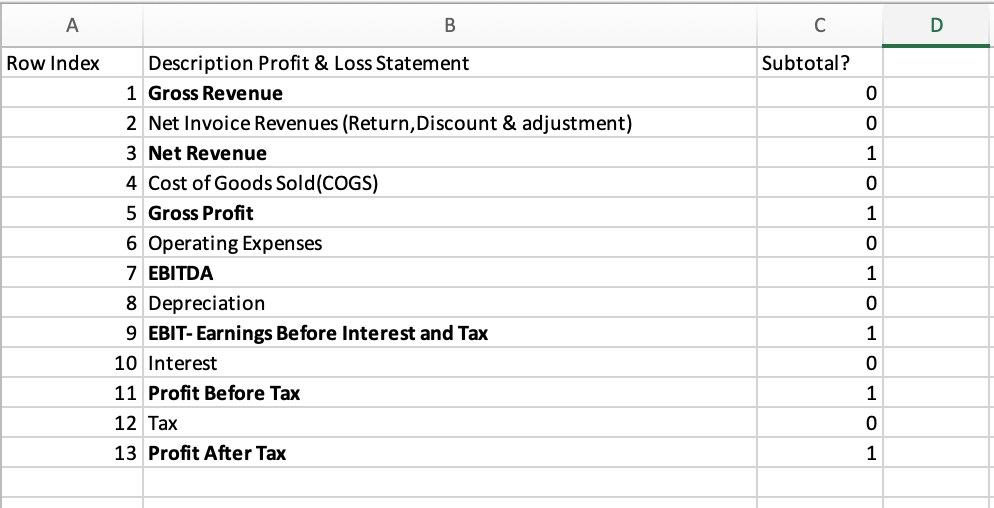
Financial Income Statement Dashboard In Power BI
Financial Income Statement In Power BI
