Originally published: 13/09/2021 12:04
Last version published: 05/11/2021 09:39
Publication number: ELQ-66877-2
View all versions & Certificate
Last version published: 05/11/2021 09:39
Publication number: ELQ-66877-2
View all versions & Certificate

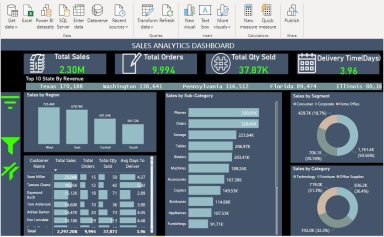
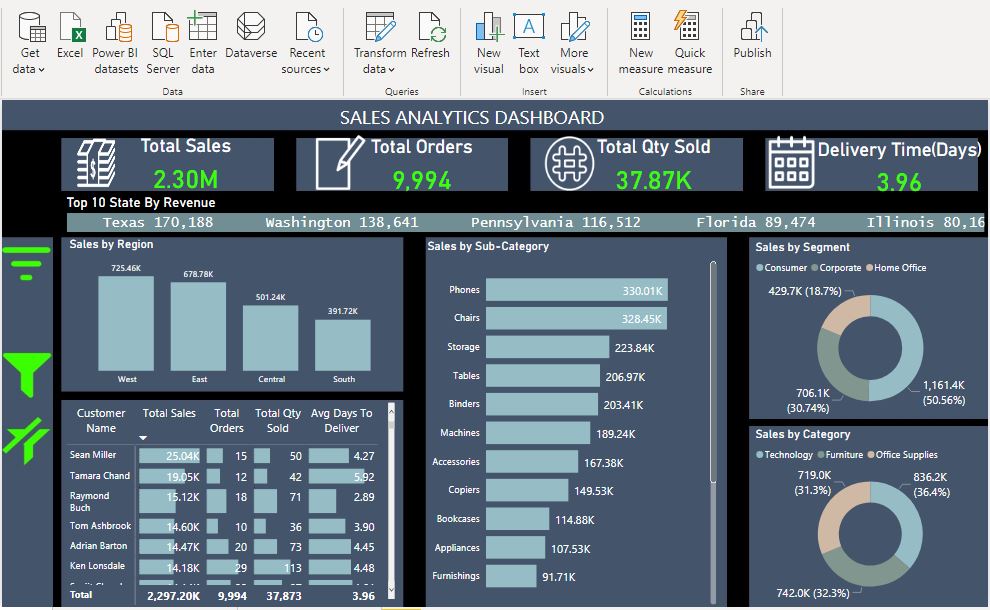
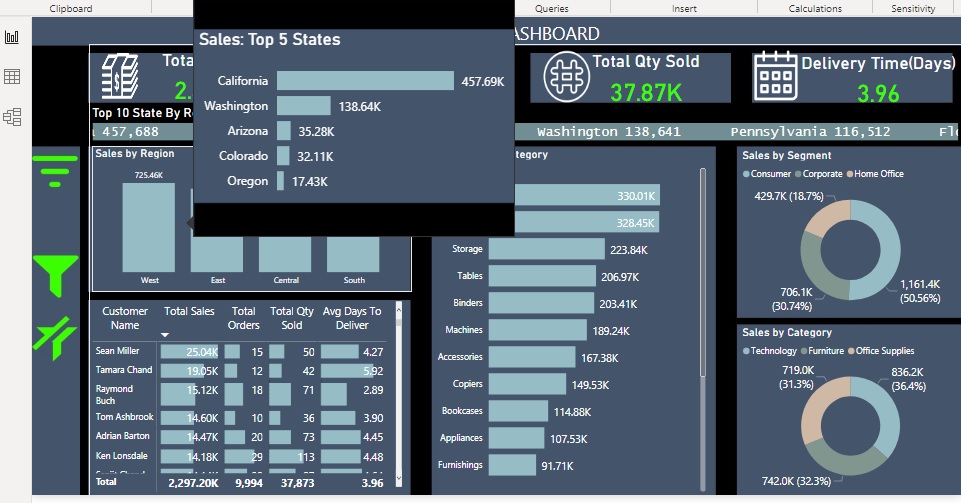
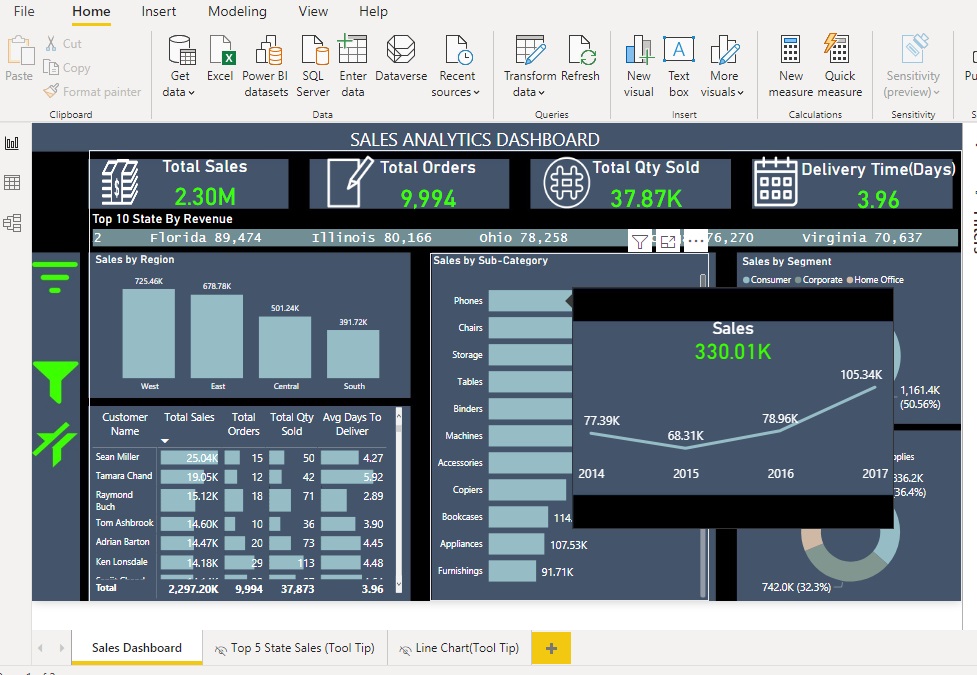
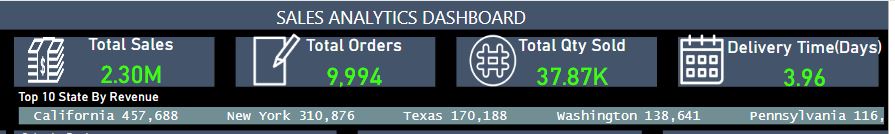
Sales Analytics Dashboard in Power BI
Sales Analytics Dashboard in Power BI using Buttons, Hidden Filters (by using Bookmarks), Custom Background (PPT) and much more to make Dashboard interactive.
MOHAMMAD SAAD NAYYAR offers you this Best Practice for free!
download for free
Add to bookmarks
