
Originally published: 19/04/2024 06:57
Last version published: 19/12/2024 10:35
Publication number: ELQ-30078-2
View all versions & Certificate
Last version published: 19/12/2024 10:35
Publication number: ELQ-30078-2
View all versions & Certificate

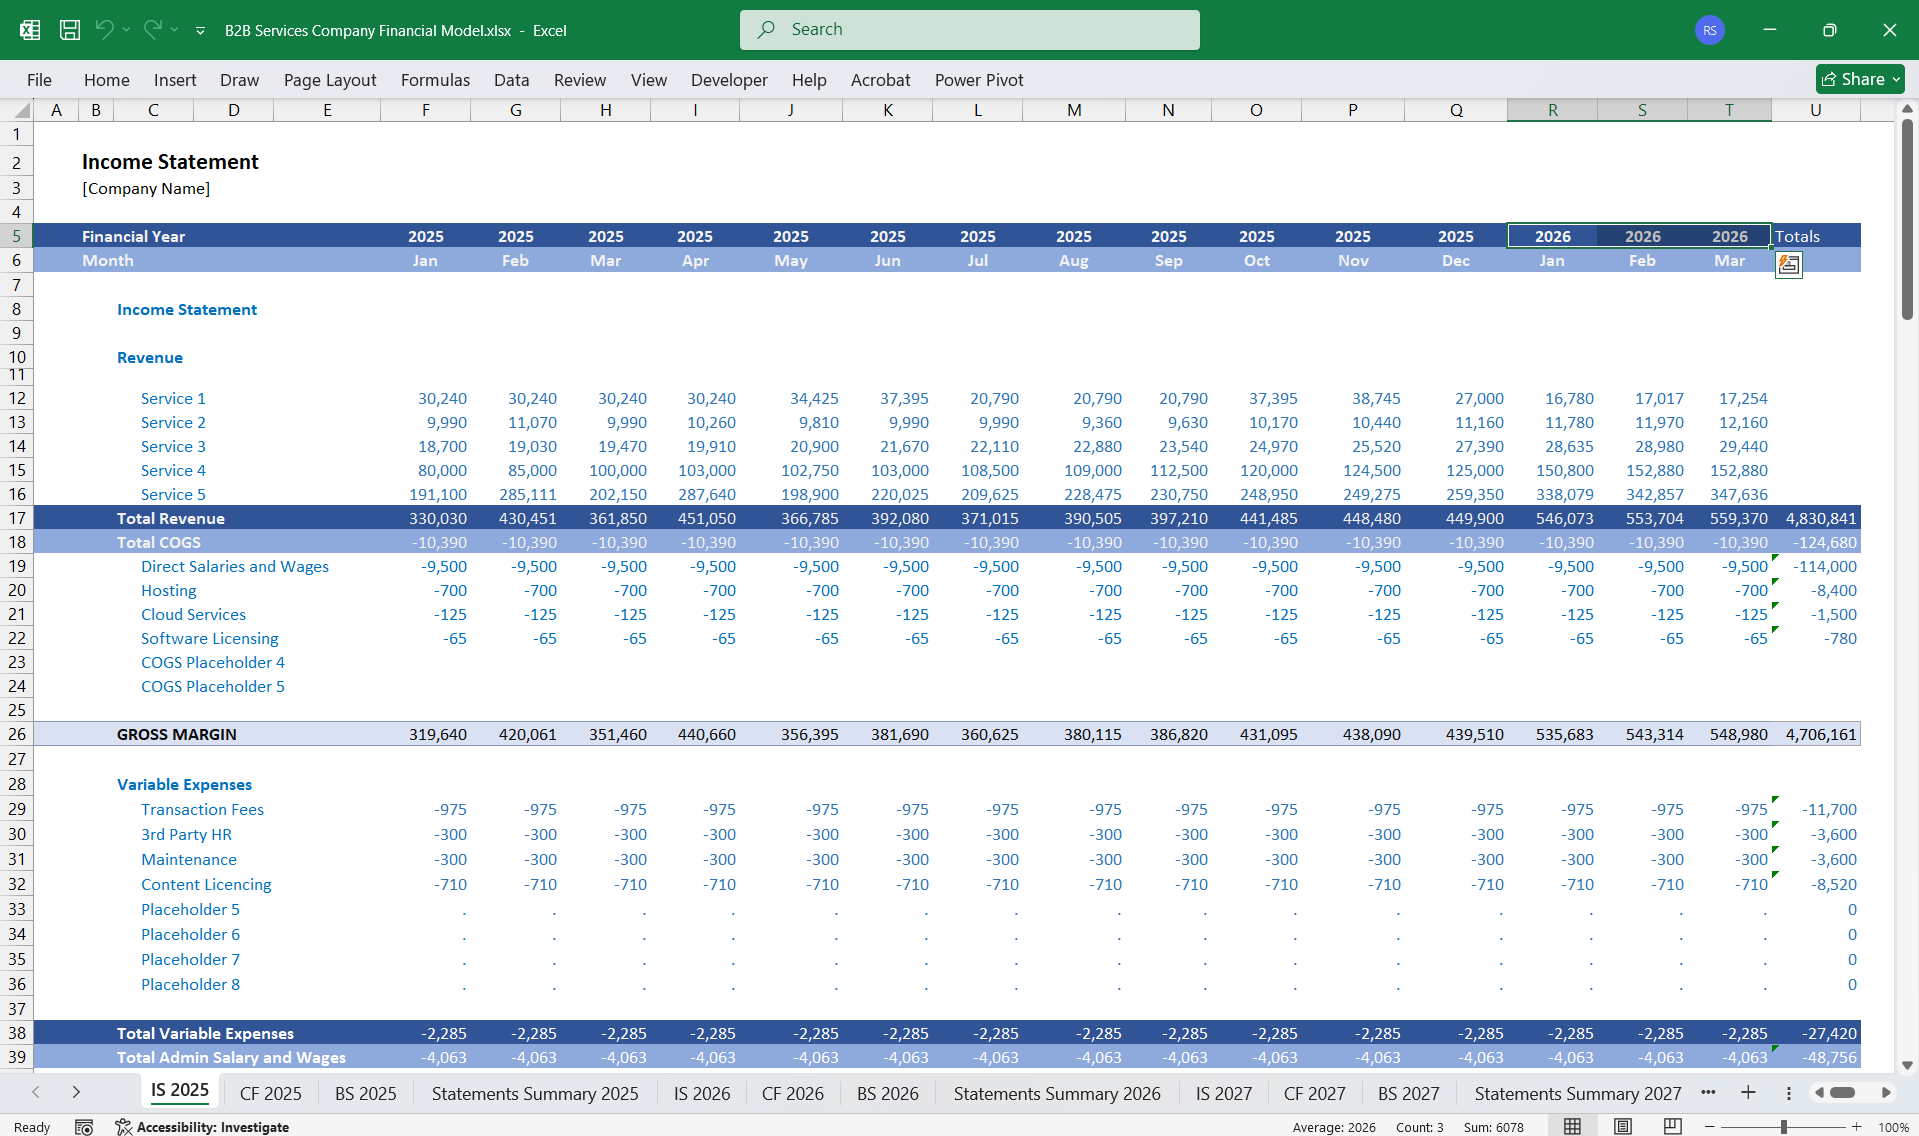
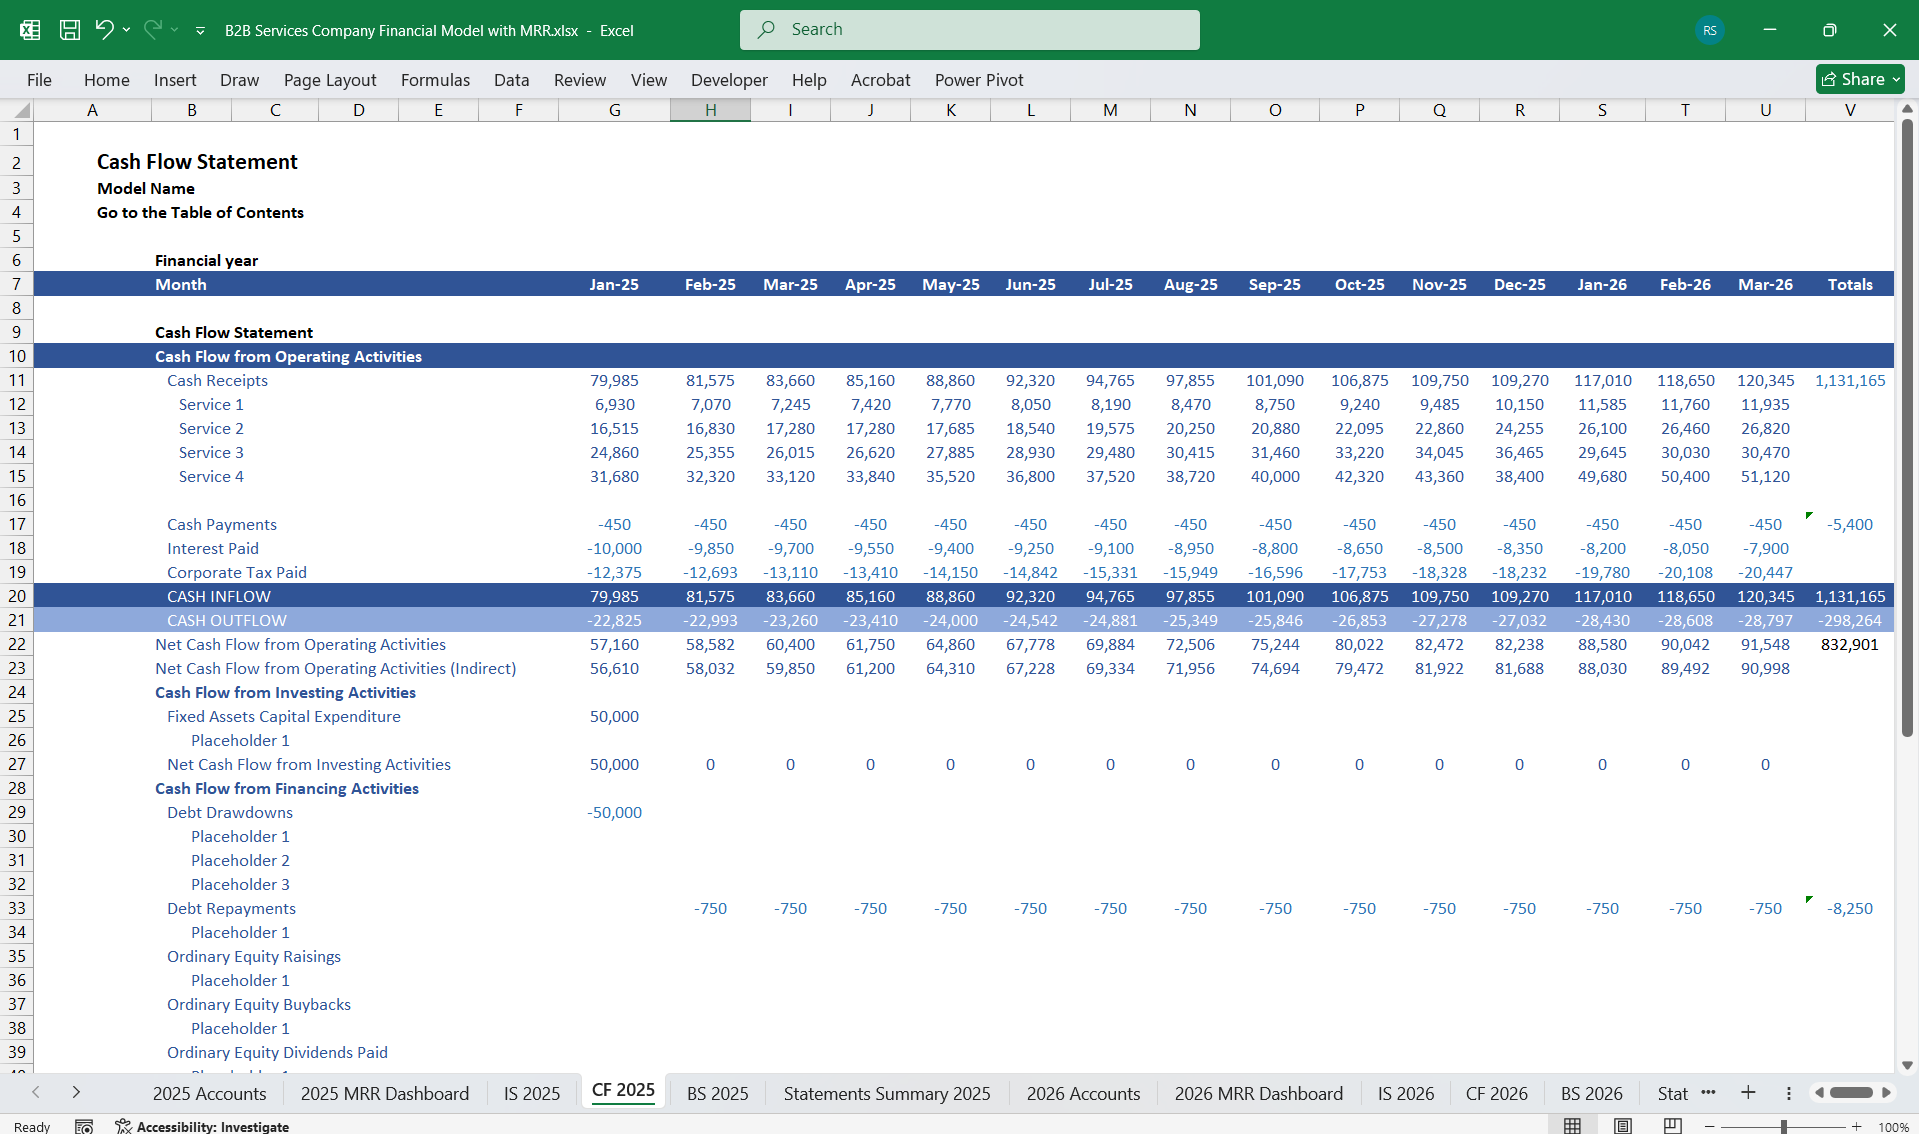
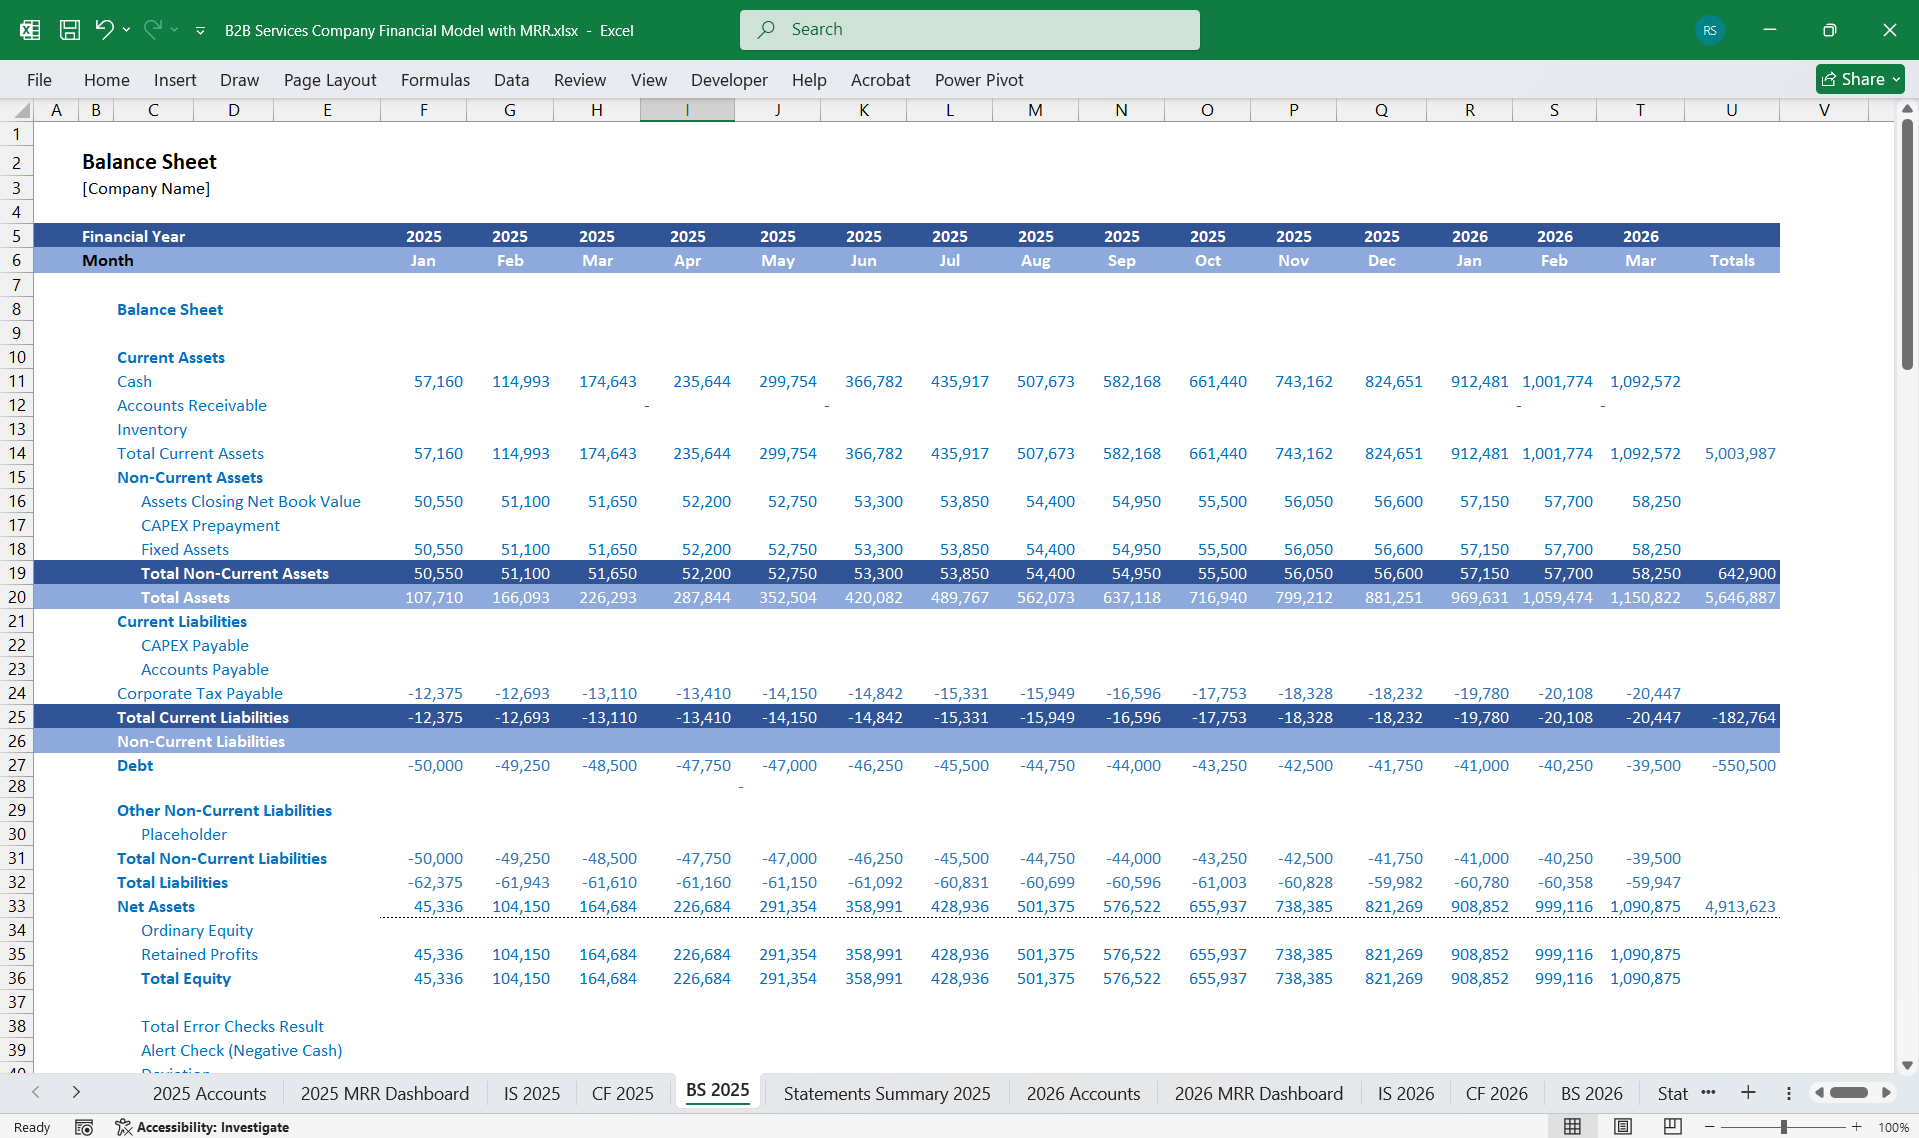
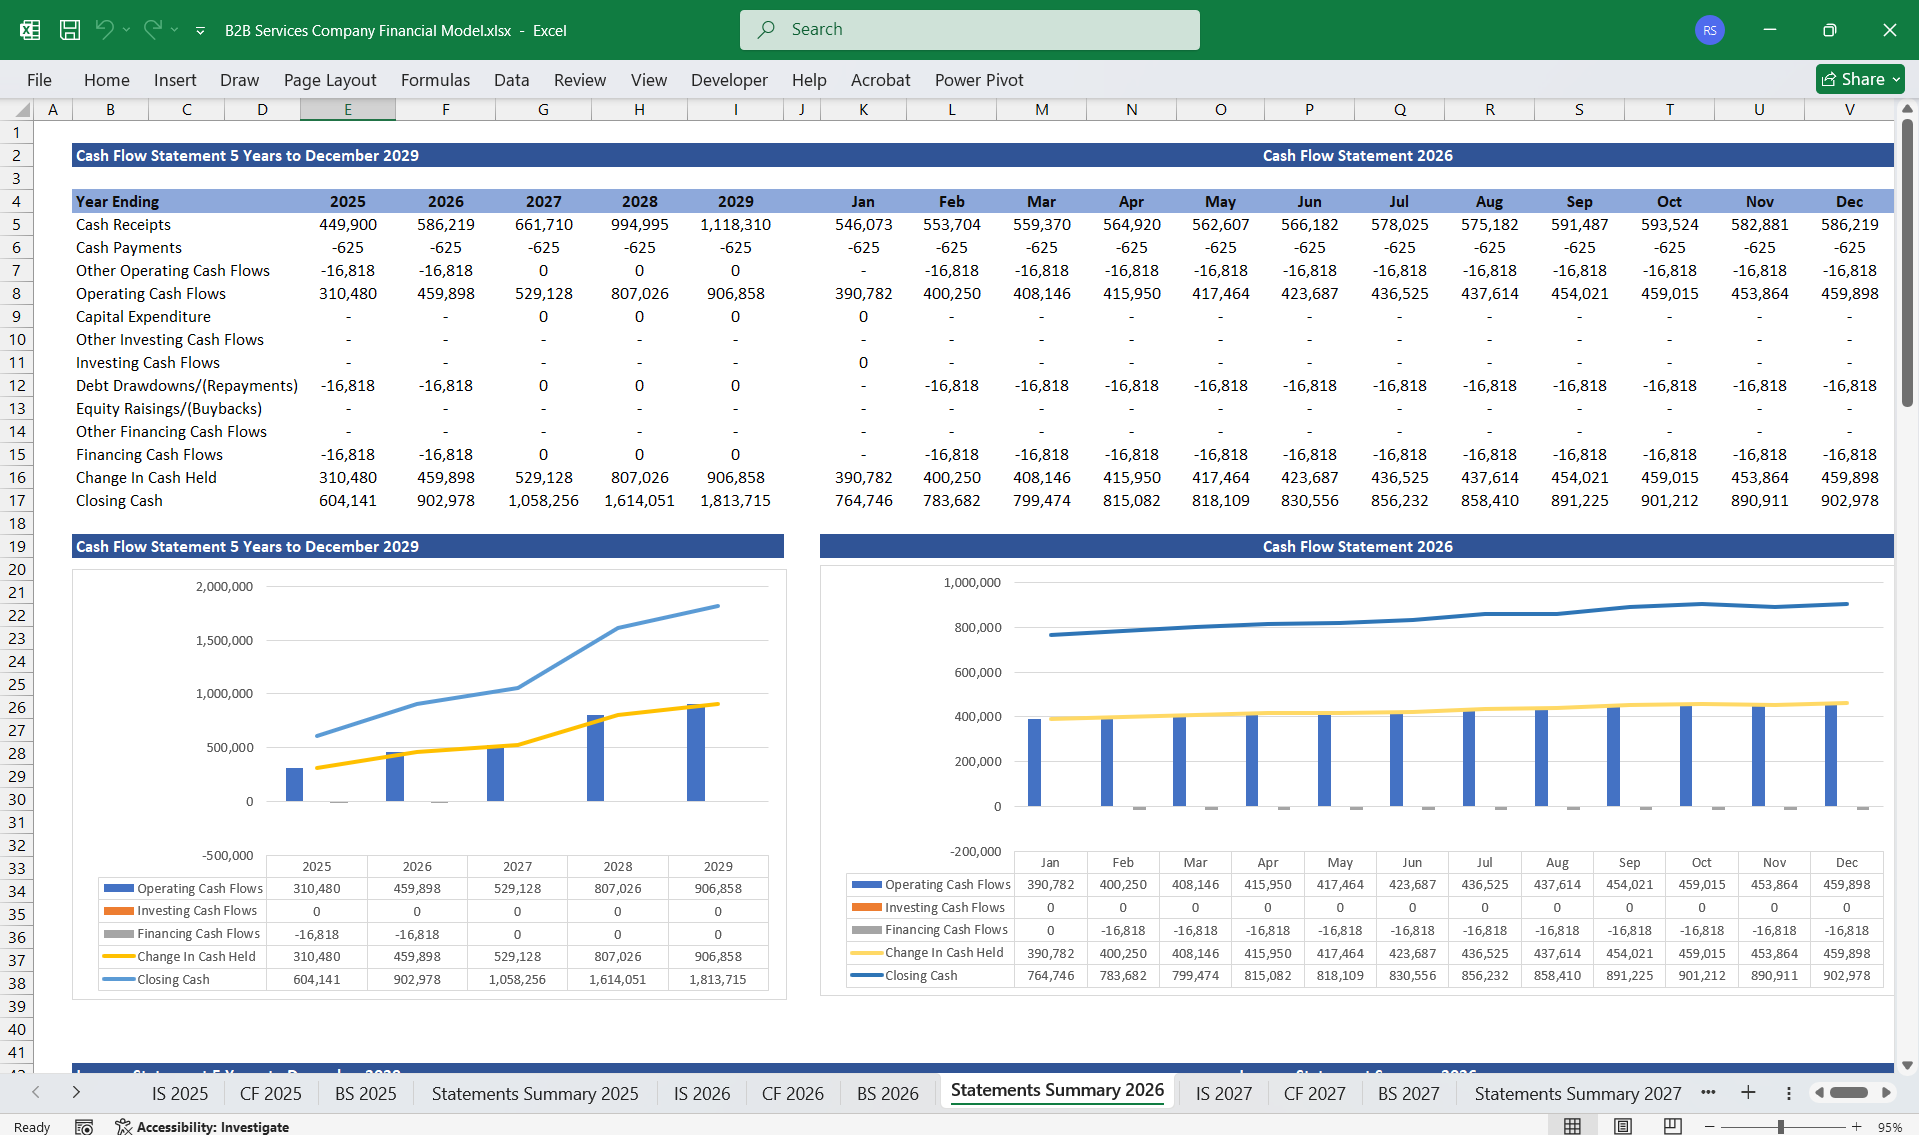
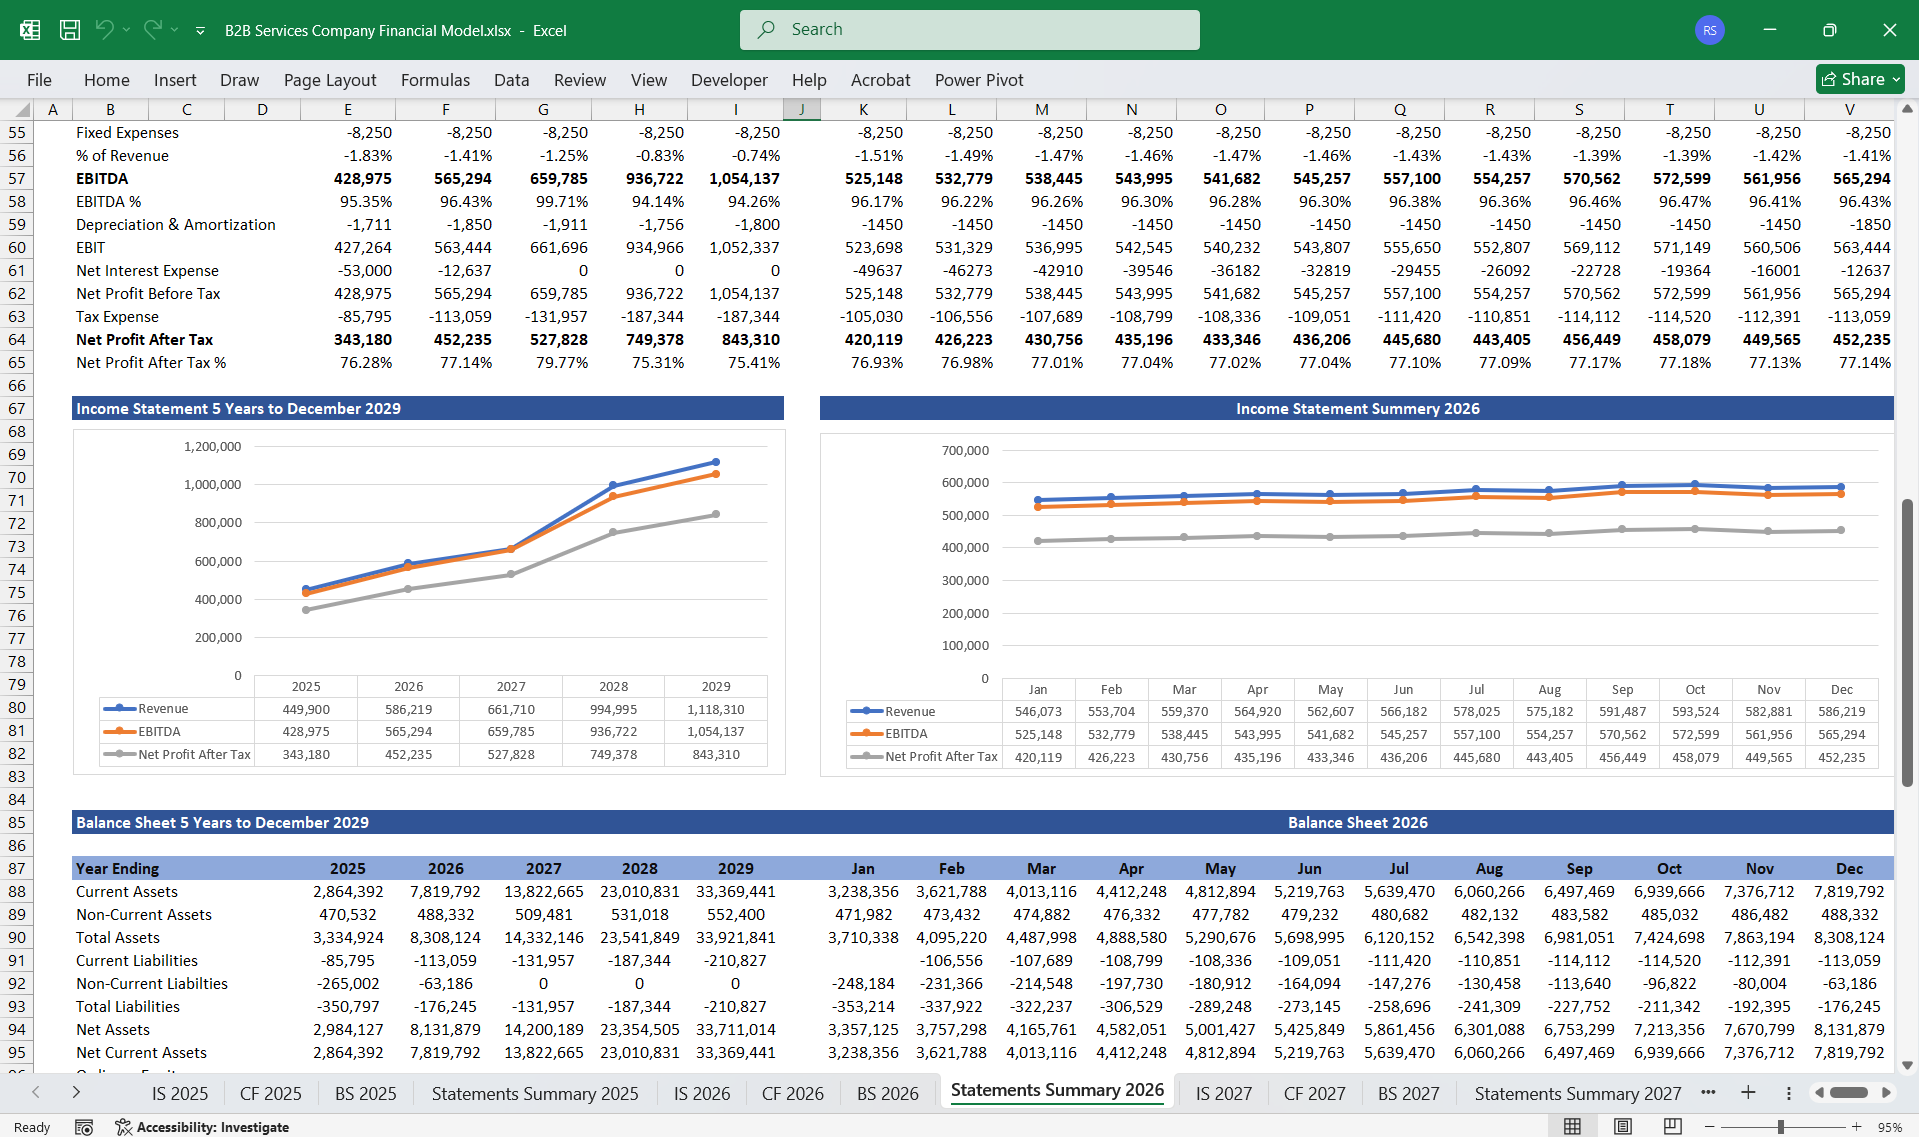
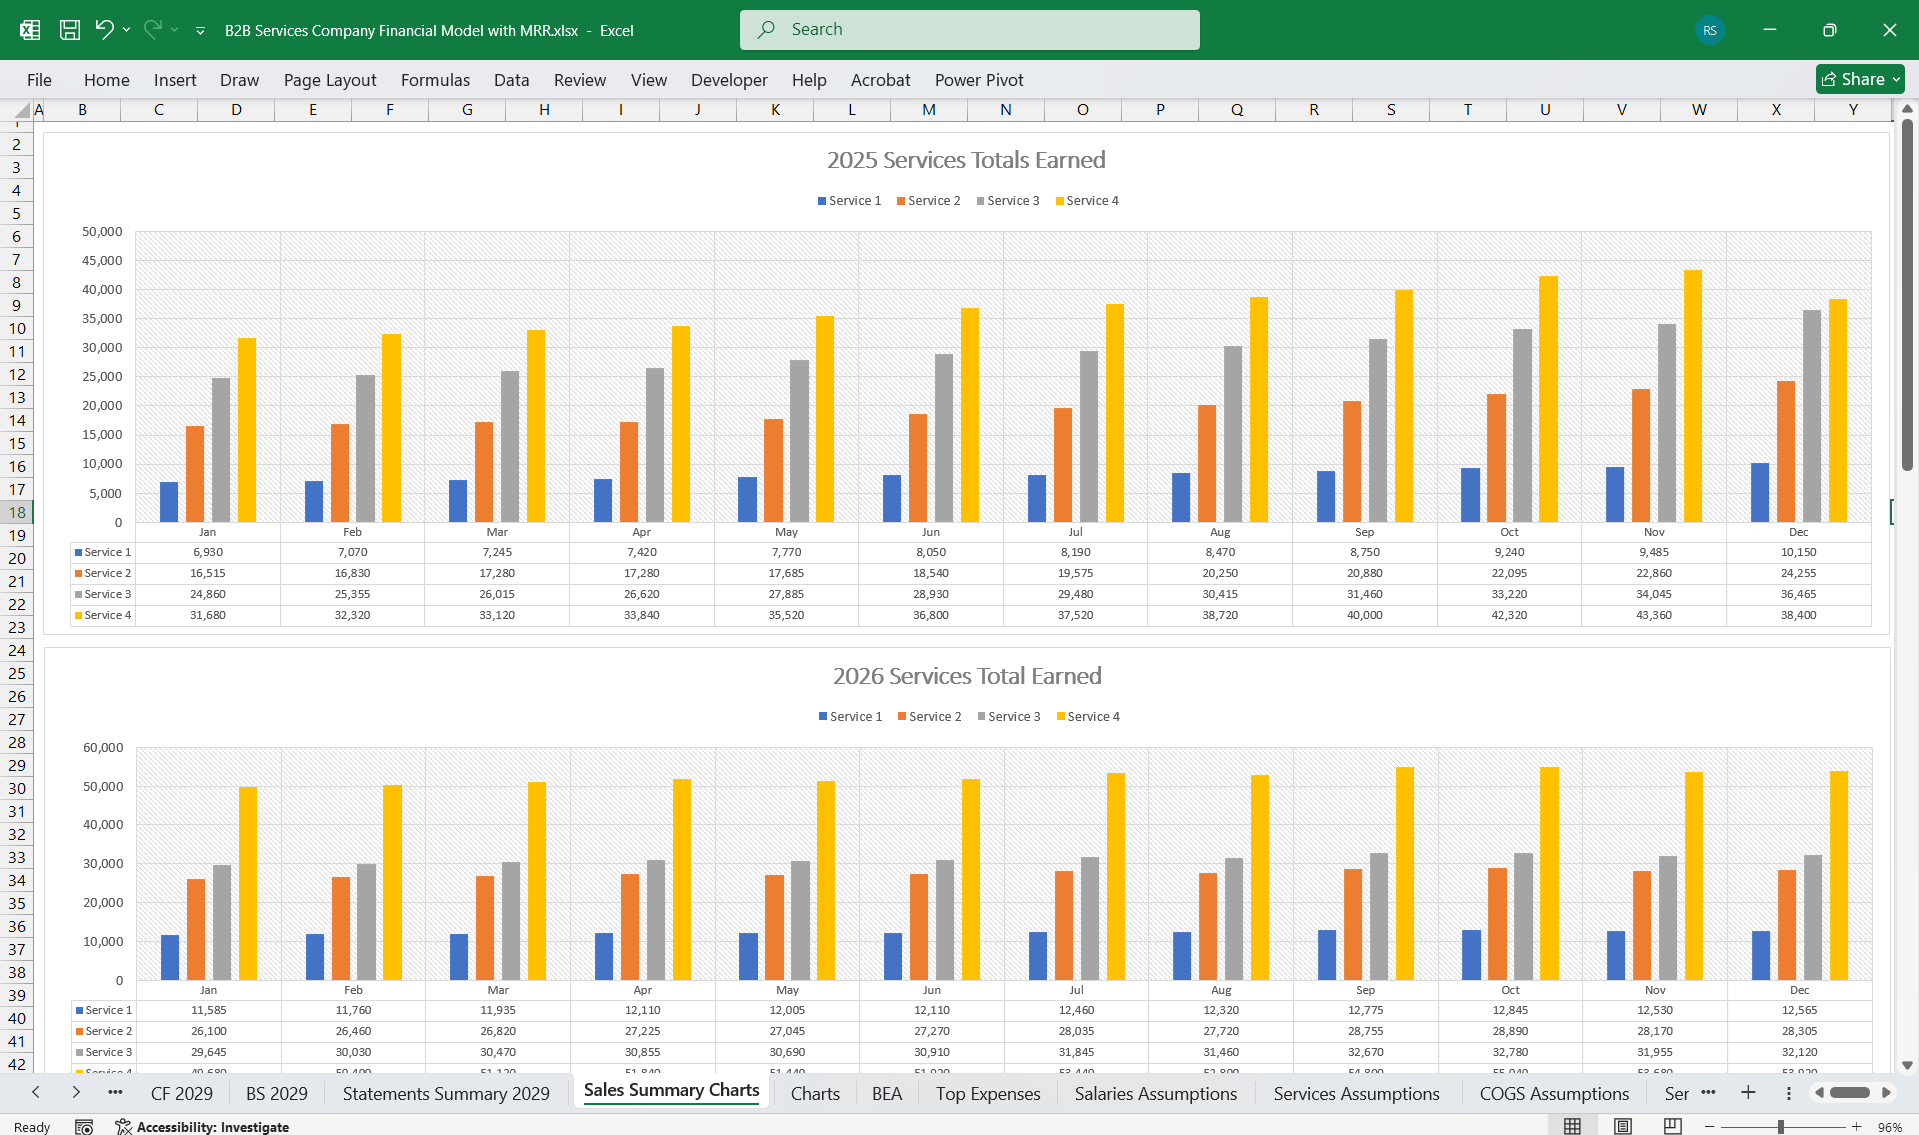
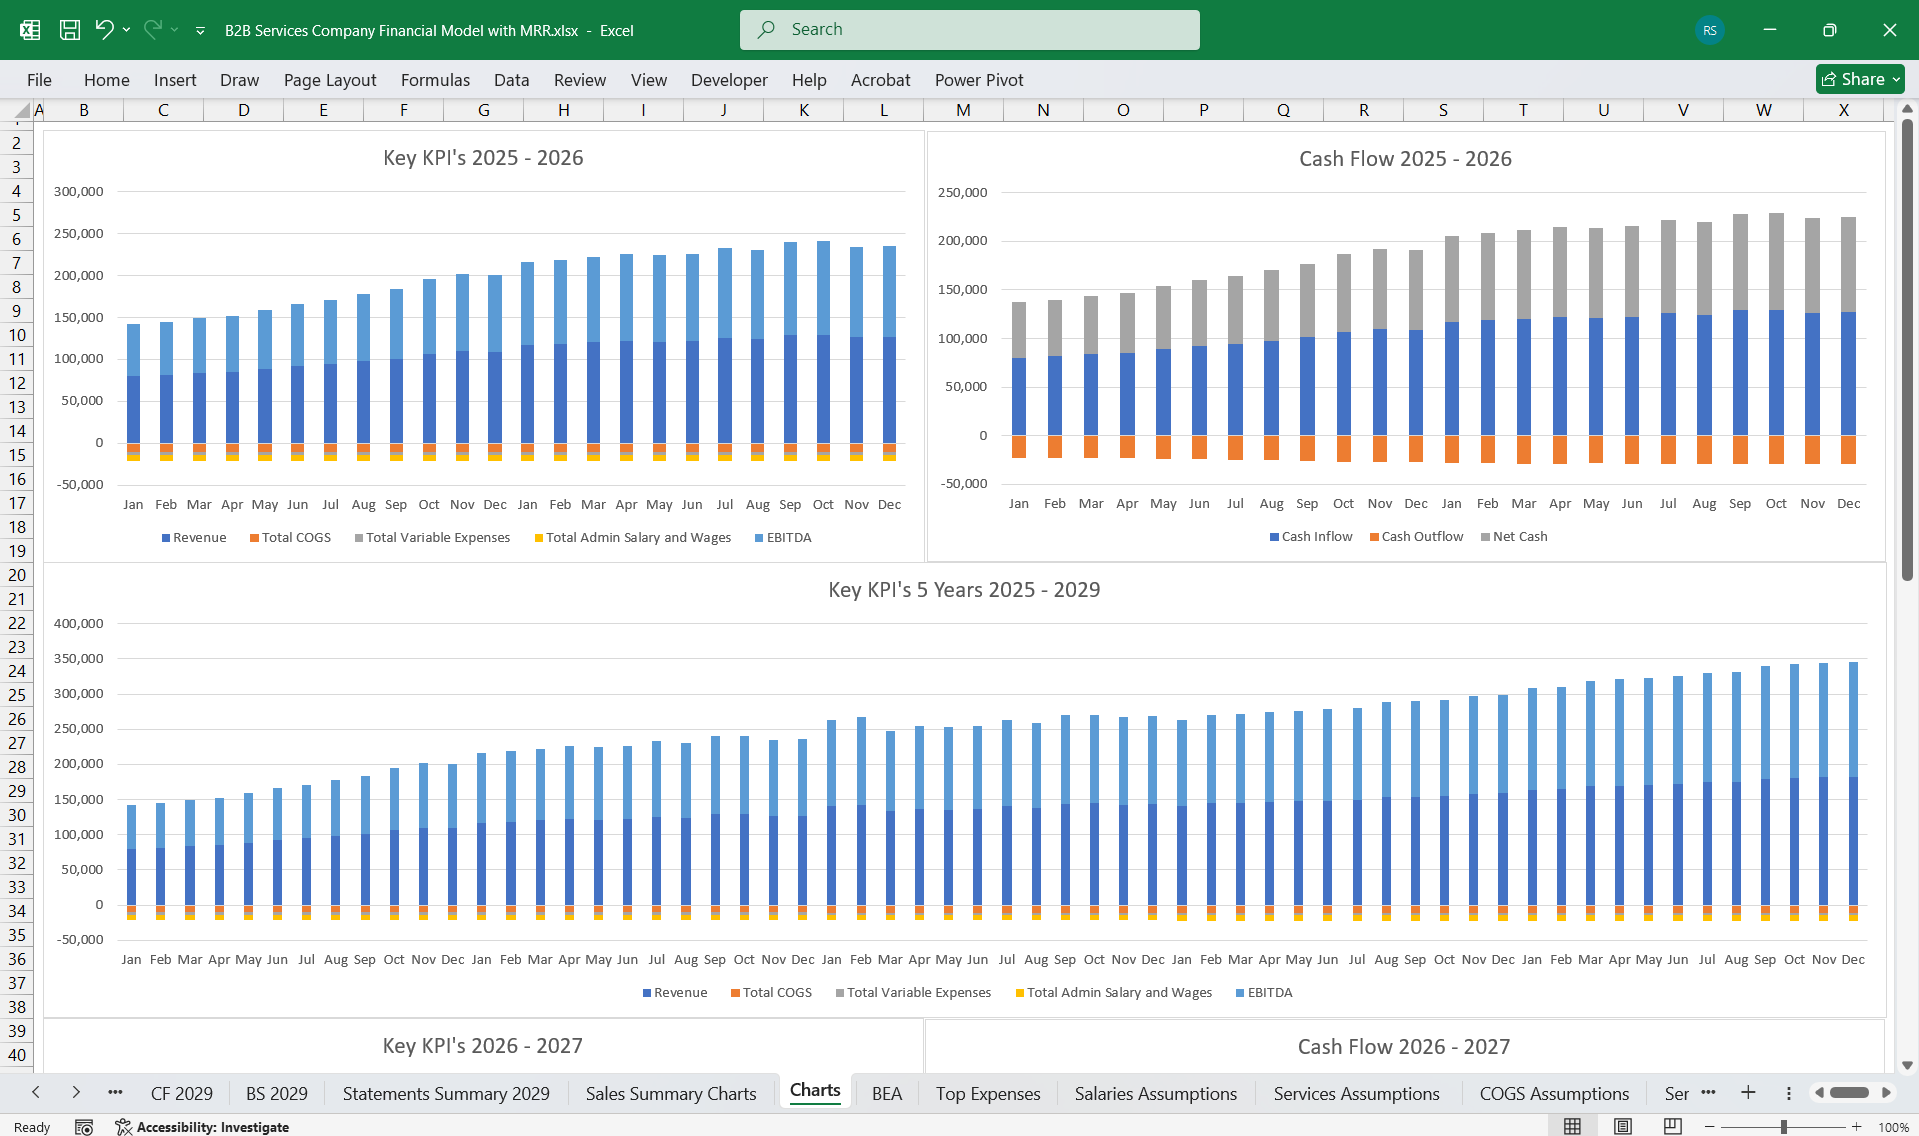
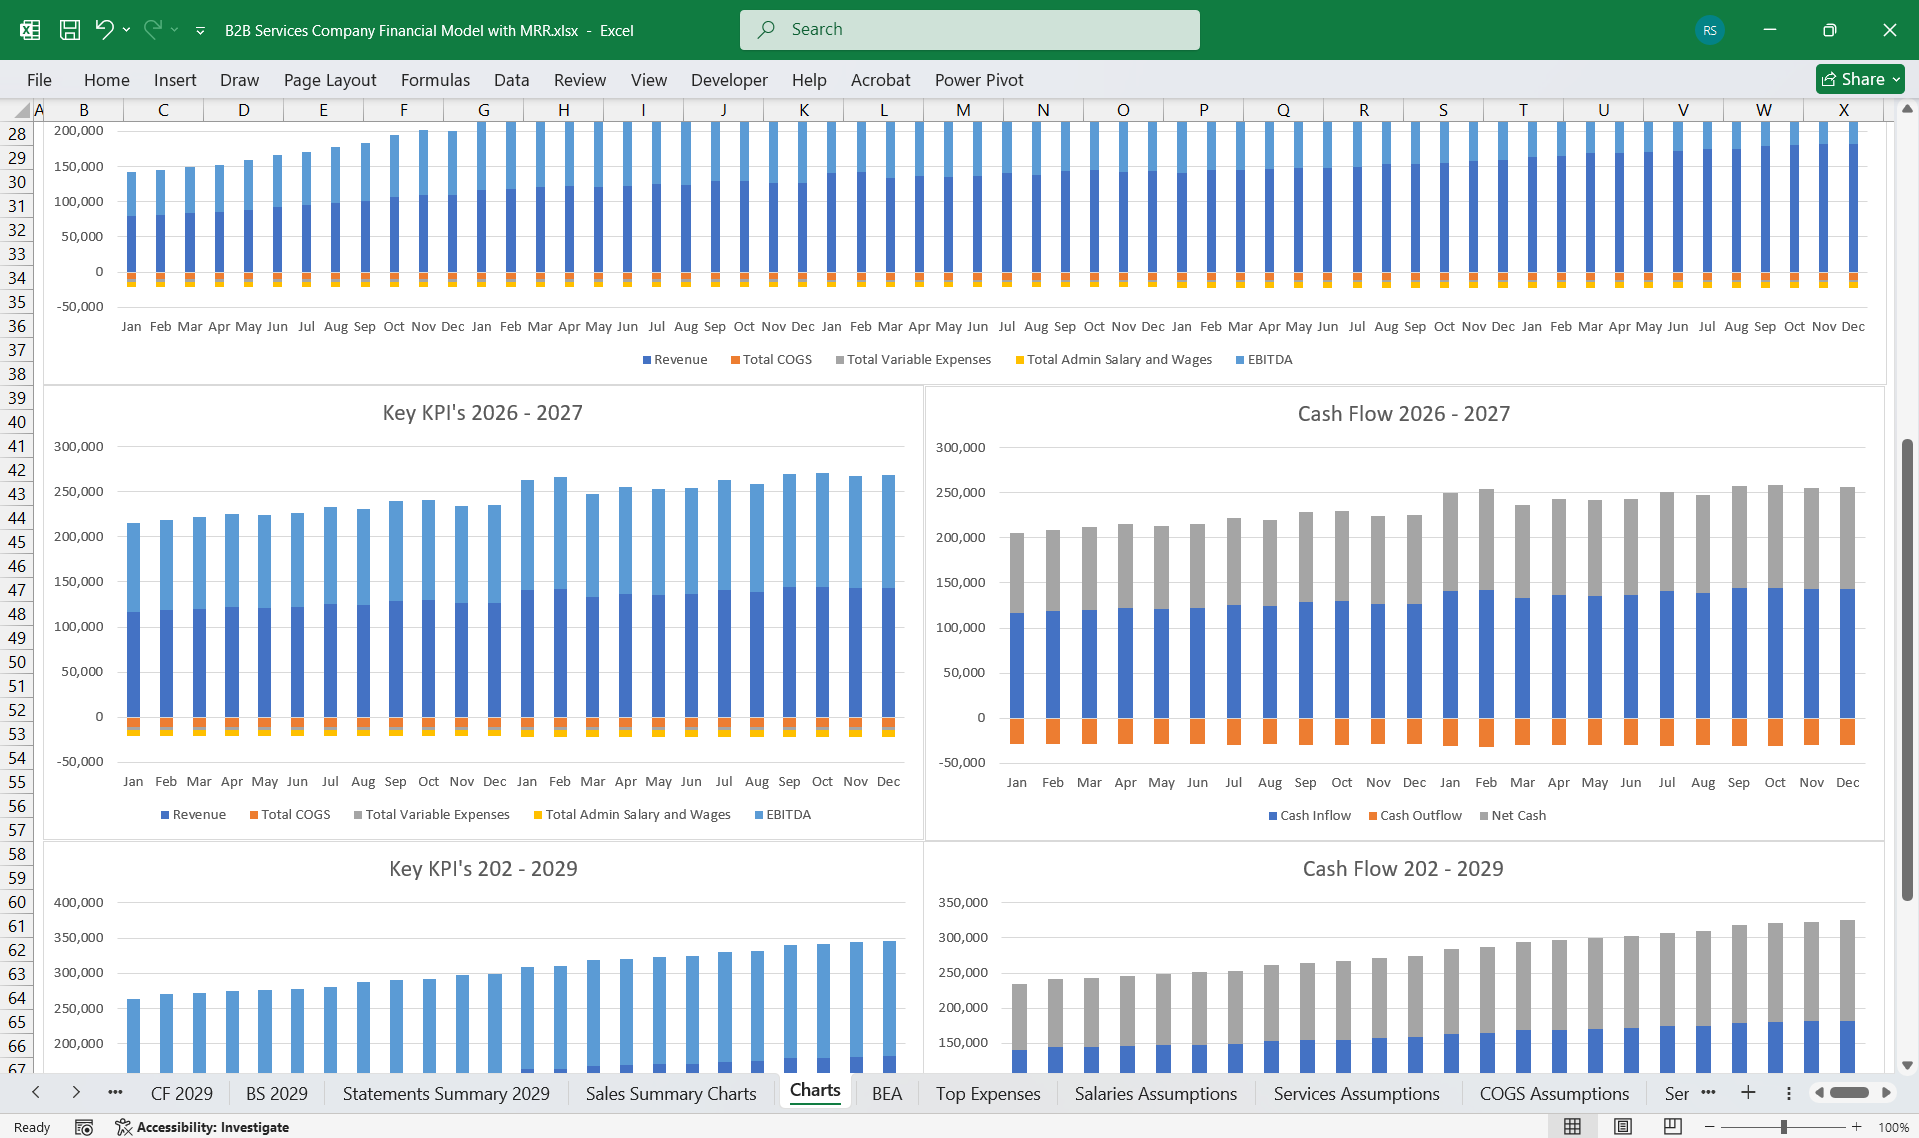
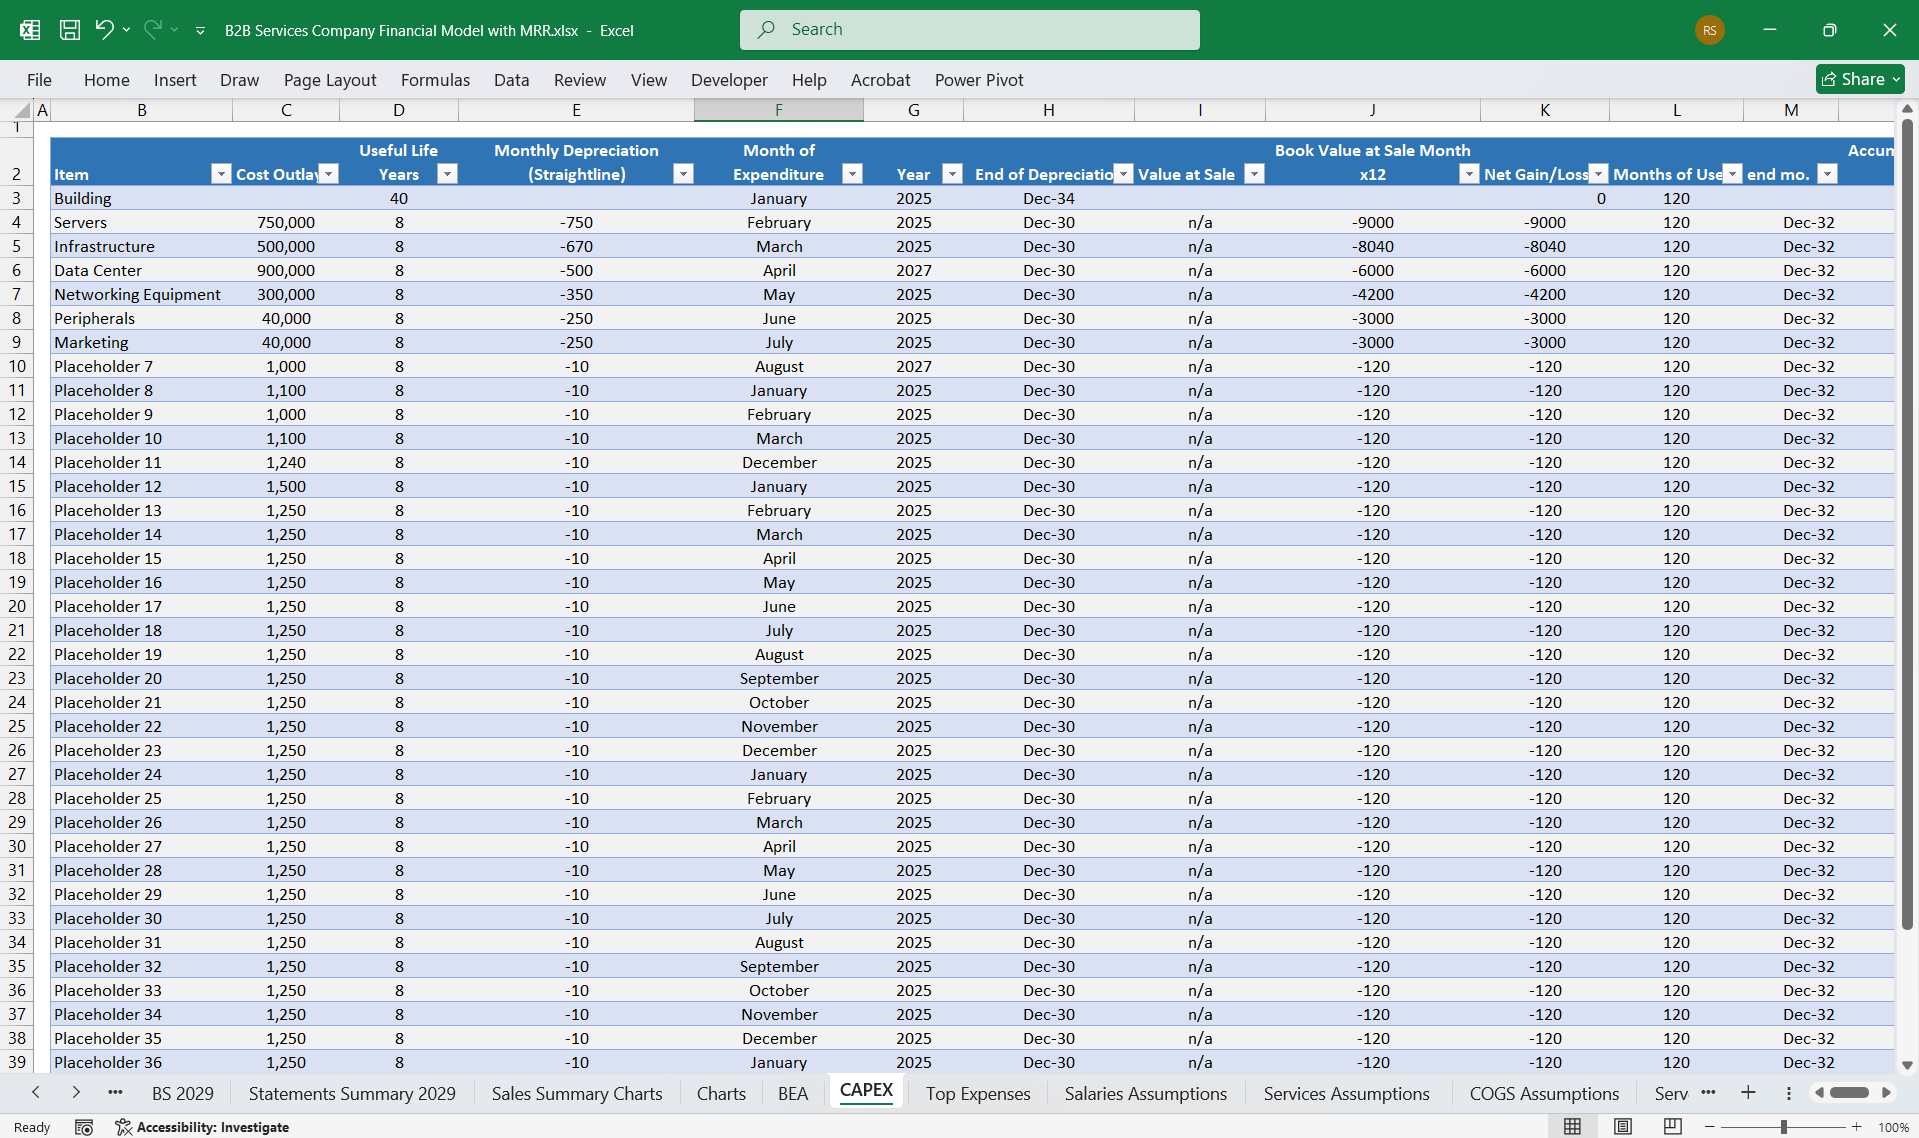
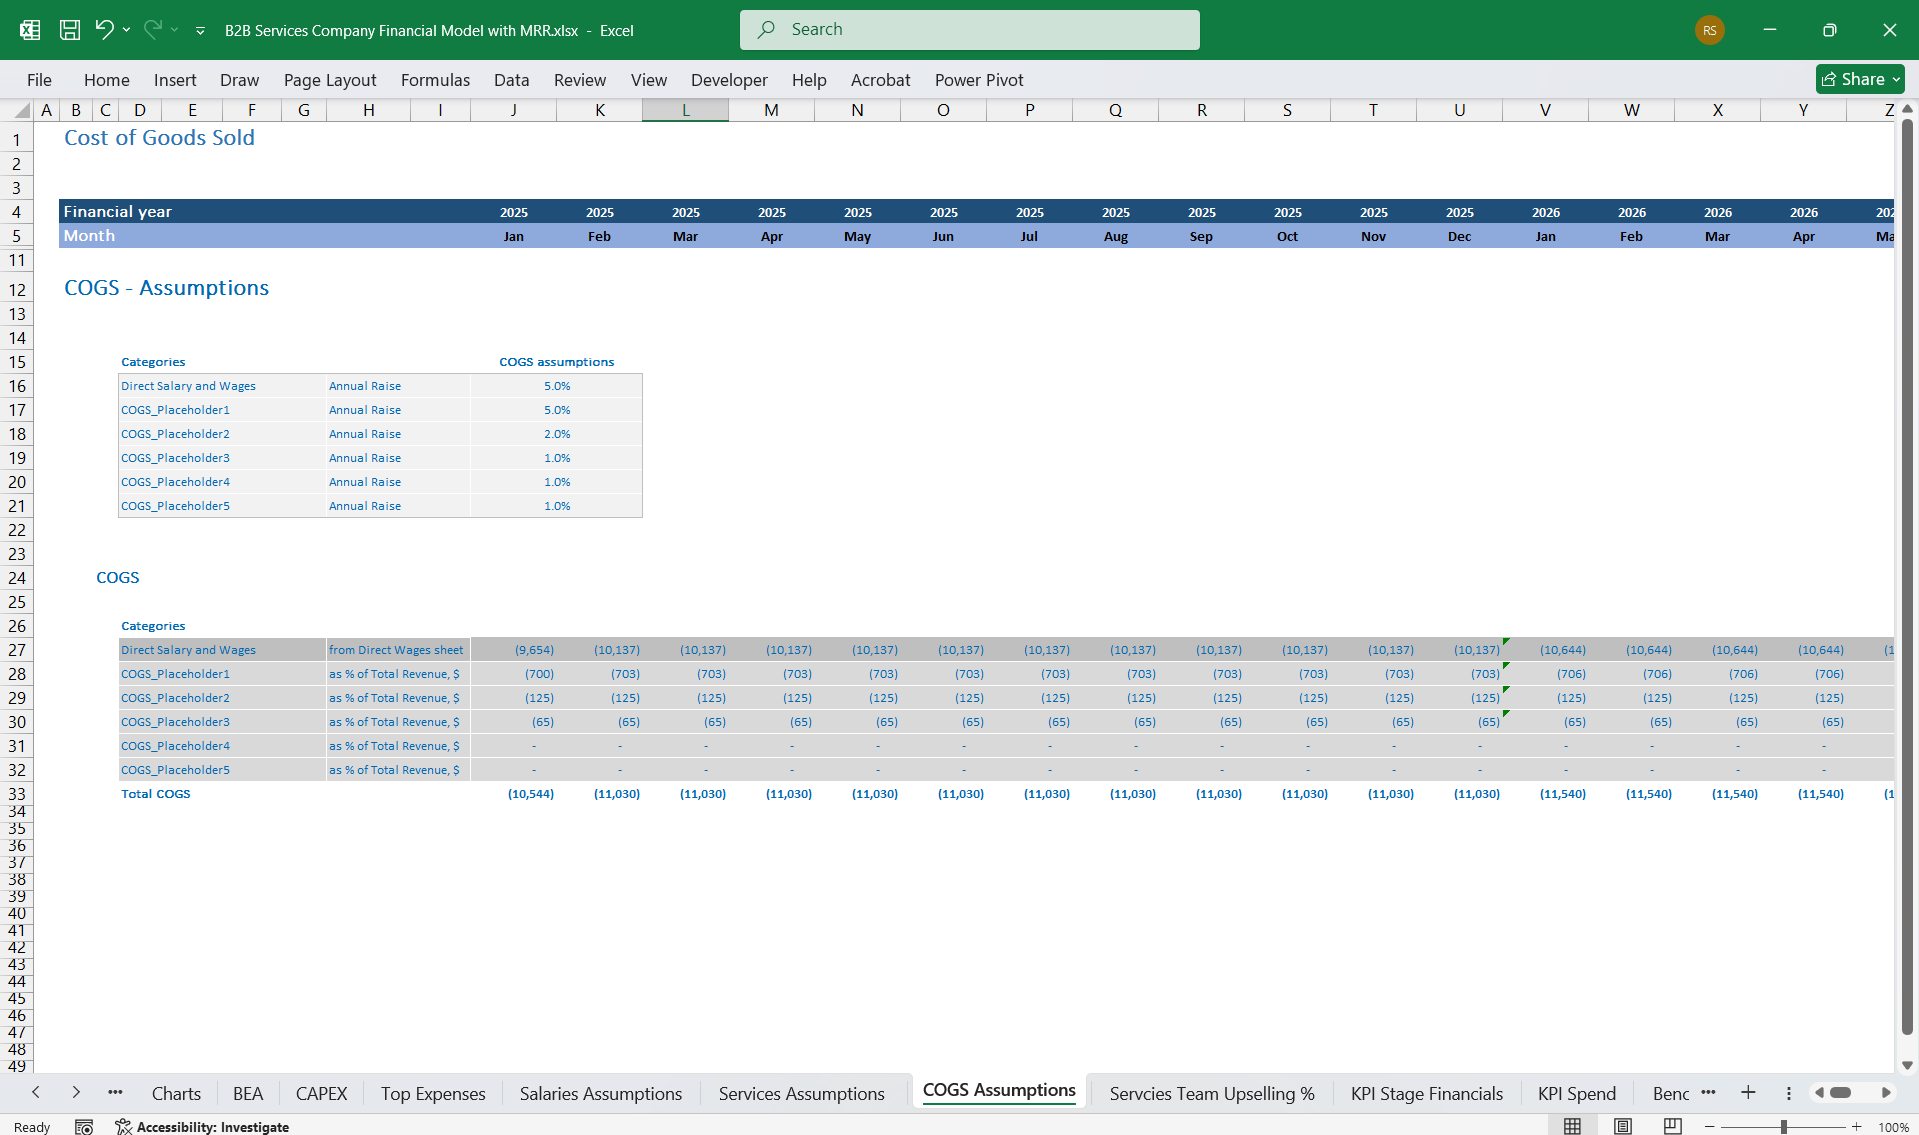
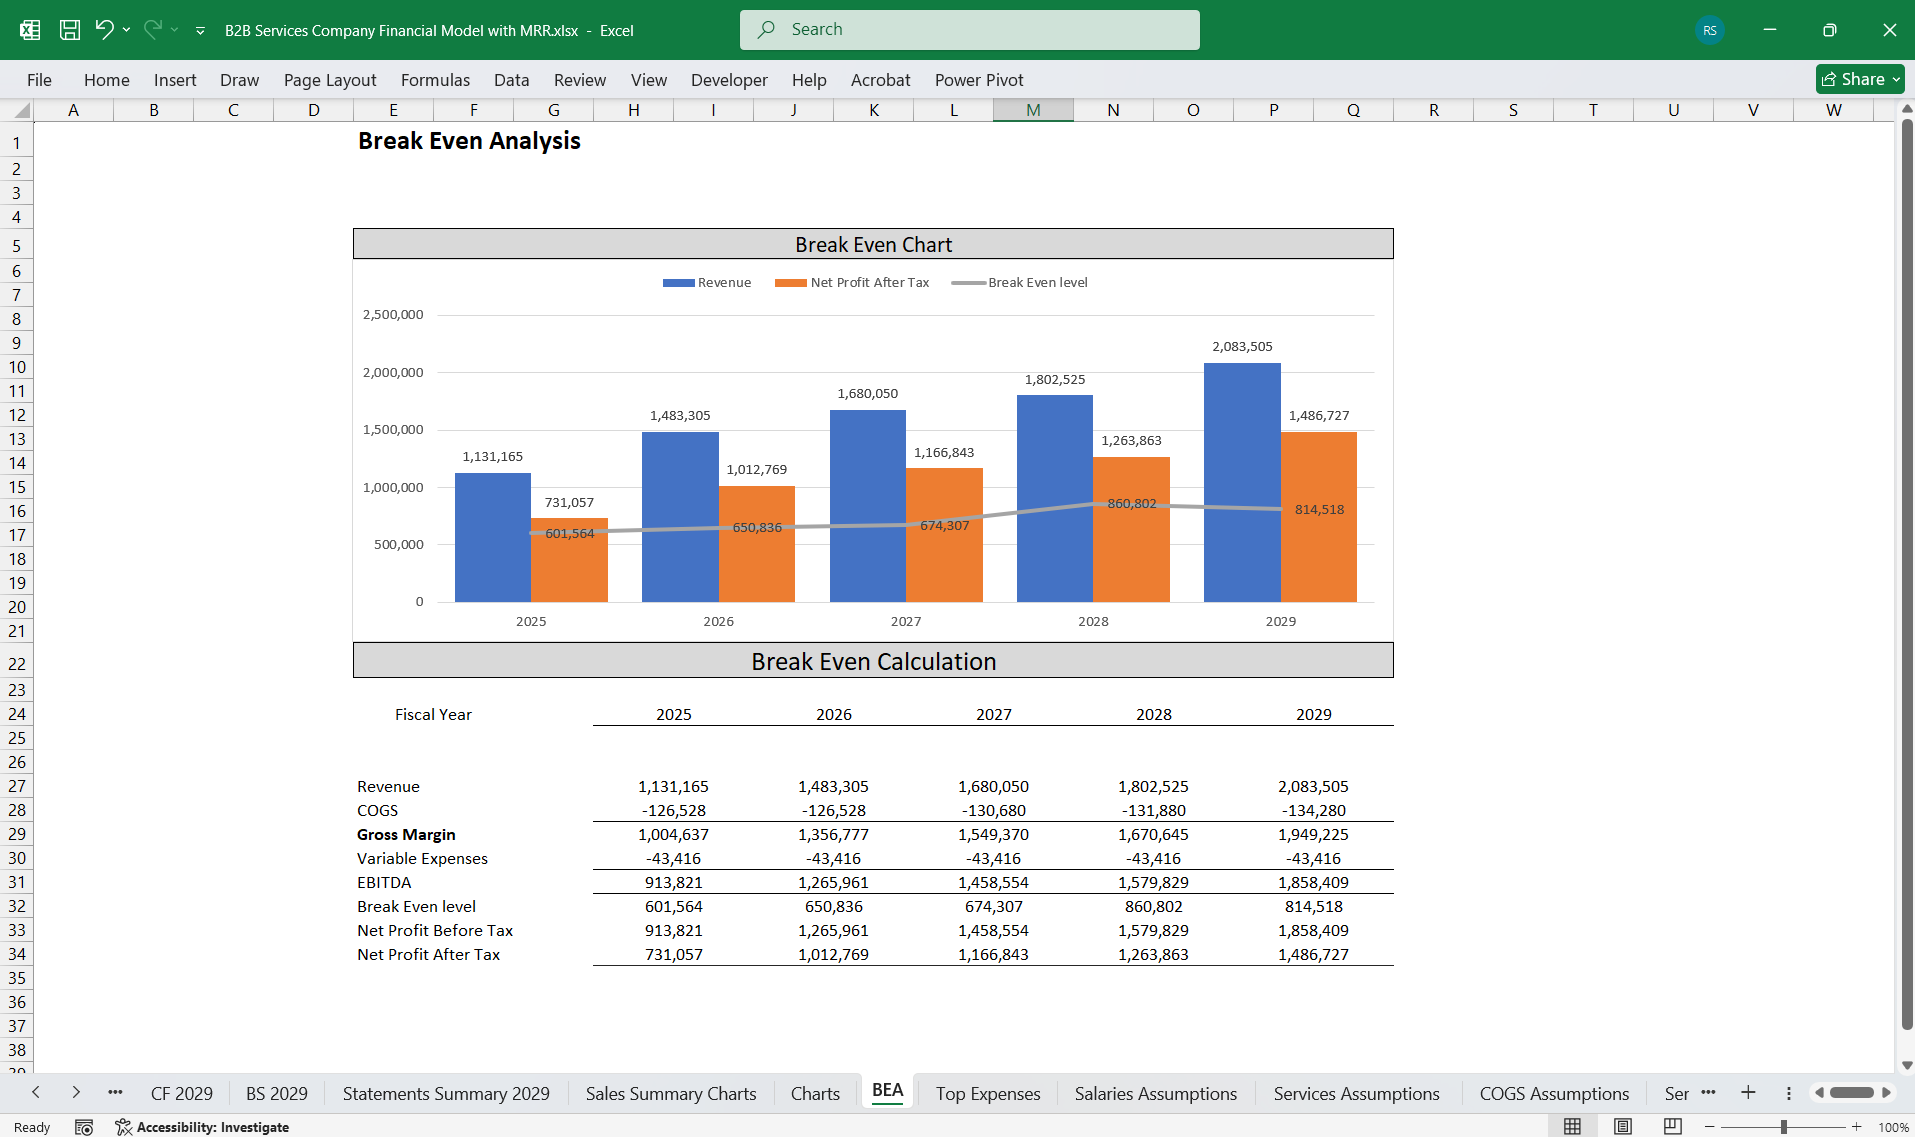
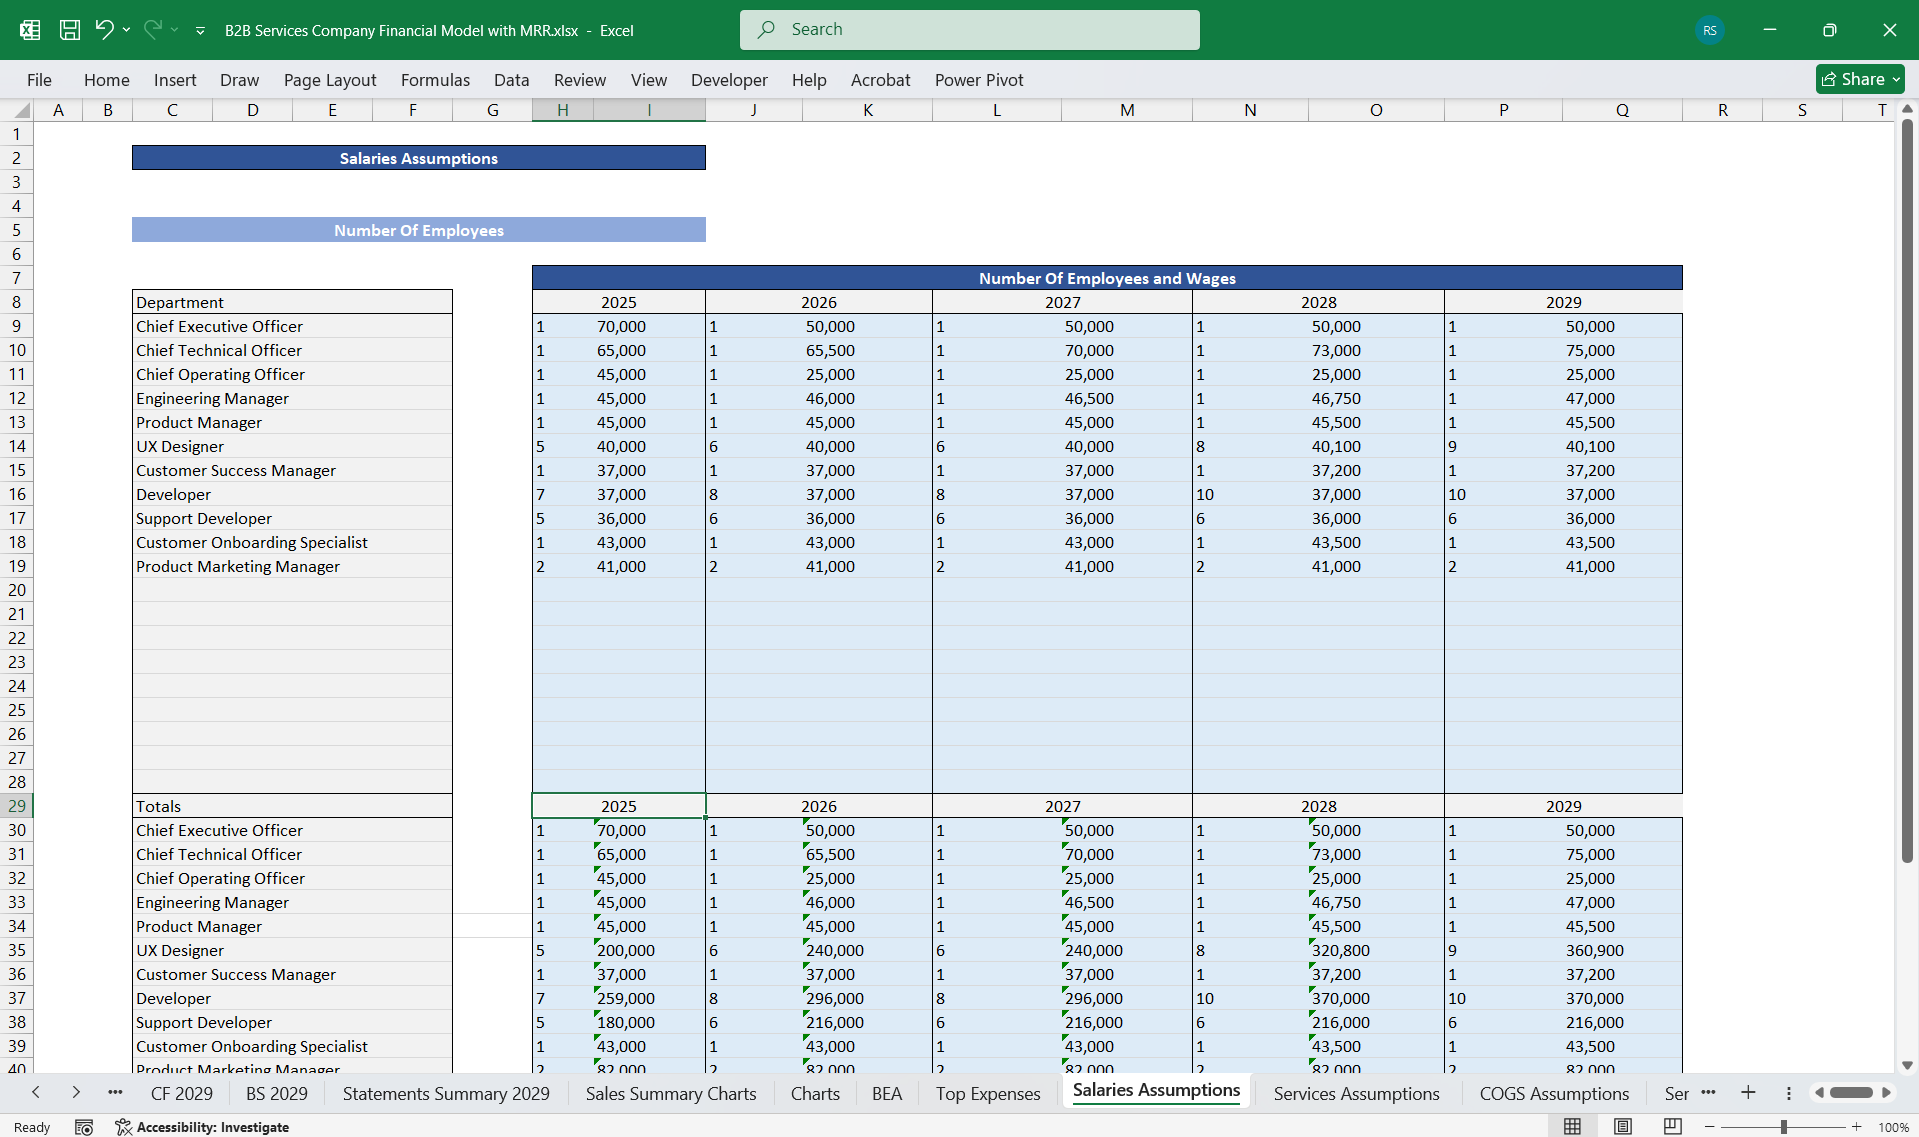
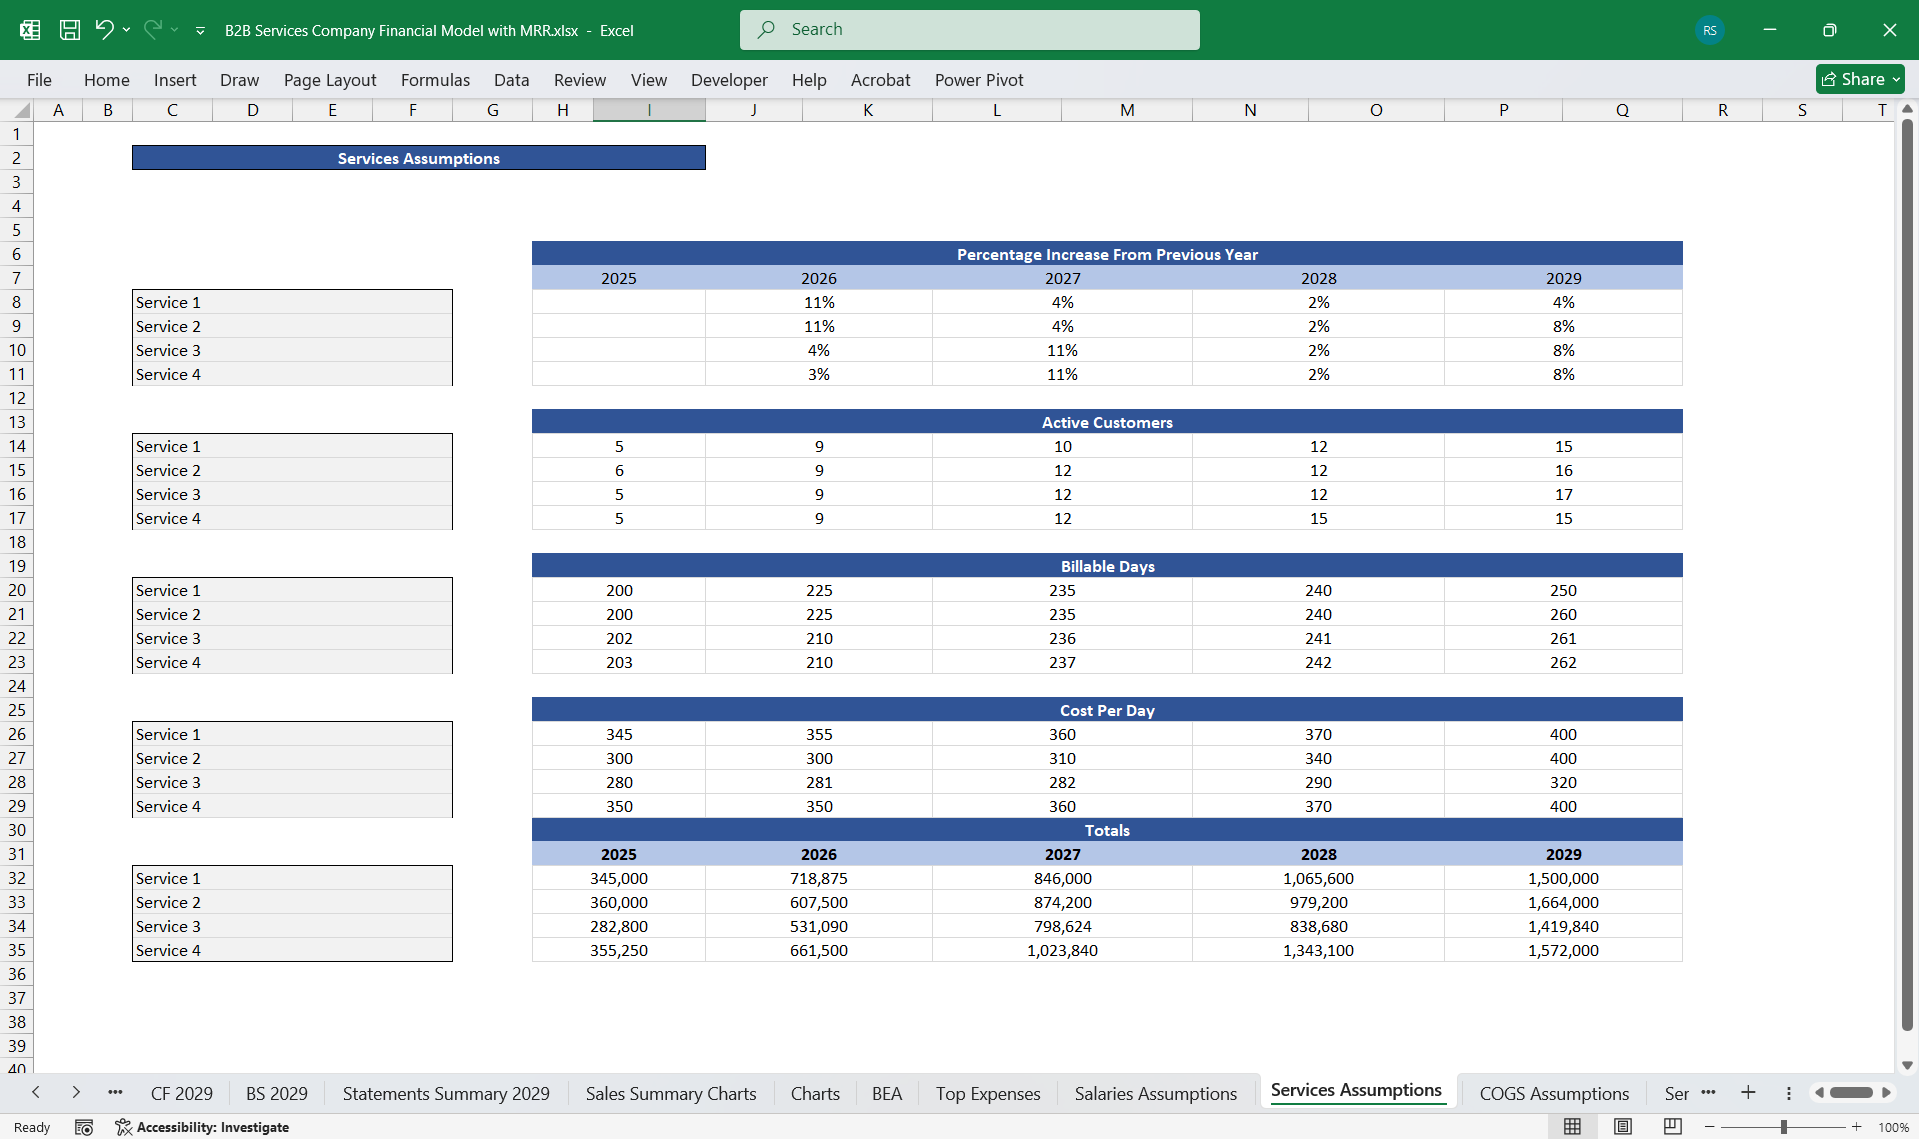
B2B Services Company Finance Model 5 Year 3 Statement
A comprehensive editable, MS Excel spreadsheet for tracking B2B Services Company finances.

At Wilcox PMO we also provide CFO Services, planning and analysis to help companies in interpreting financial statements.Follow
b2bb2b servicesservices companyfinancefinance modelfinancial modellingstartupsb2b servicecustomer serviceb2b customer service
Description
This financial model provides a detailed framework to assess the financial health and performance of a B2B Services Company.
1. Income Statement
This statement outlines the profitability of a B2B Services company over a given period.
Revenue
Subscription Revenue:
Monthly subscriptions = MRR × Number of active subscribers.
Yearly subscriptions = ARR-driven revenue (discounted annual plans).
Ad Revenue (if applicable):
Ad-based tier revenue = Ads viewed × CPM (cost per thousand impressions).
Affiliate Revenue: Generated through partnerships and cross-promotions.
Expenses
Cost of Revenue:
Content Licensing: Payments for licensed content, amortized over time.
Content Production: In-house creation of exclusive shows/movies.
Hosting and Delivery: Cloud services for video storage and bandwidth usage.
Customer Support: Costs of handling customer inquiries and issues.
Operating Expenses:
Marketing and Sales: Paid ads, influencer collaborations, and SEO costs.
General and Administrative: Salaries, office expenses, and other overheads.
Research and Development: Investments in platform improvements and technology.
Depreciation and Amortization: This is for production equipment and intangible assets like exclusive content rights.
Profitability Metrics
Gross Profit = Revenue - Cost of Revenue.
Operating Profit = Gross Profit - Operating Expenses.
Net Profit = Operating Profit - Taxes.
2. Cash Flow Statement
This statement provides insight into cash inflows and outflows, categorized into three activities.
Operating Activities
Cash Inflows:
Subscription receipts (monthly/annual).
Ad revenue payments received.
Cash Outflows:
Payments for content licensing and production.
Salaries and wages.
Marketing campaigns.
Technology expenses (hosting, infrastructure).
Investing Activities
Cash Inflows:
Sale of assets (if applicable).
Investment returns.
Cash Outflows:
Purchases of new content assets.
Investments in platform infrastructure and technology.
Financing Activities
Cash Inflows:
Proceeds from investors (venture capital, IPO, etc.).
Debt financing.
Cash Outflows:
Dividend payments (if any).
Loan repayments.
Key Metrics
Free Cash Flow = Net Cash from Operating Activities - Capital Expenditures.
Burn Rate (for early-stage companies): Monthly cash usage rate.
3. Balance Sheet
The balance sheet captures the financial position of the company at a given point in time.
Assets
Current Assets:
Cash and cash equivalents.
Accounts receivable (e.g., from advertisers or affiliates).
Prepaid expenses (e.g., prepaid hosting fees).
Non-Current Assets:
Content Library:
Licensed Content (value amortized over time).
Produced Content (in-house creation costs capitalized).
Property, Plant, and Equipment (e.g., production equipment).
Intangible Assets (e.g., patents, trademarks).
Liabilities
Current Liabilities:
Accounts payable (e.g., owed to content producers).
Deferred Revenue (e.g., annual subscriptions prepaid but not yet earned).
Accrued Expenses (e.g., unpaid salaries, marketing expenses).
Non-Current Liabilities:
Long-term debt or loans.
Equity
Common stock.
Retained earnings.
Key Metrics
Current Ratio = Current Assets / Current Liabilities.
Debt-to-Equity Ratio = Total Liabilities / Total Equity.
This financial model is adaptable, and its metrics should align with the strategic goals of the B2B Service, whether focused on scaling the user base, maximizing profitability, or securing investment.
Provides thorough oversight, tracking, and reporting of B2B Services Company finances, including updates on budget utilisation and projections.
Eliminates the need to create project finance trackers from scratch and includes all common B2B Service company actual and projection components.
This Best Practice includes
Excel Financial Model
Further information
Eliminates the need to create project finance trackers from scratch and includes all common B2B Services Company actual and projection components.