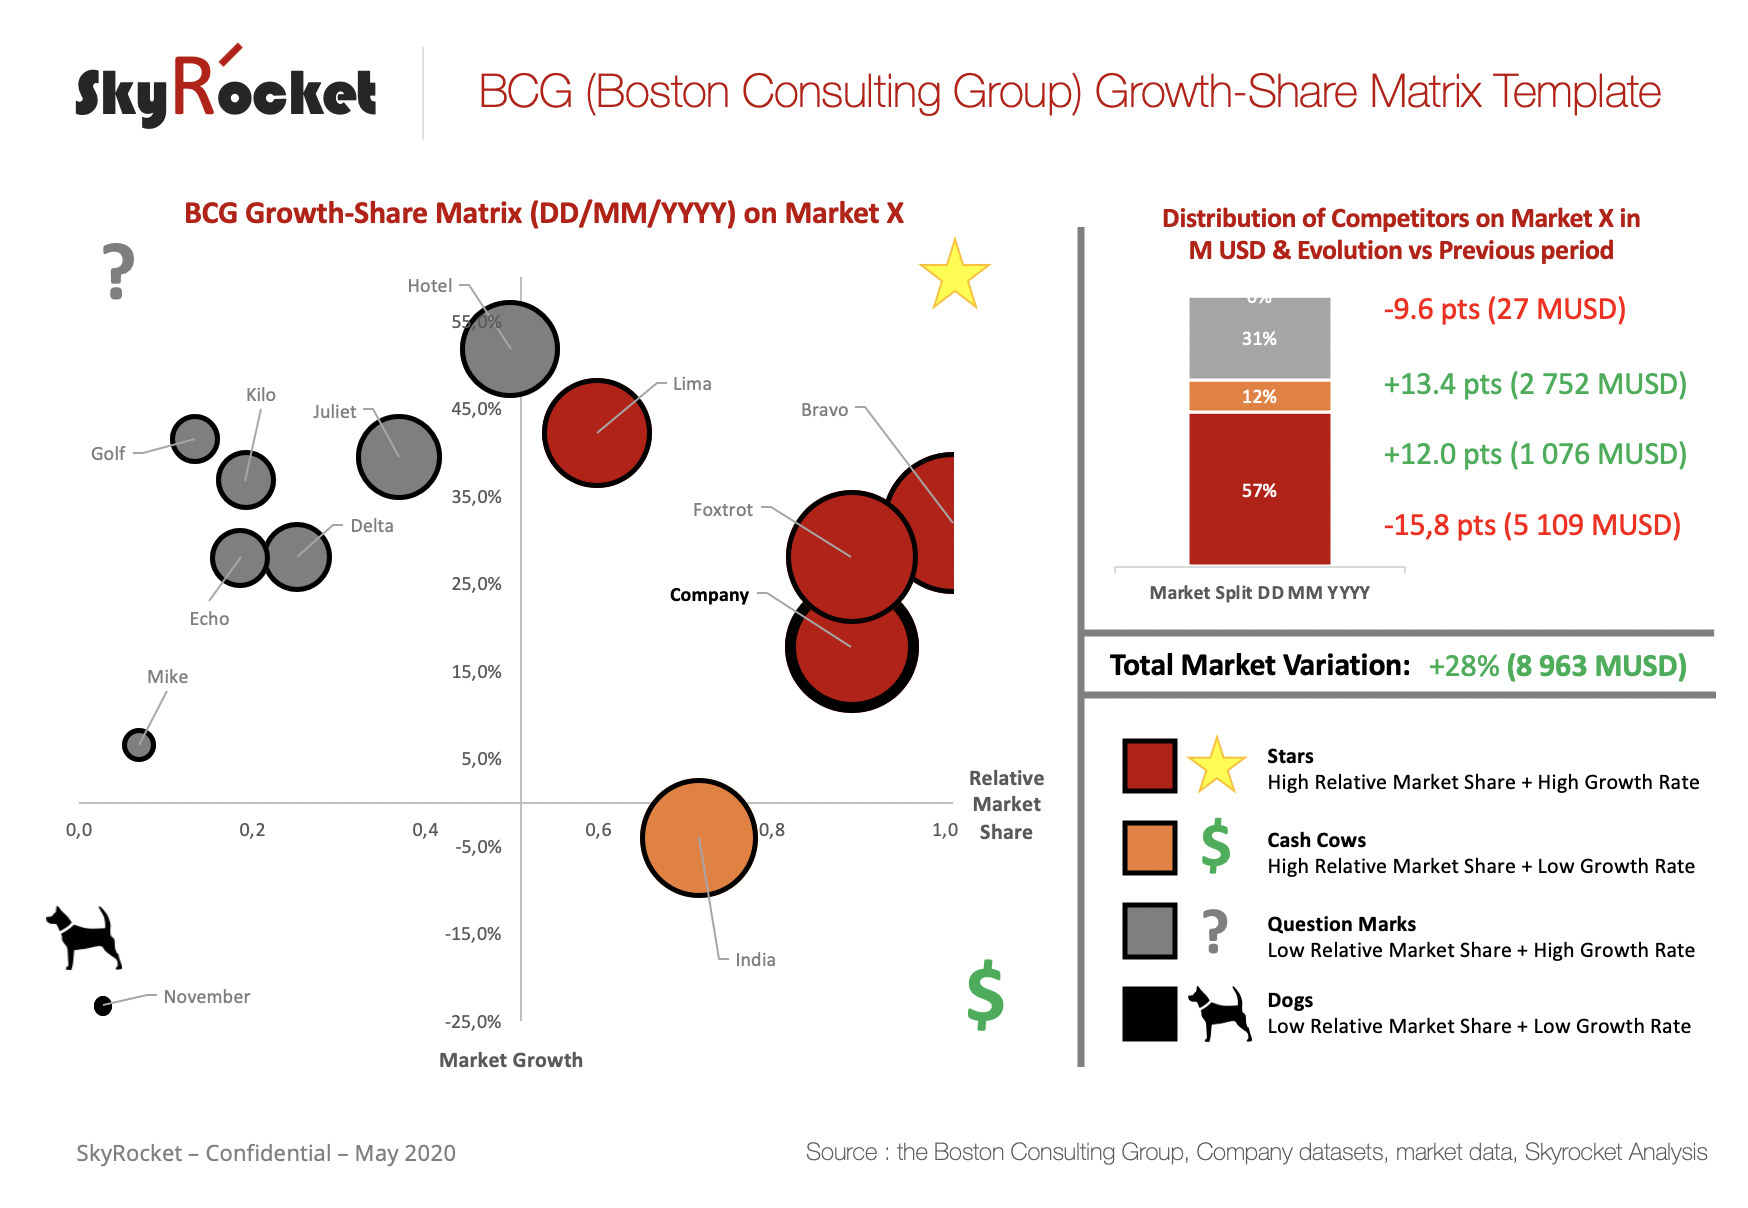
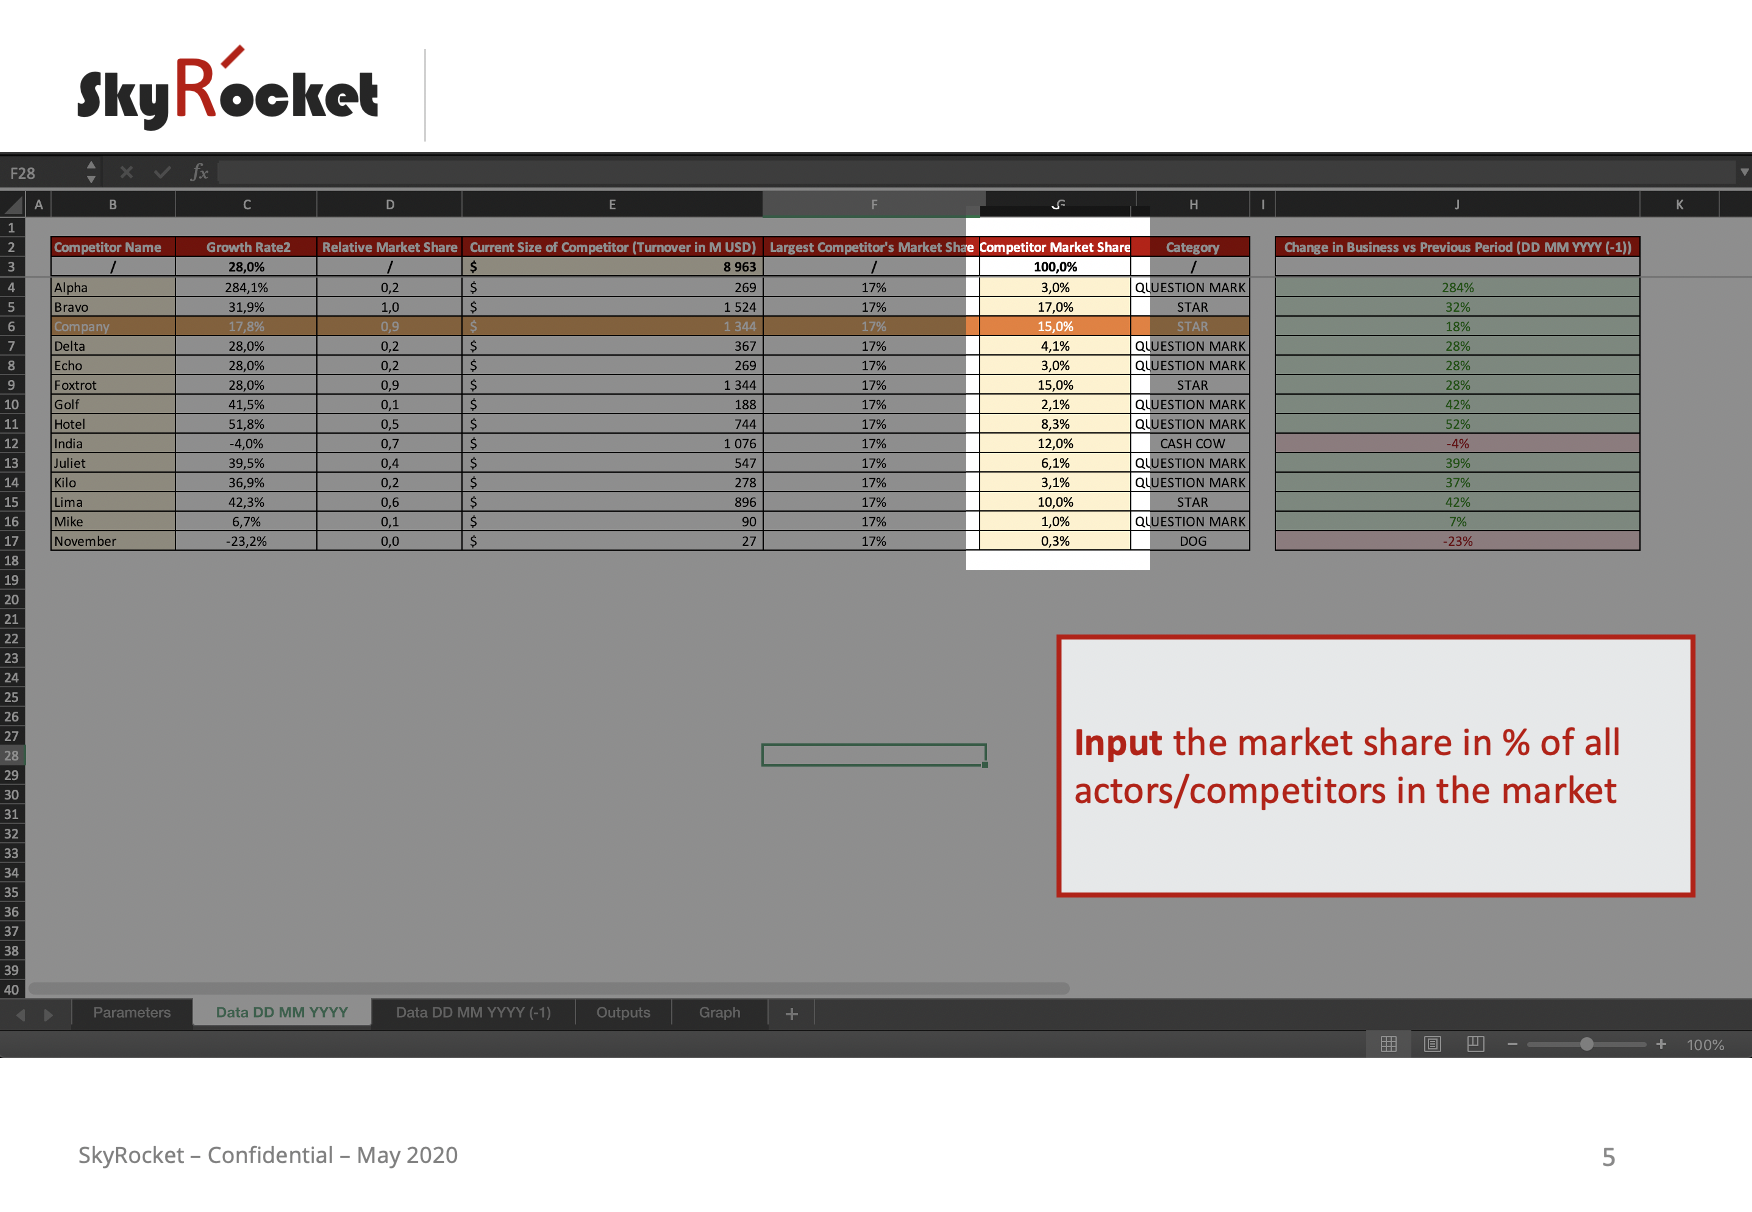
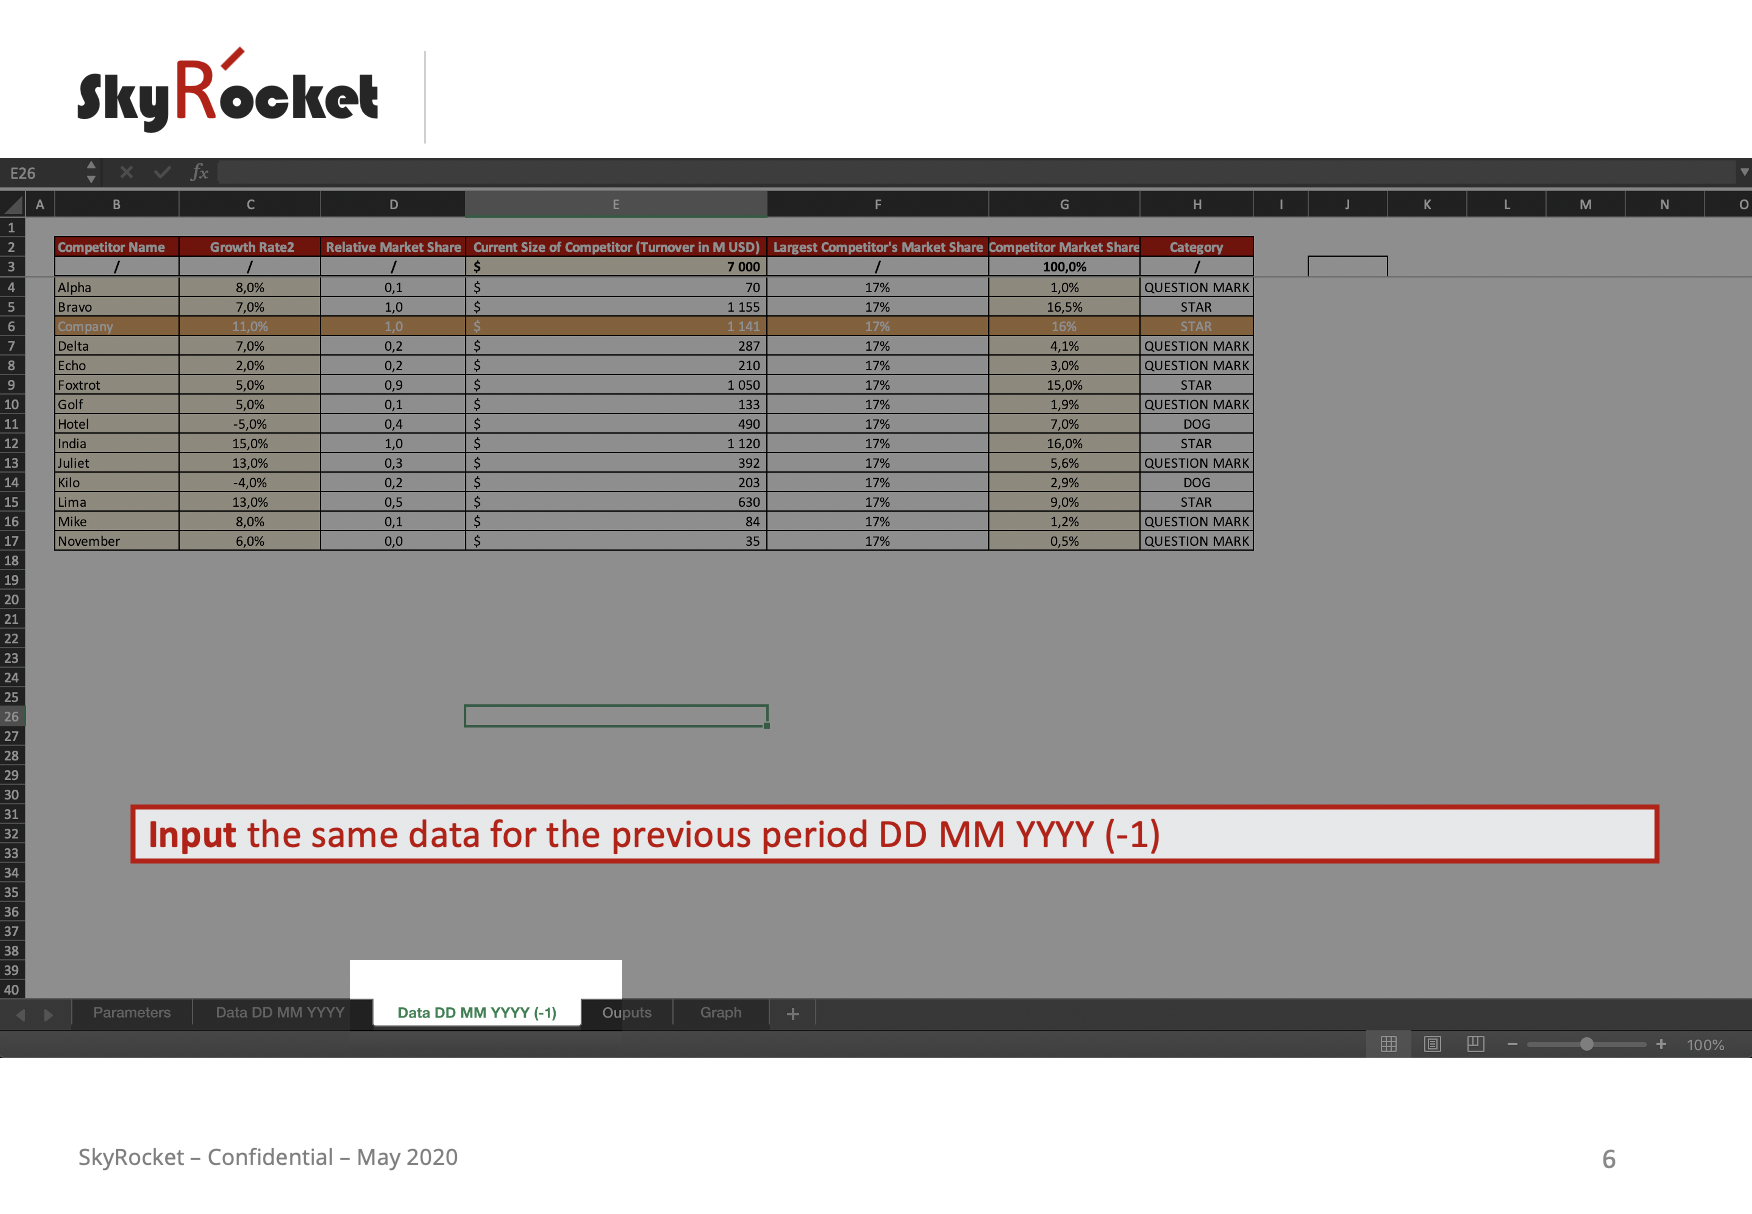
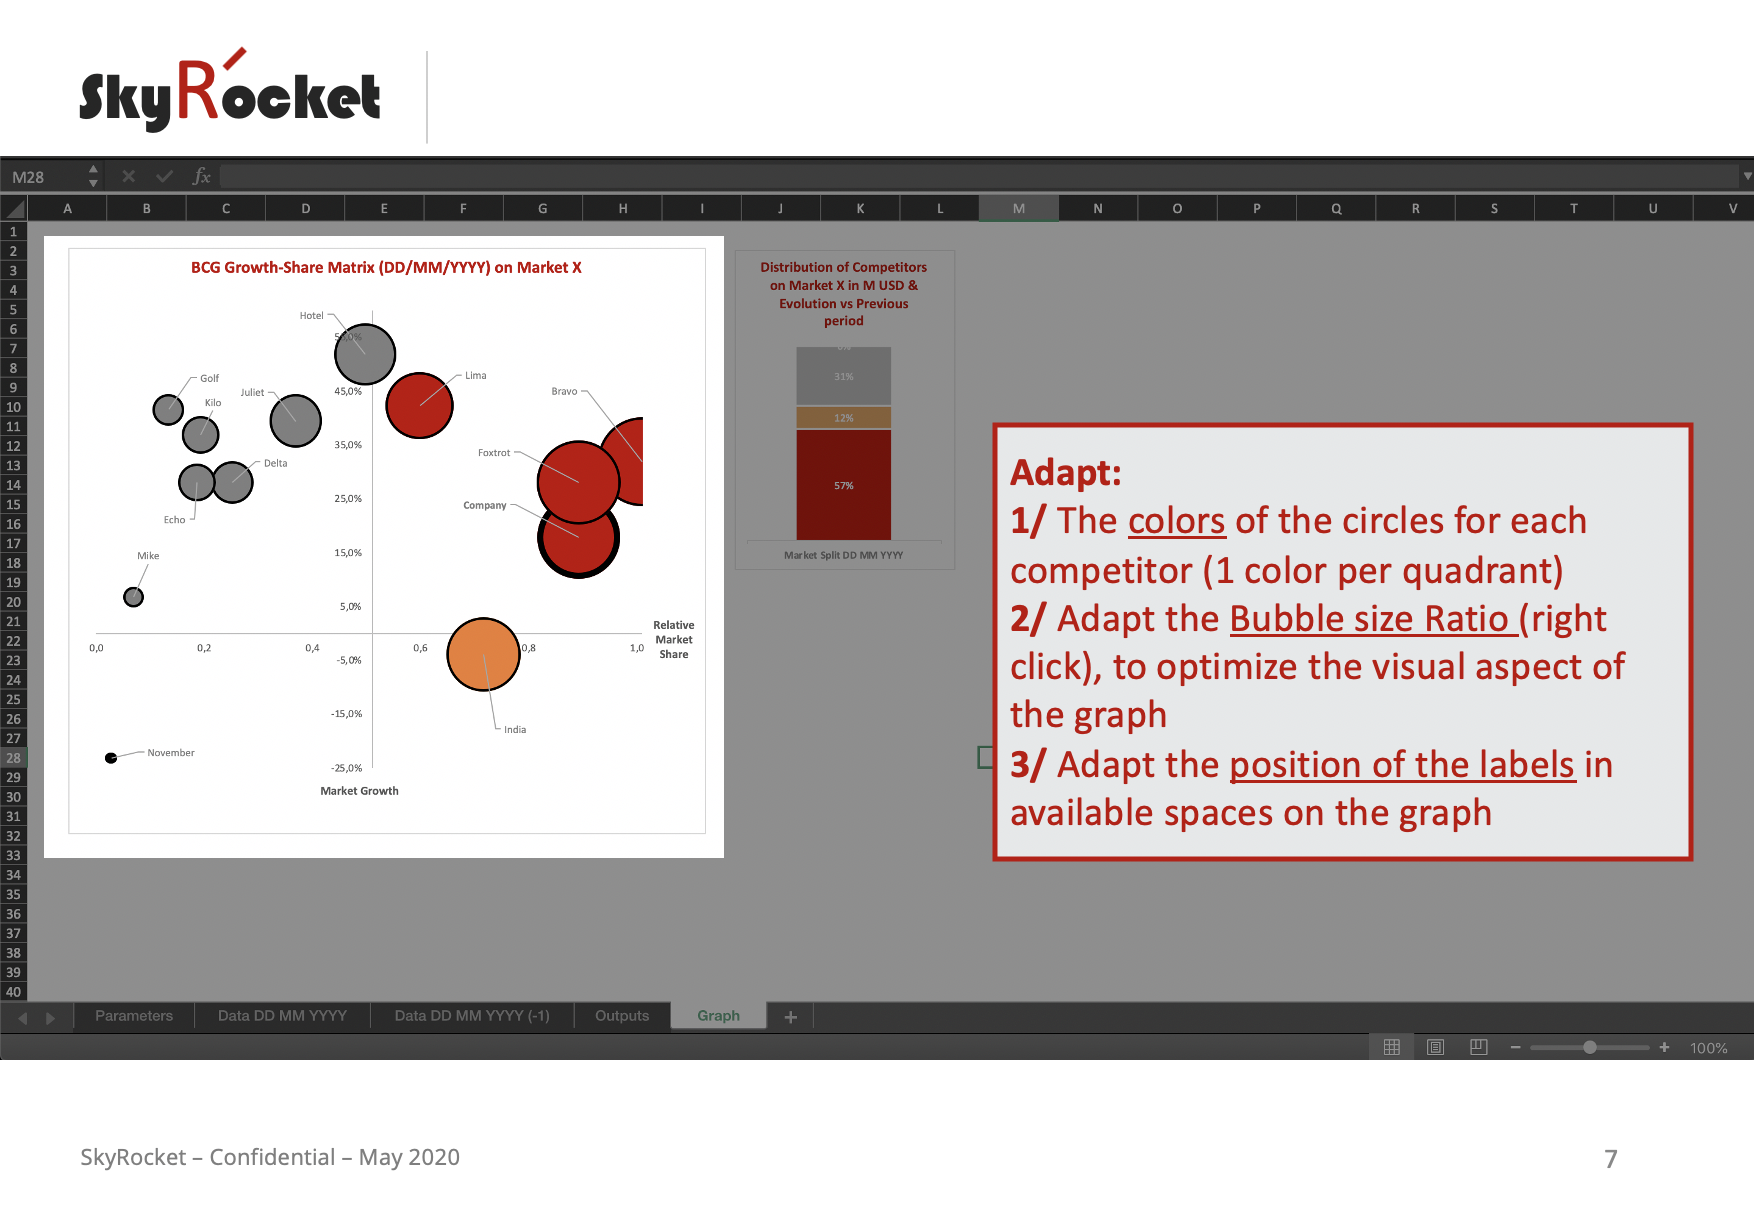
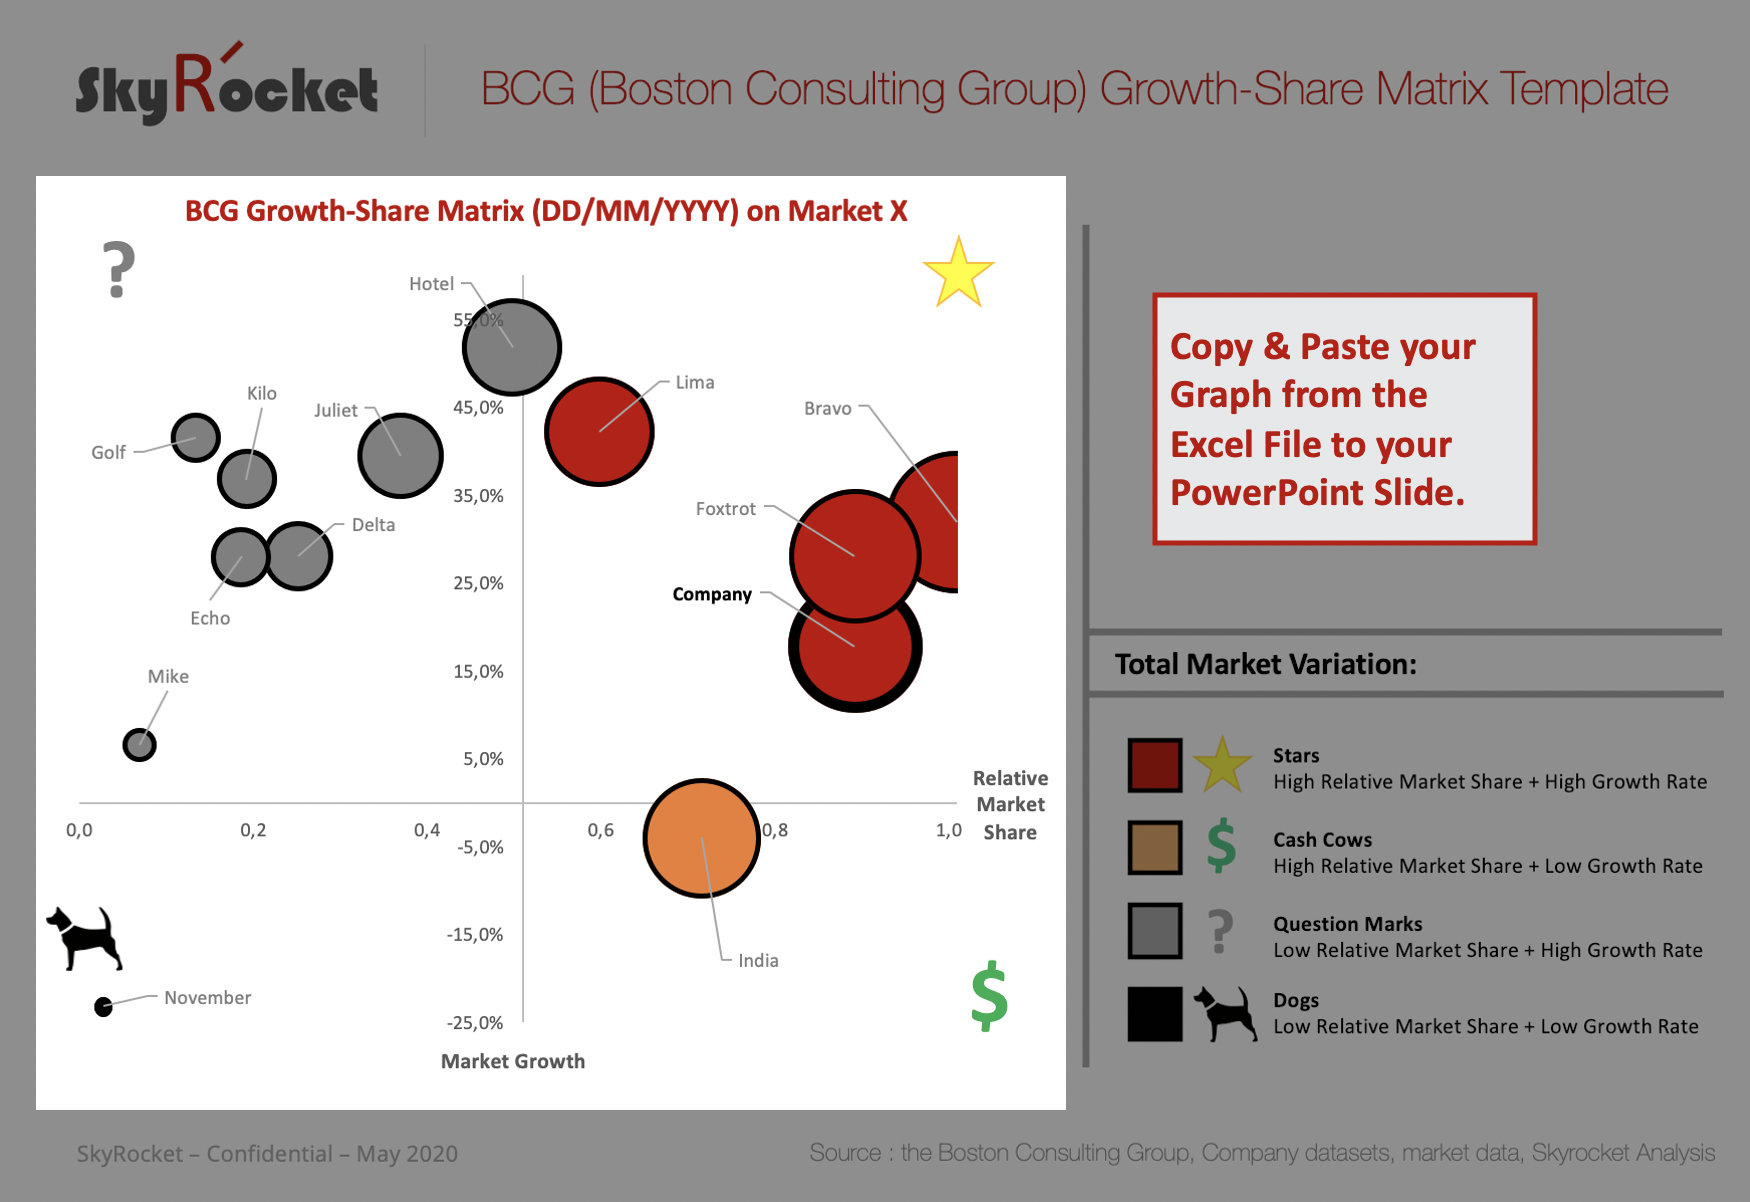
Actors/Competitors Market Mapping - with the BCG (Boston Consulting Group) Growth-Share Matrix - PowerPoint Template
Originally published: 25/05/2020 10:26
Last version published: 08/02/2024 12:45
Publication number: ELQ-41120-32
View all versions & Certificate
certified

Actors/Competitors Market Mapping - with the BCG (Boston Consulting Group) Growth-Share Matrix - PowerPoint Template

A simple BCG (Boston Consulting Group) Growth-Share Matrix Template in Microsoft PowerPoint and Excel.

Description
SPECIAL 100% DISCOUNT COUPON FOR COVID19 - ENTER "COVID100" AT CHECKOUT

The BCG Matrix, also known as the BCG Growth Share Matrix was created in 1968 by the Boston Consulting Group's founder Bruce Henderson in one of his essays, called "Perspective".

It is a portfolio management framework that helps organizations and companies prioritize their businesses.

It has 2 axis:
- Relative Market Share
- Growth


Leading to 4 quadrants:

- Cash Cows: High Relative Market Share, Low Growth
- Stars: High Relative Market Share, High Growth
- Question Marks: Low Relative Market Share, High Growth
- Dogs: Low Relative Market Share, Low Growth

This template has adapted the BCG Matrix to Market Analysis by positioning competitors compared to each other depending on their relative market share (Competitor Market Share/Top Competitor Market Share), and their growth rate compared to the previous period of analysis.

This Strategy Framework Template will be useful to any business leader or strategy consultant looking to position given actors/competitors on a market/industry, and to categorize them according to their potential.

This slide can be particularly useful during a Strategic Due Diligence when analyzing the Market of the Target Company OR when building a shortlist of target companies in M&A operations.

It can also be useful for Investment Banking and Private Equity analysts looking to find the best companies in which to invest in a given market by spotting those with high relative market shares and a high growth compared to the previous period of analysis. I.e: Stars.

HBR (The Harvard Business Review), has listed the Matrix as one of the top 20 charts that have changed the world.

The Best Practice is:
- an editable Microsoft PowerPoint Template Slide + Excel File
- with an online & offline 13 step-by-step methodology, with pedagogical illustrations for each step.

Should you have any questions on using this top tier Management/Strategy Consulting Template slide, you're welcome to reach out to me via Private Message.

⭐️ Bundle of 19 Strategy Consulting Frameworks (including this one)
⭐️ Bundle of 11 Market Analysis Strategy Consulting Frameworks(including this one)
⭐️ Bundle of 8 Competitor Analysis Strategy Consulting Frameworks (including this one)
⭐️ Bundle of 17 Four-Quadrant (2x2) Matrix Framework Templates (including this one)
⭐️ Bundle of 23 Commercial Due-Diligence Model Templates(including this one)
⭐️Bundle of 20+ MBB (McKinsey, BCG, Bain) Strategy Consulting Frameworks(including this one)

Good luck!
- Tim

SPECIAL 100% DISCOUNT COUPON FOR COVID19 - ENTER "COVID100" AT CHECKOUT

This Best Practice includes
1 PowerPoint Template Model + 1 Excel Model + 1 Online 13 Step-by-Step Methodology

Acquire business license for $6.00

Add to cart

Add to bookmarks

Discuss


5.0 / 5 (4 votes)

please wait...