
Originally published: 09/01/2019 09:14
Last version published: 15/06/2020 07:32
Publication number: ELQ-93108-3
View all versions & Certificate
Last version published: 15/06/2020 07:32
Publication number: ELQ-93108-3
View all versions & Certificate

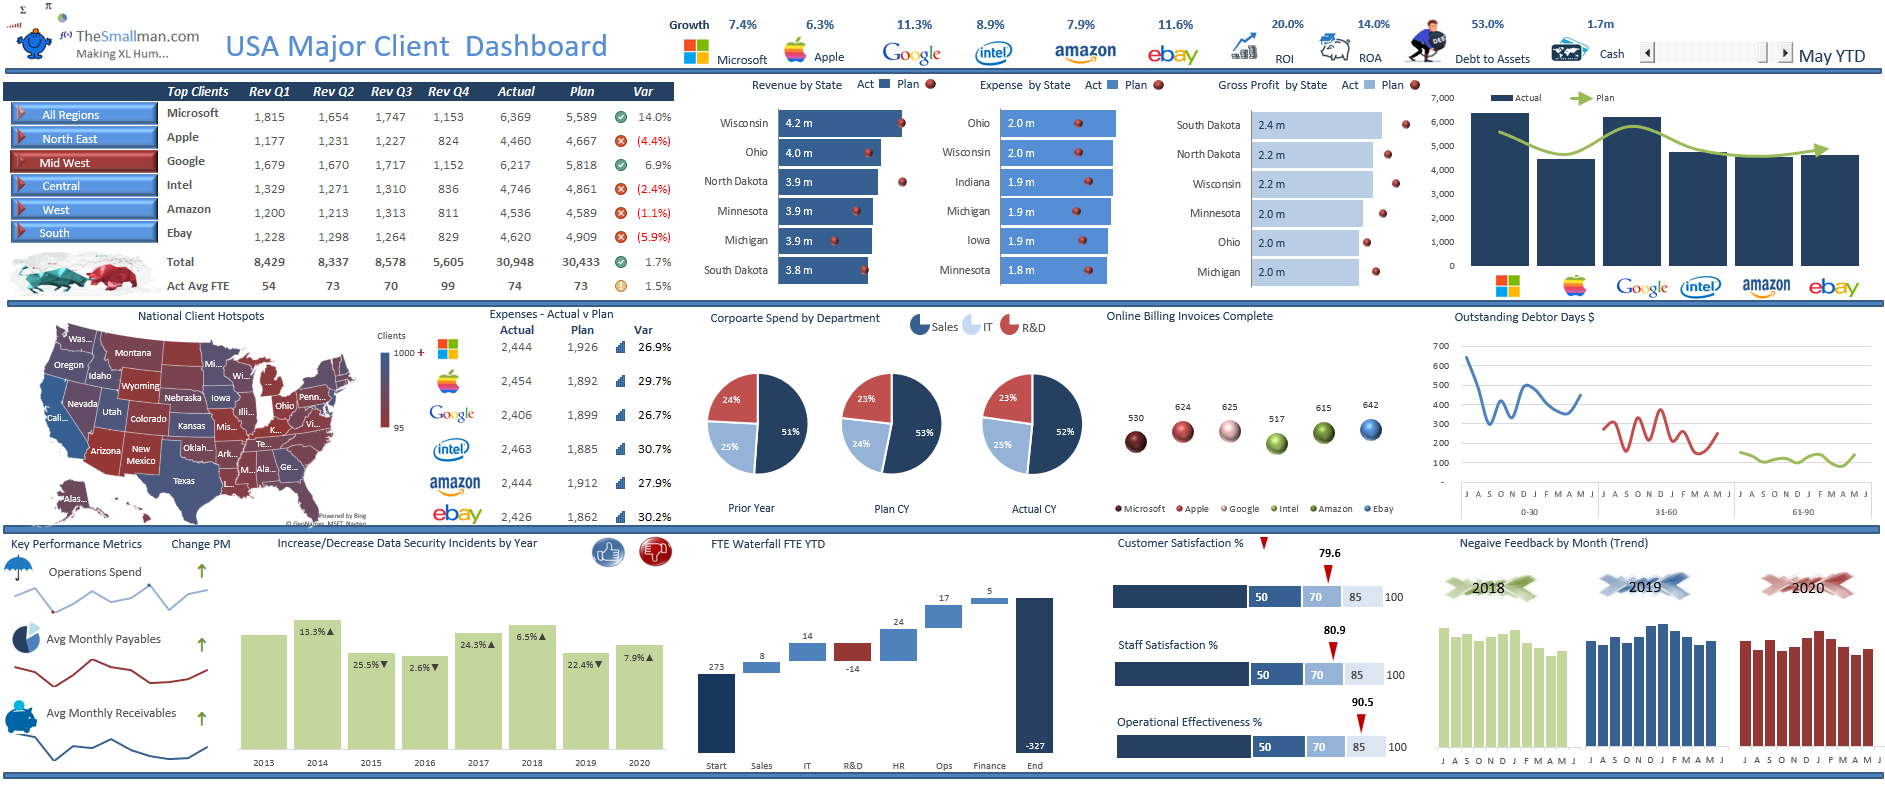
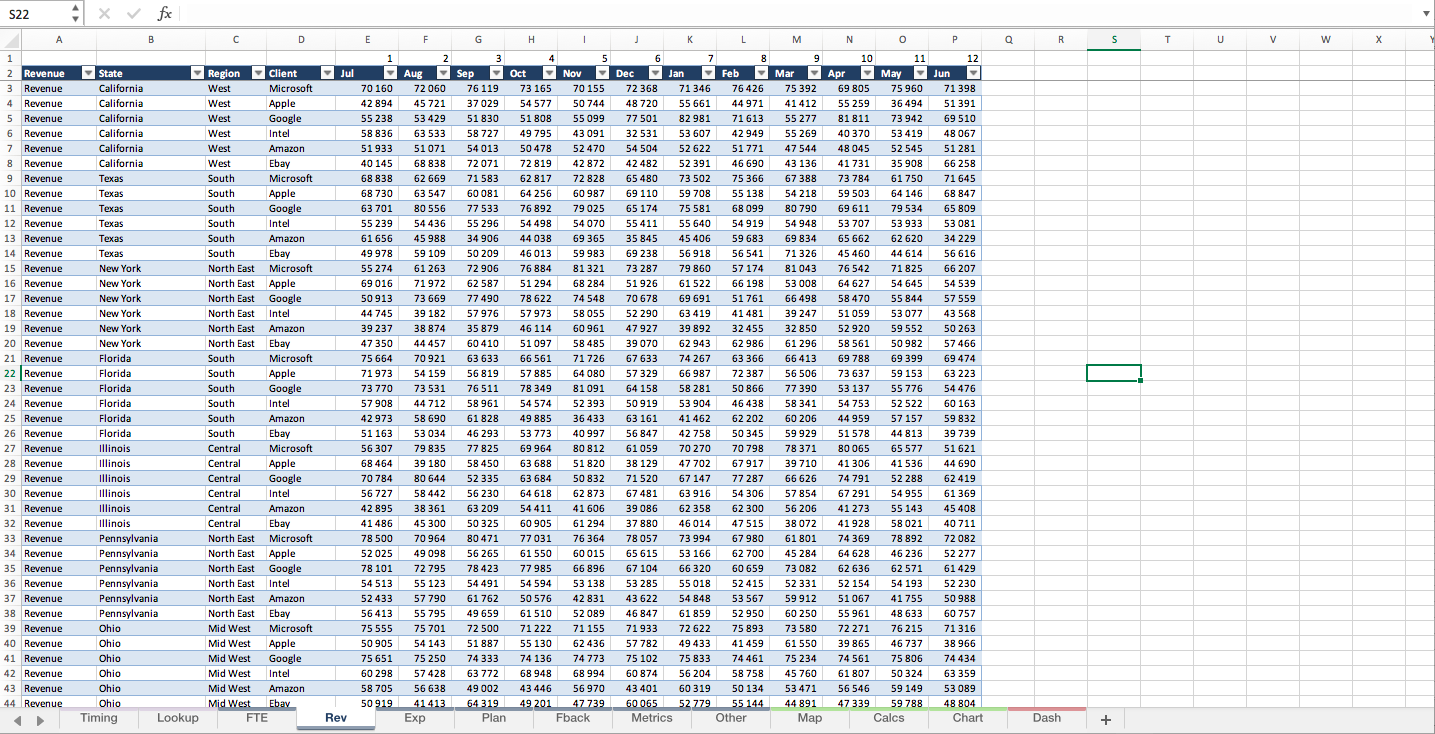
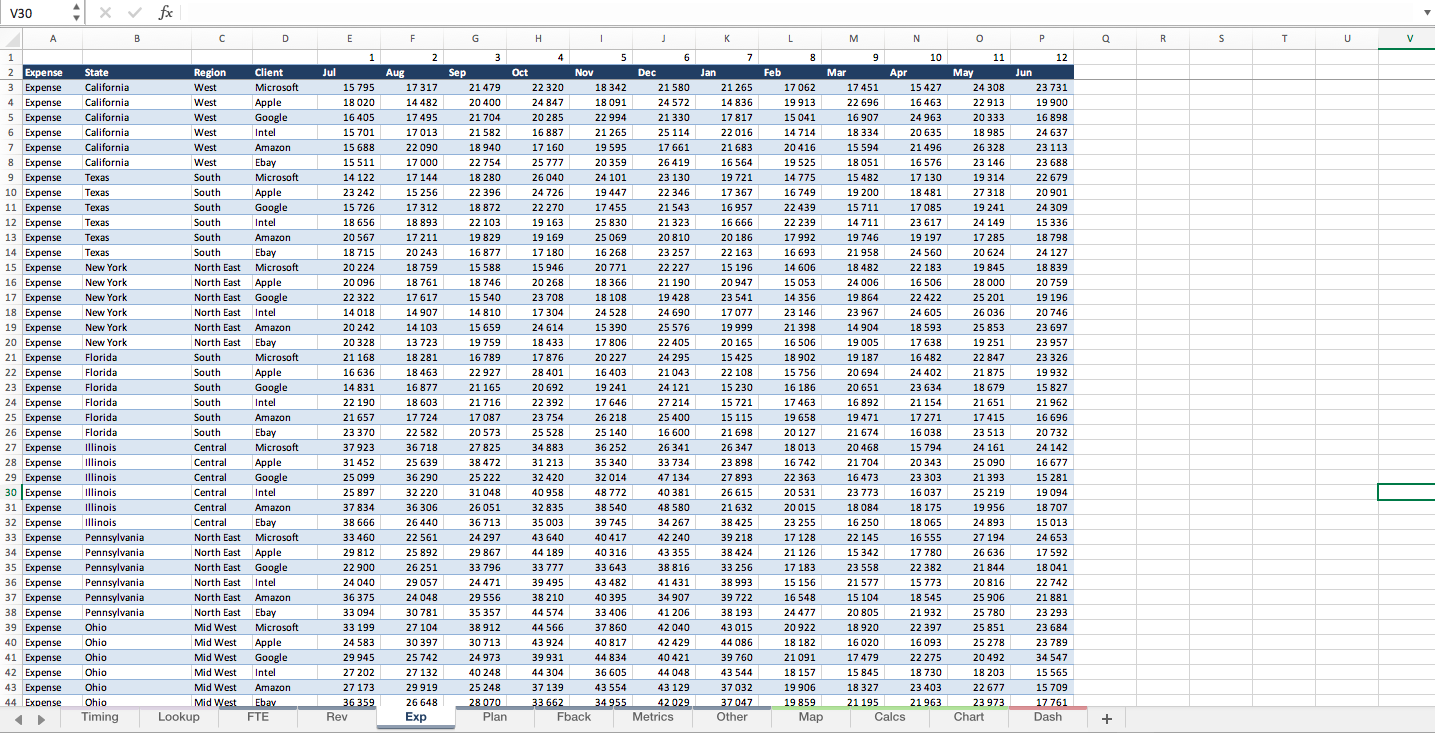
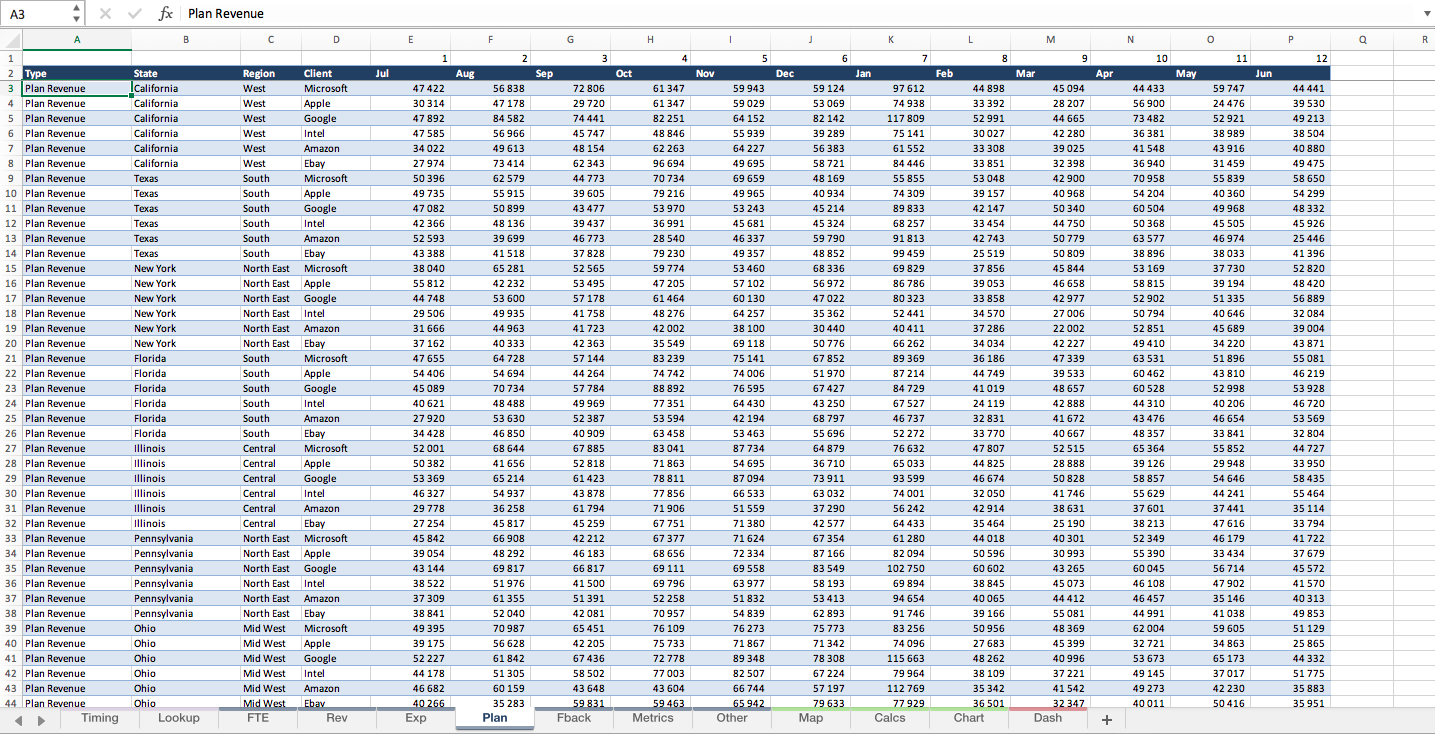
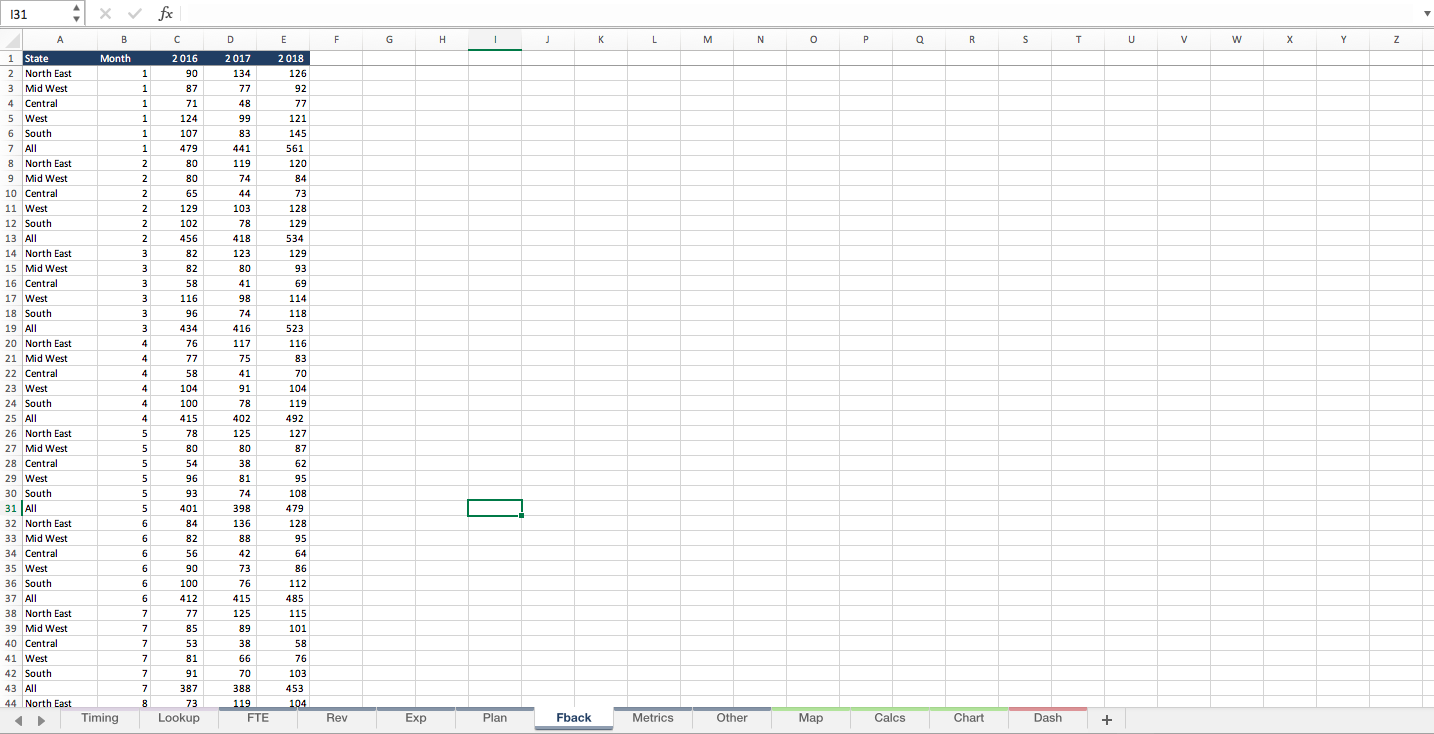
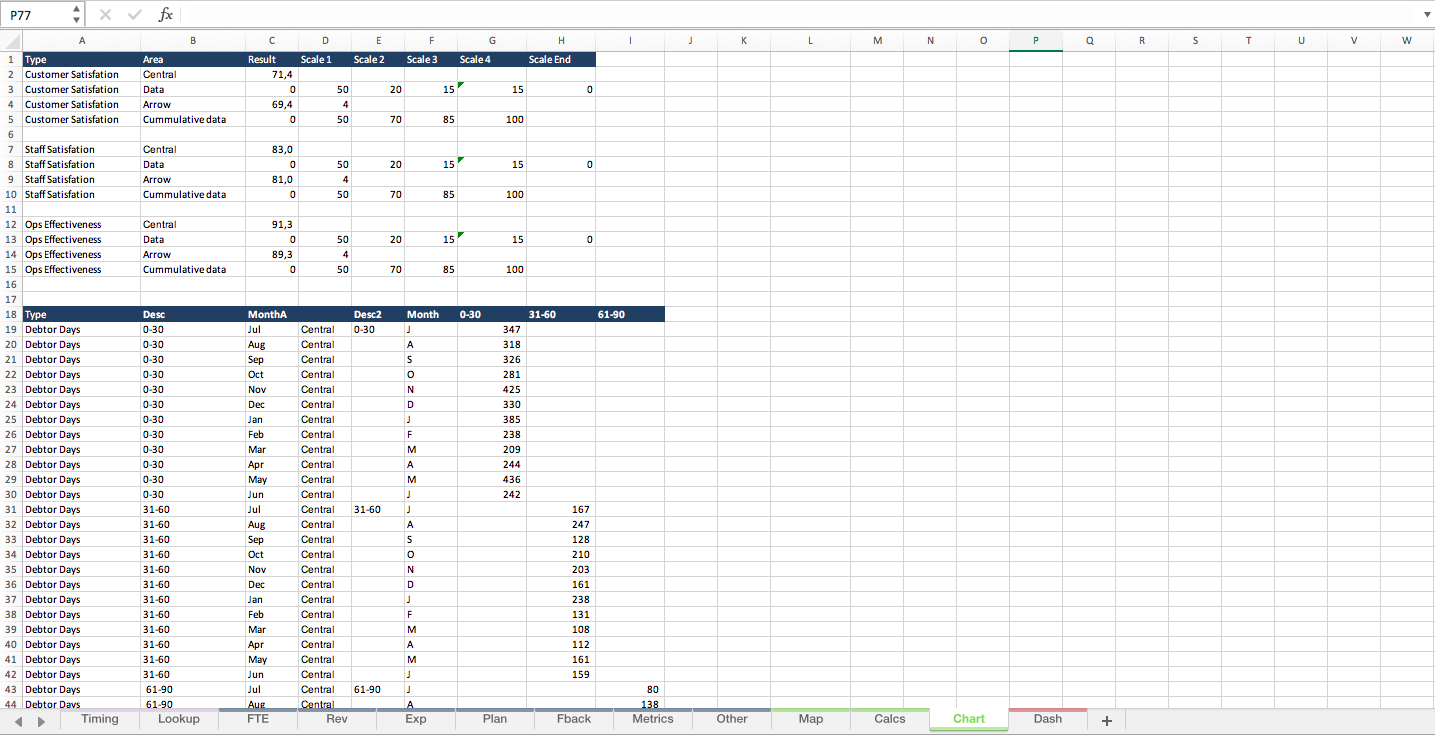
Client Corporate Excel Dashboard
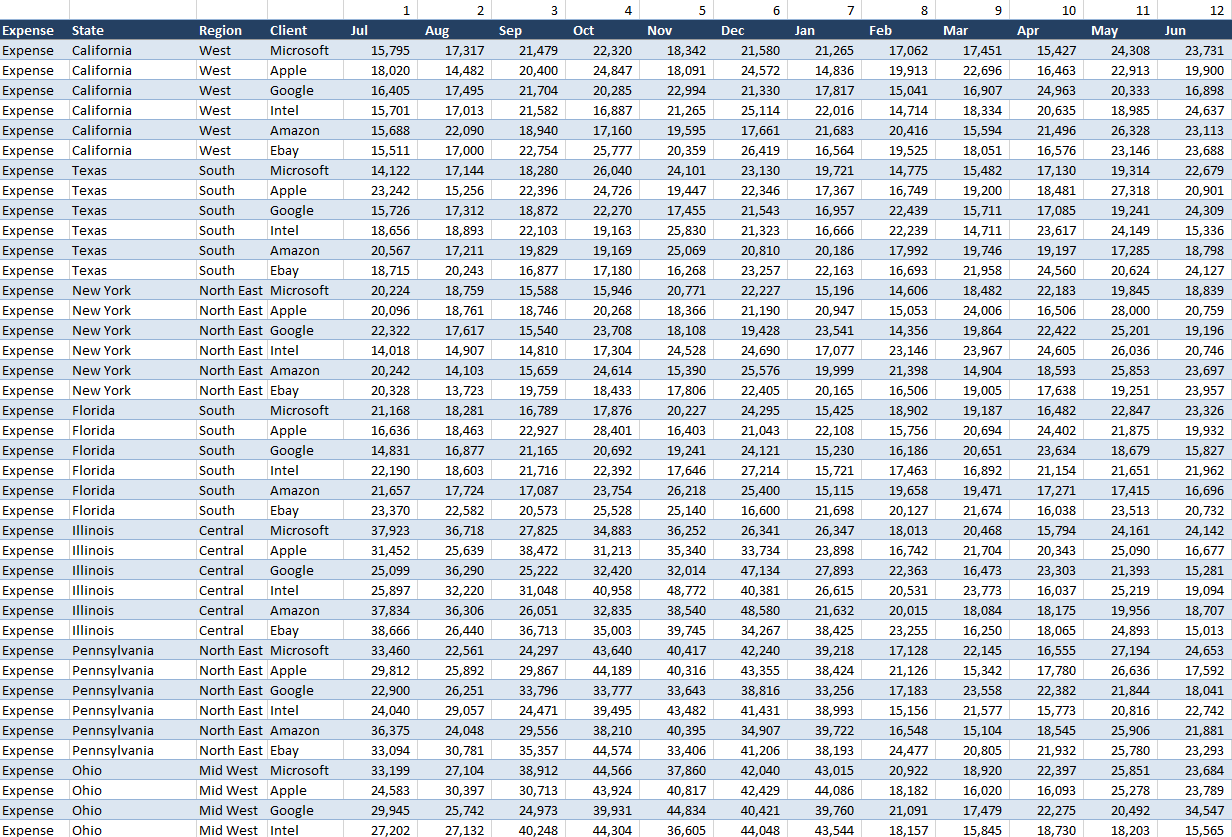
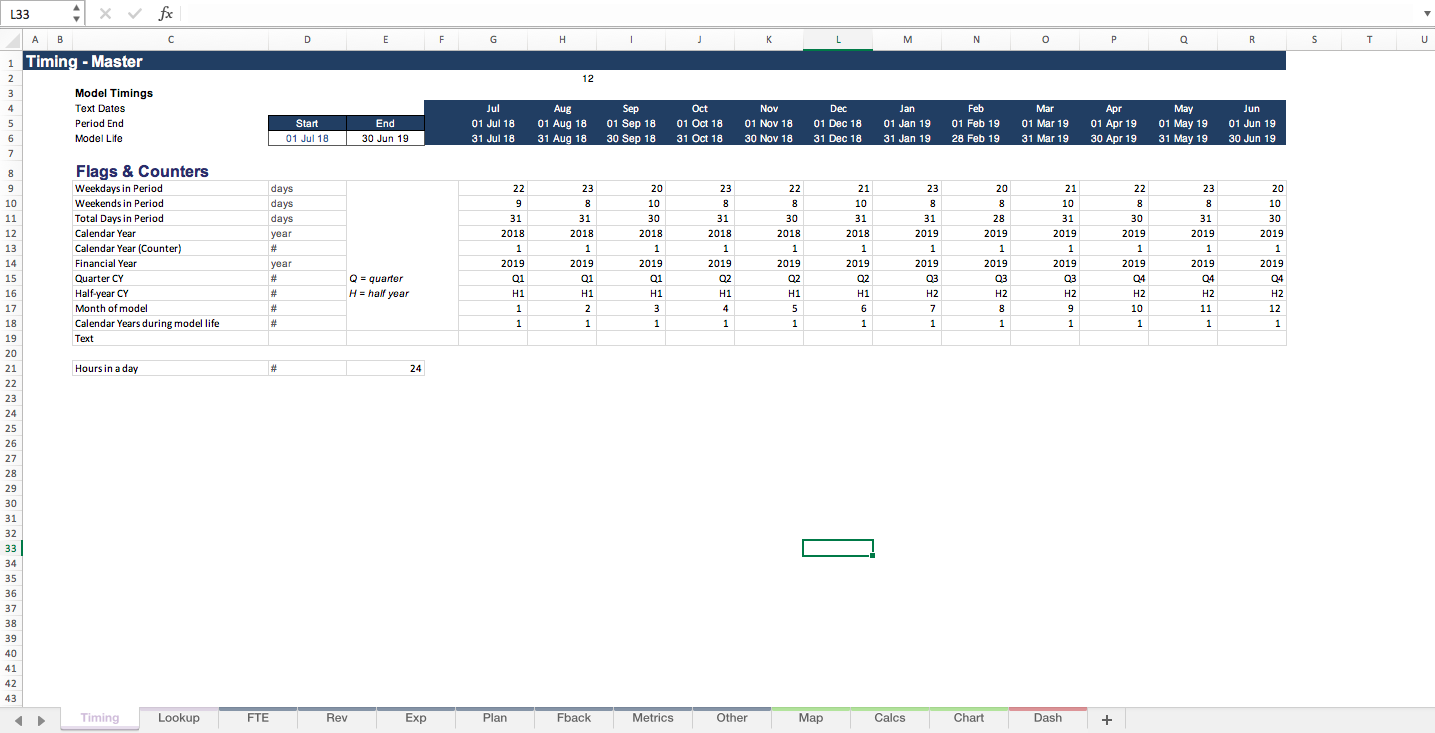
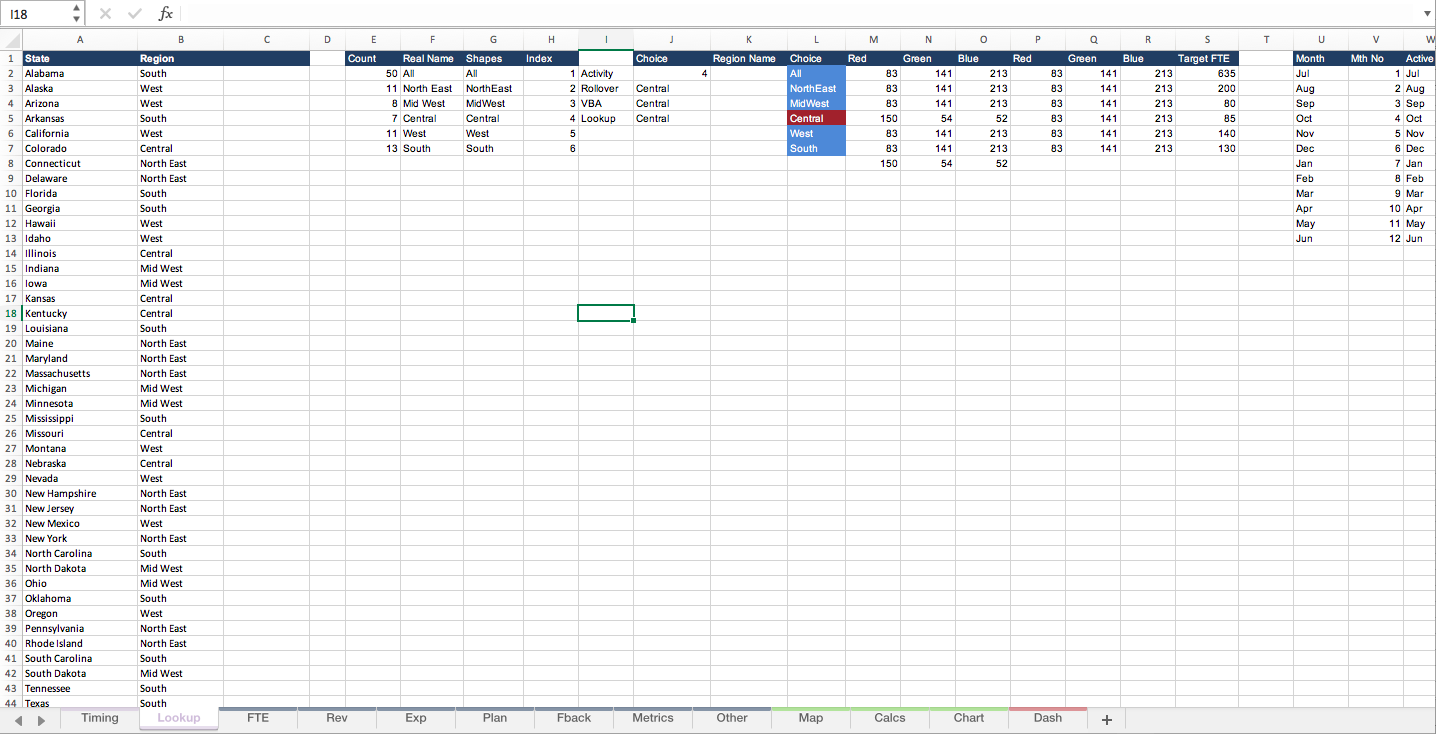
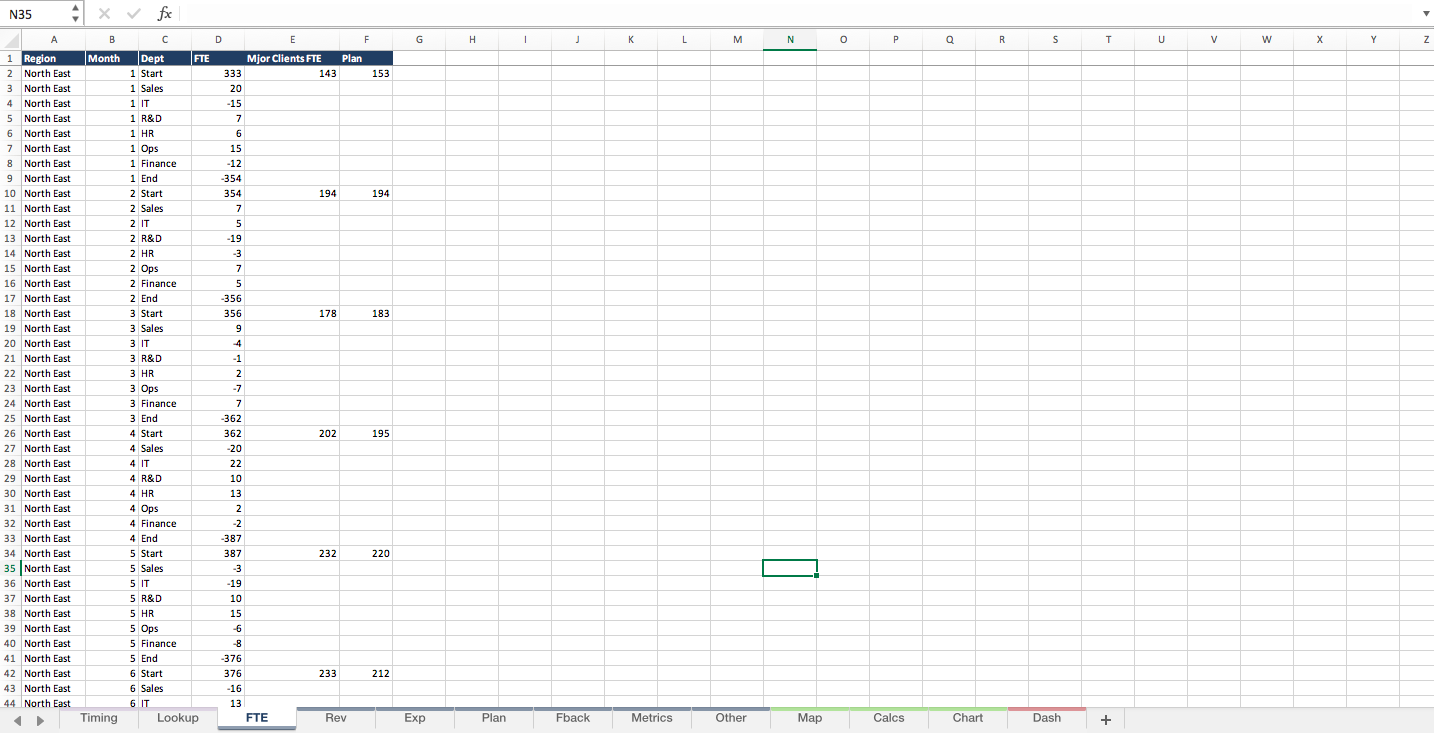
A neat corporate summary report which can be easily adapted to incorporate financial and non financial data.
Further information
To help users generate a succinct one page dashboard with as little add on work as possible.
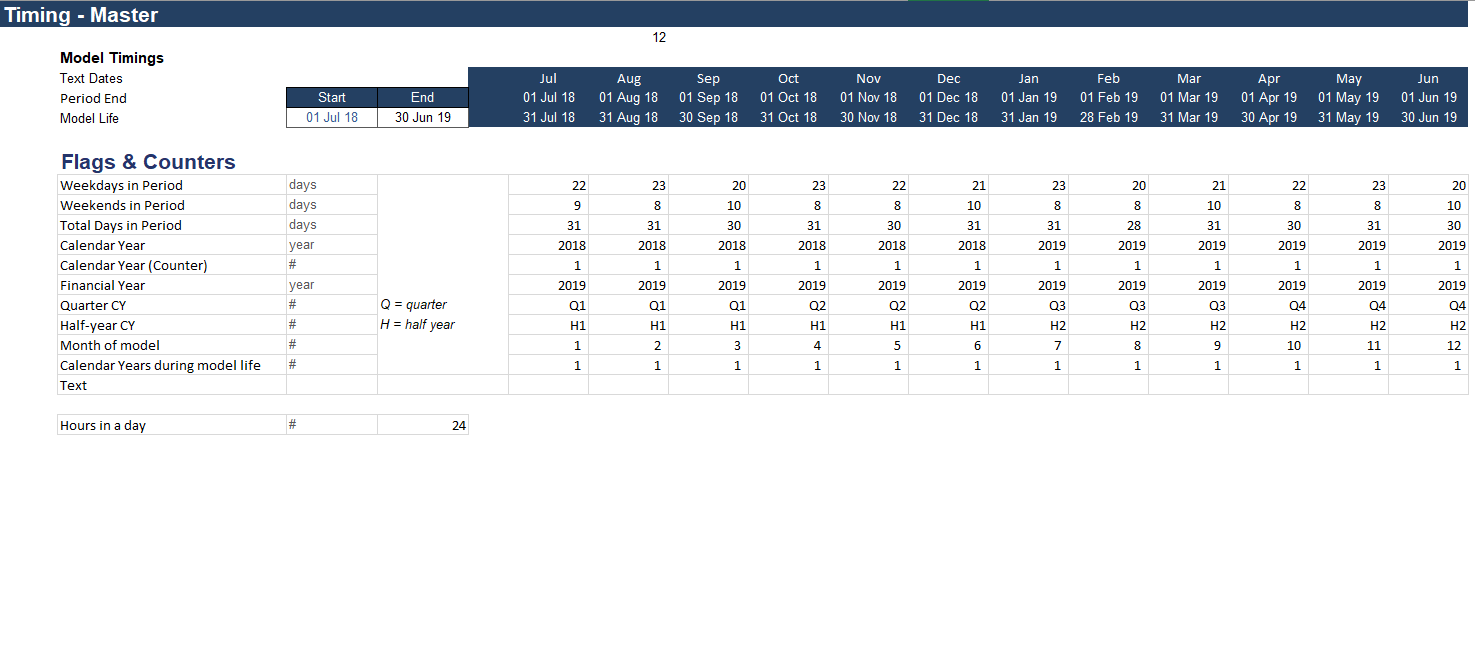
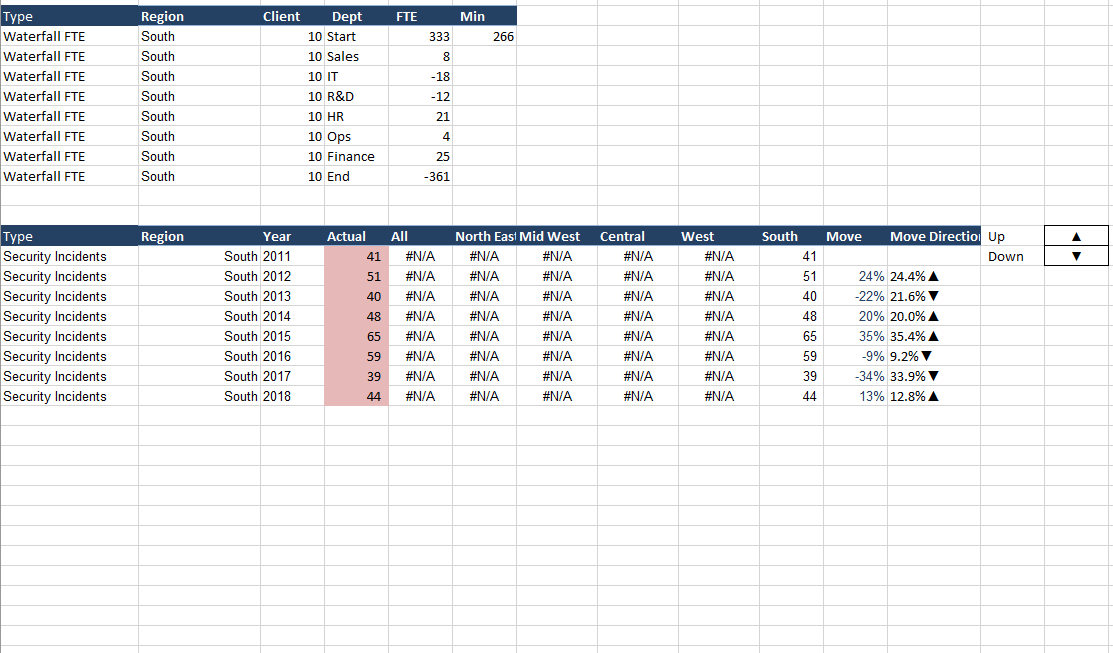
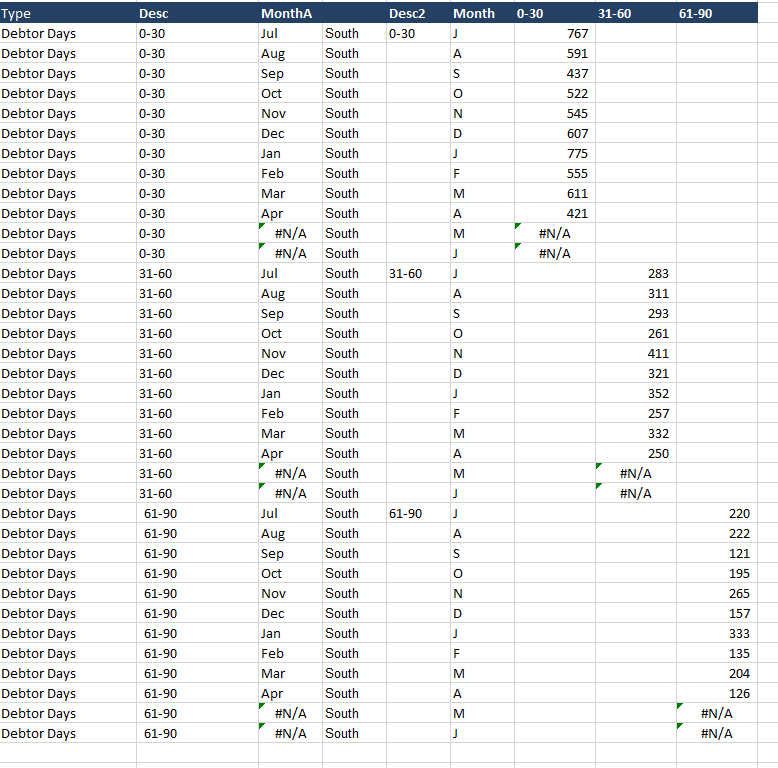
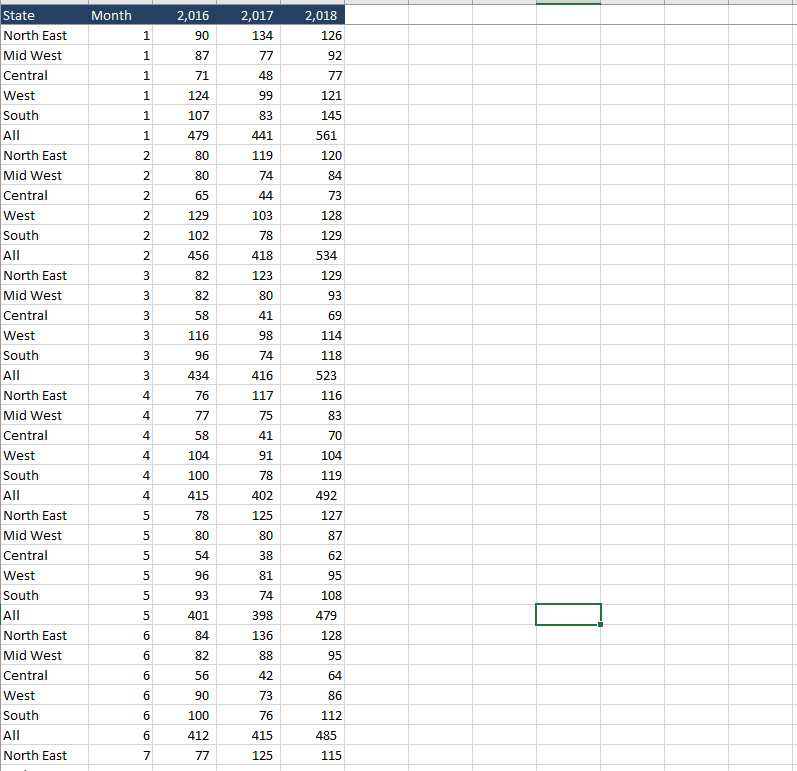
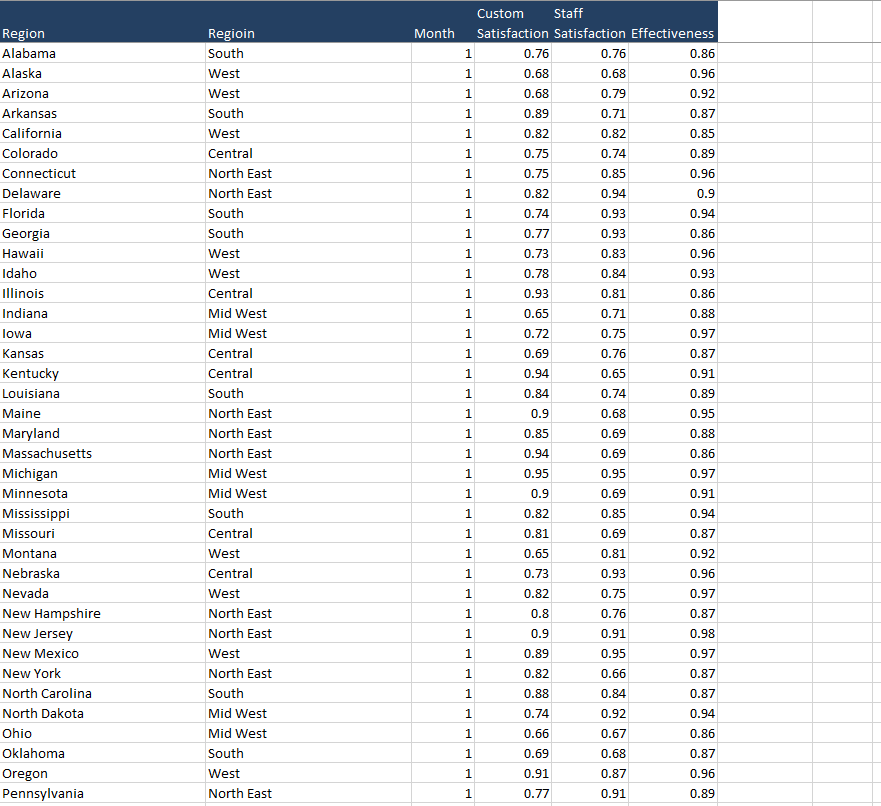
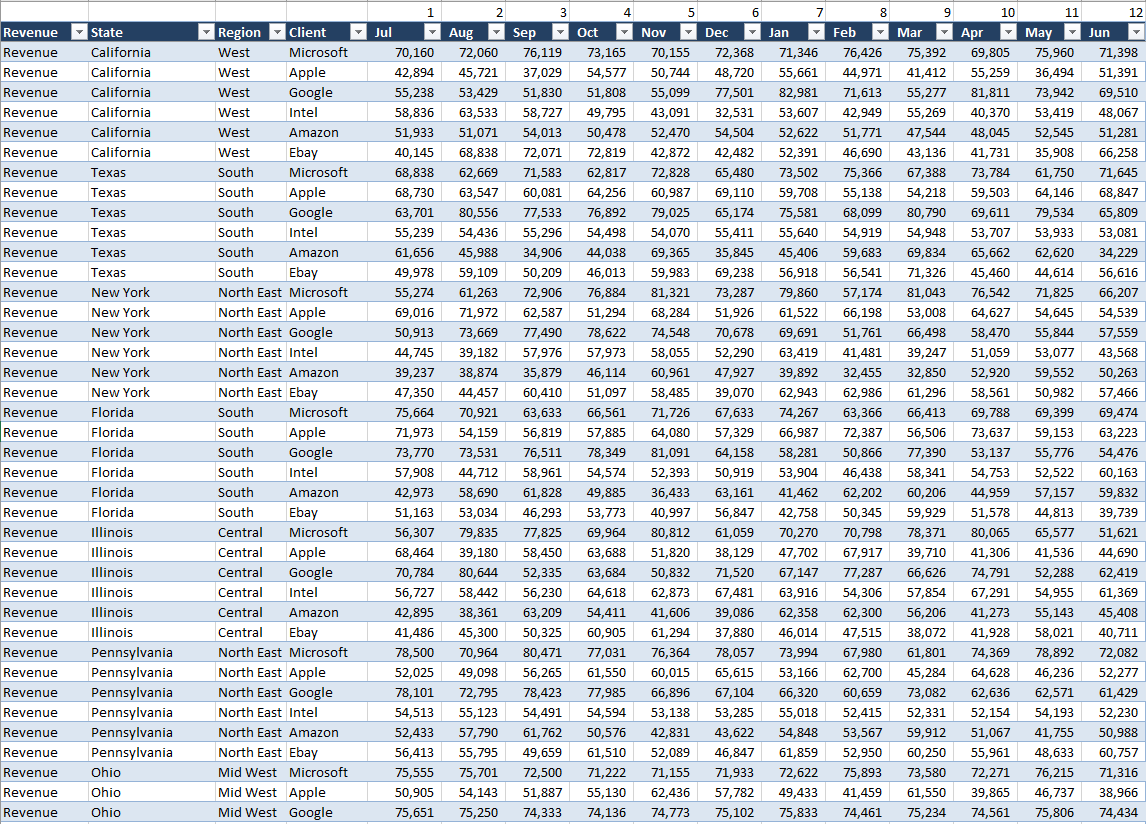
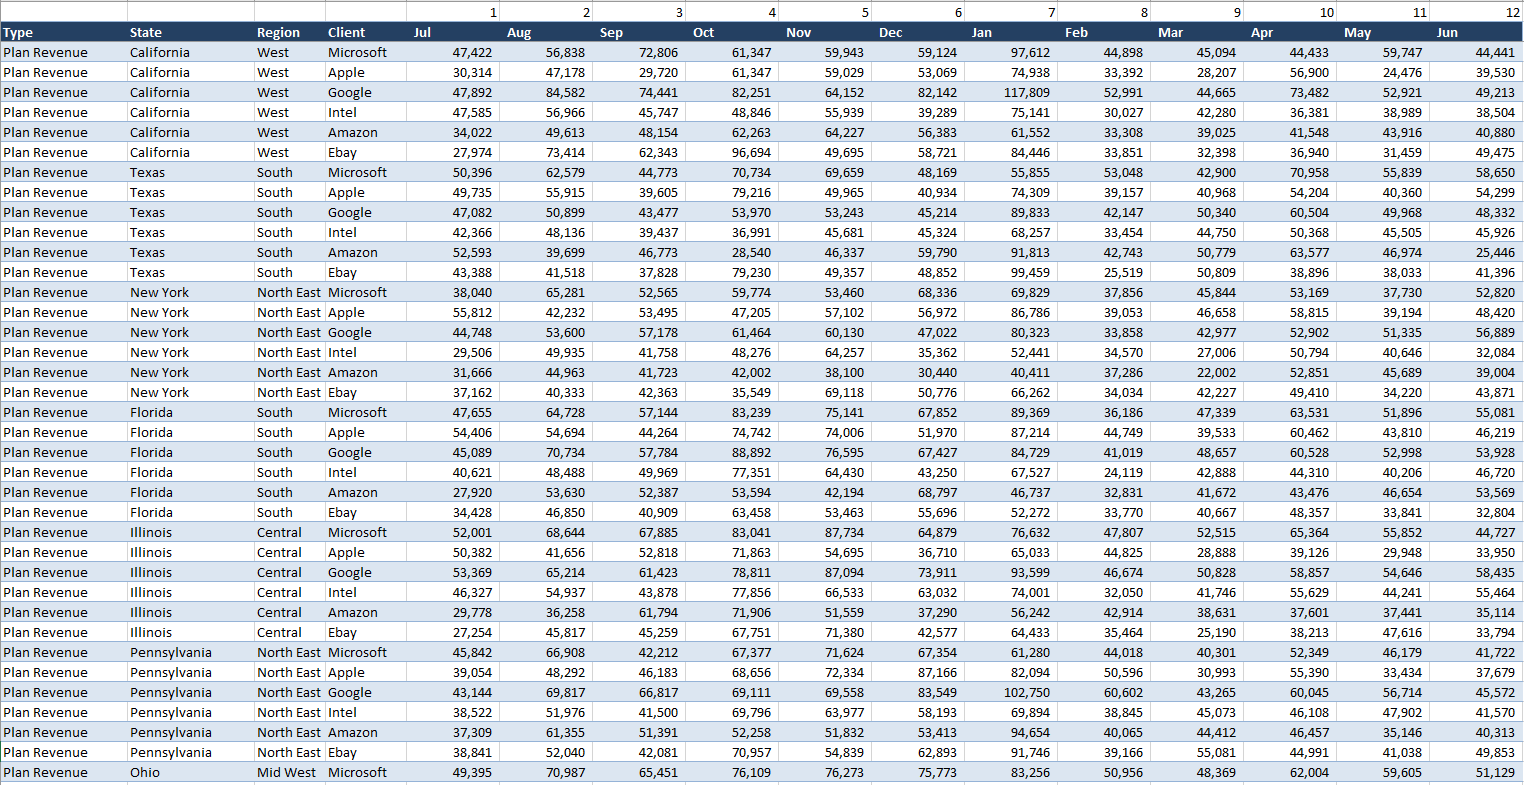
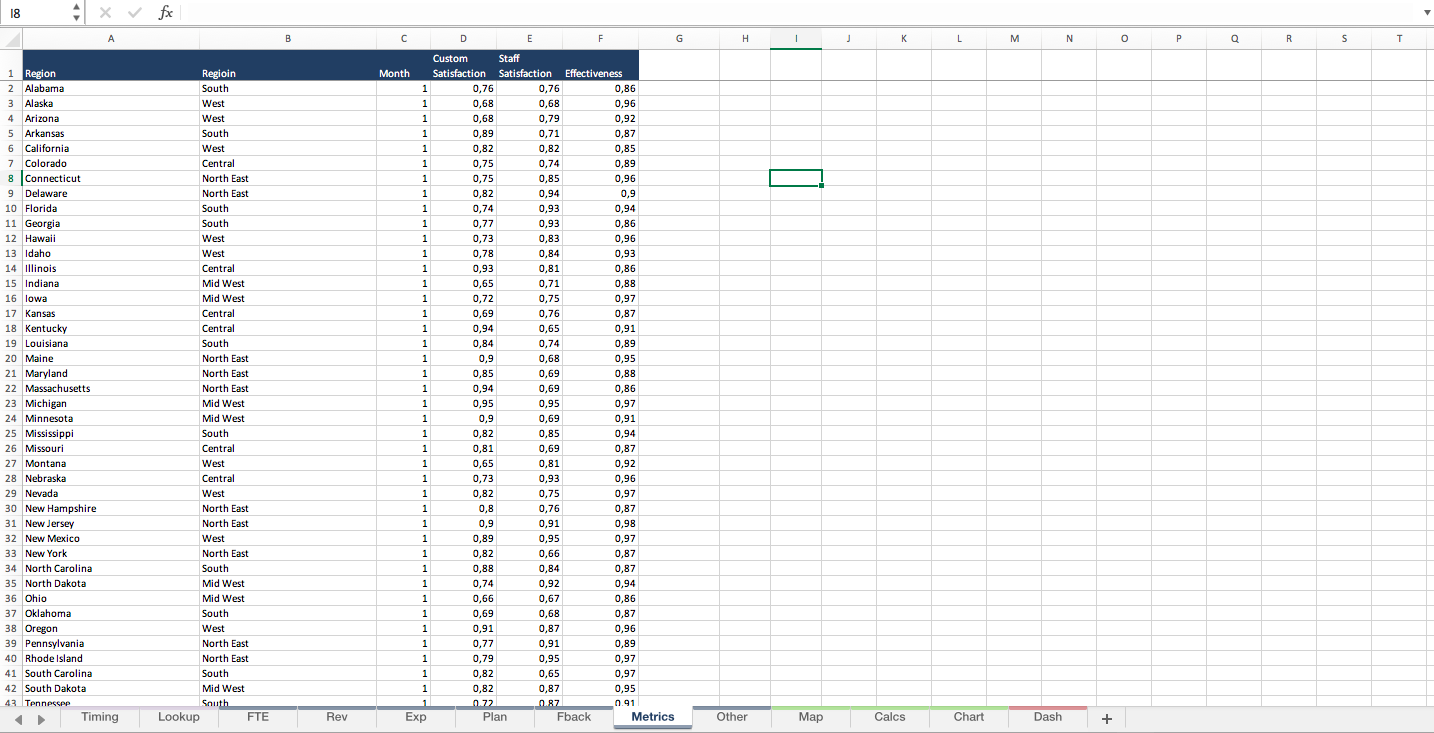
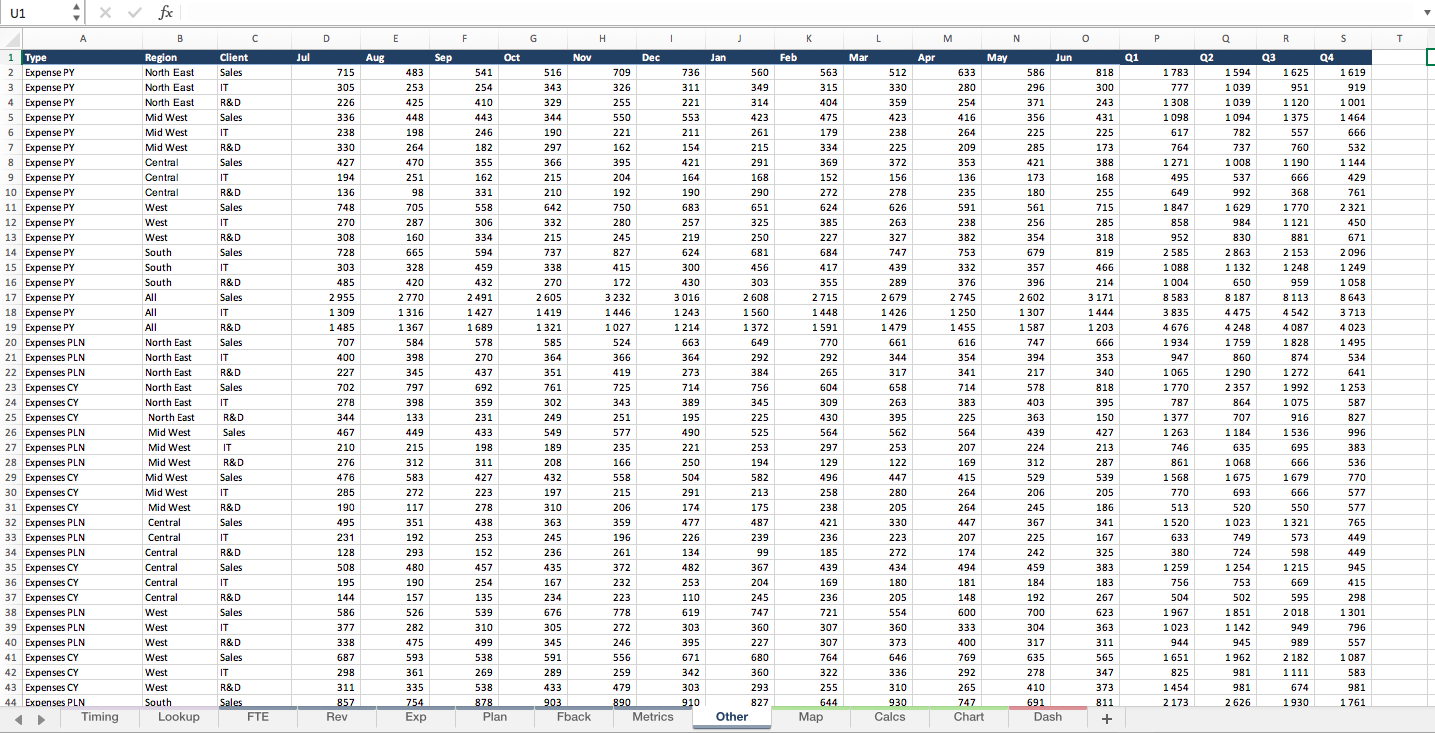
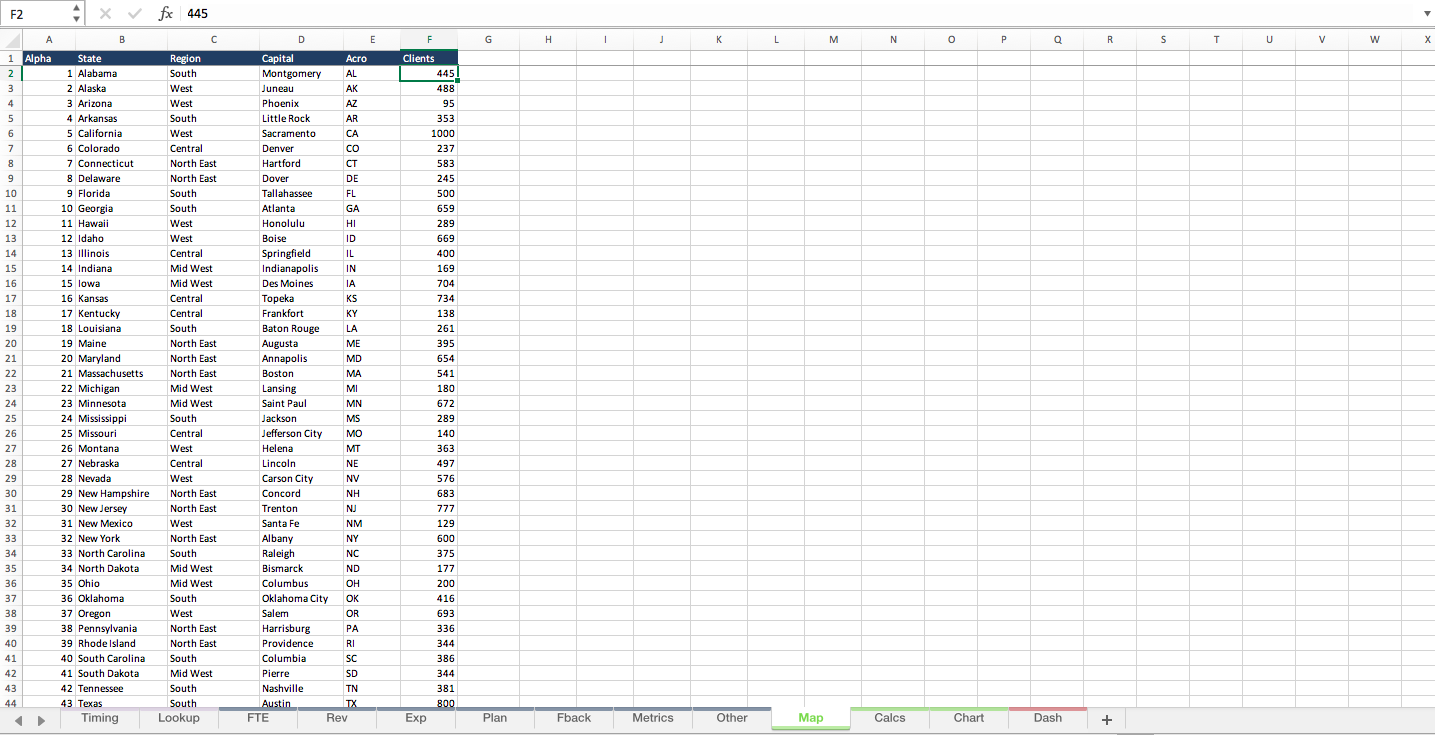
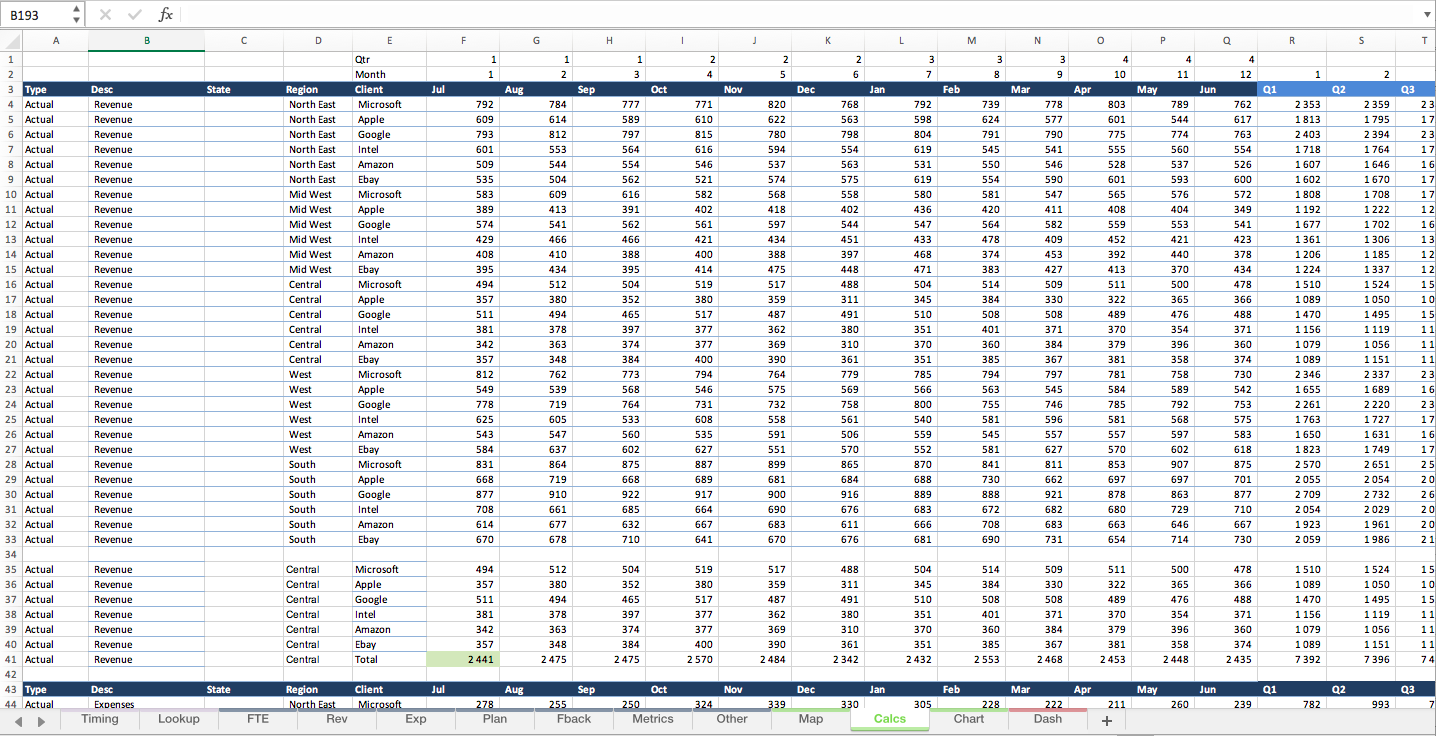
Data display with normalised data feeding the calculations pages. This report would make a great addition to any management reporting suite.
This file is made with Office 365 - some of the features are specific to Excel 365.
