


Originally published: 20/07/2018 10:08
Last version published: 05/05/2020 11:22
Publication number: ELQ-88658-8
View all versions & Certificate
Last version published: 05/05/2020 11:22
Publication number: ELQ-88658-8
View all versions & Certificate

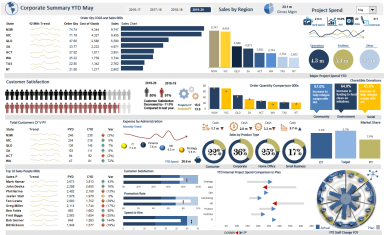
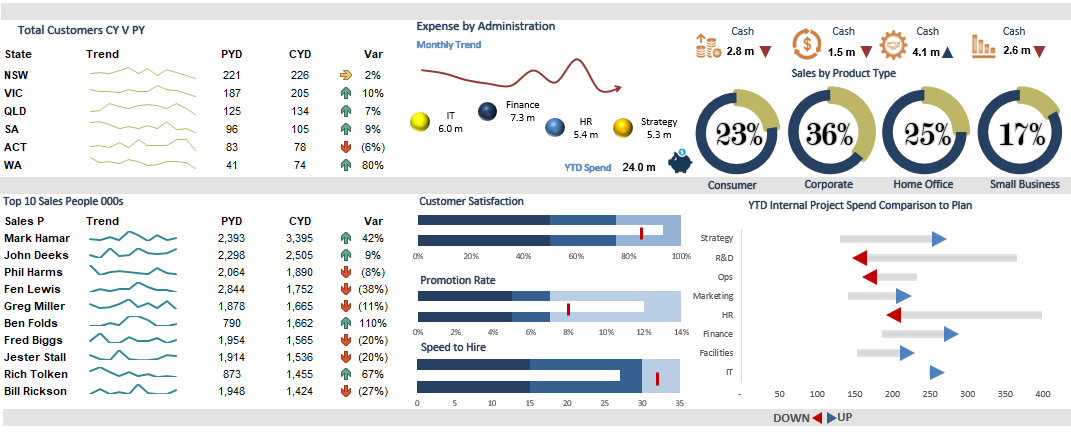
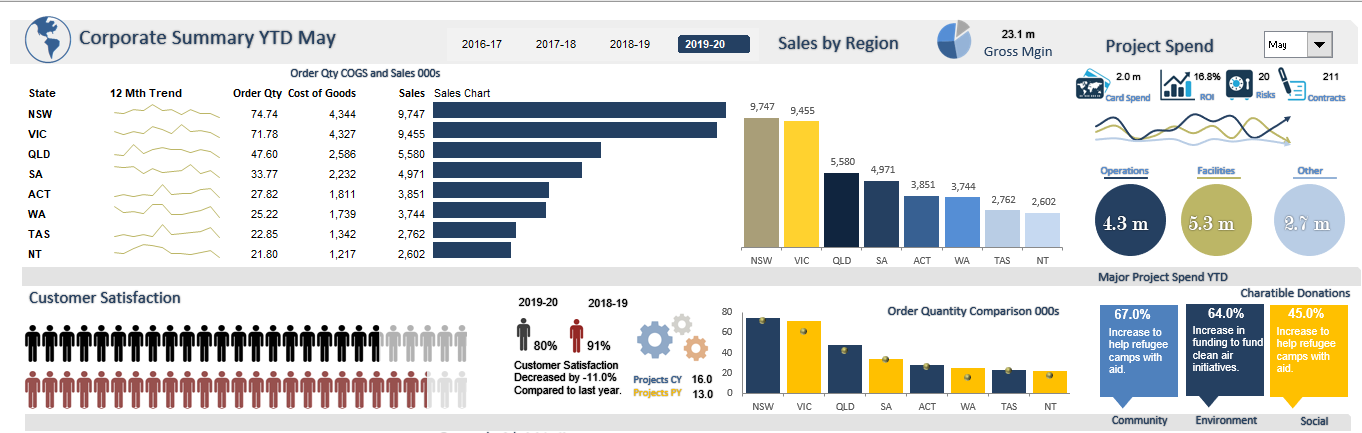
Excel Finance Administration Dashboard
The dashboard displays an incredible range of data in a succinct, clear, pliable easy to update summary.
Further information
To create a highly visual, elegant report which can be updated quickly and easy and spun on a range of financial, operational and administrative metrics.
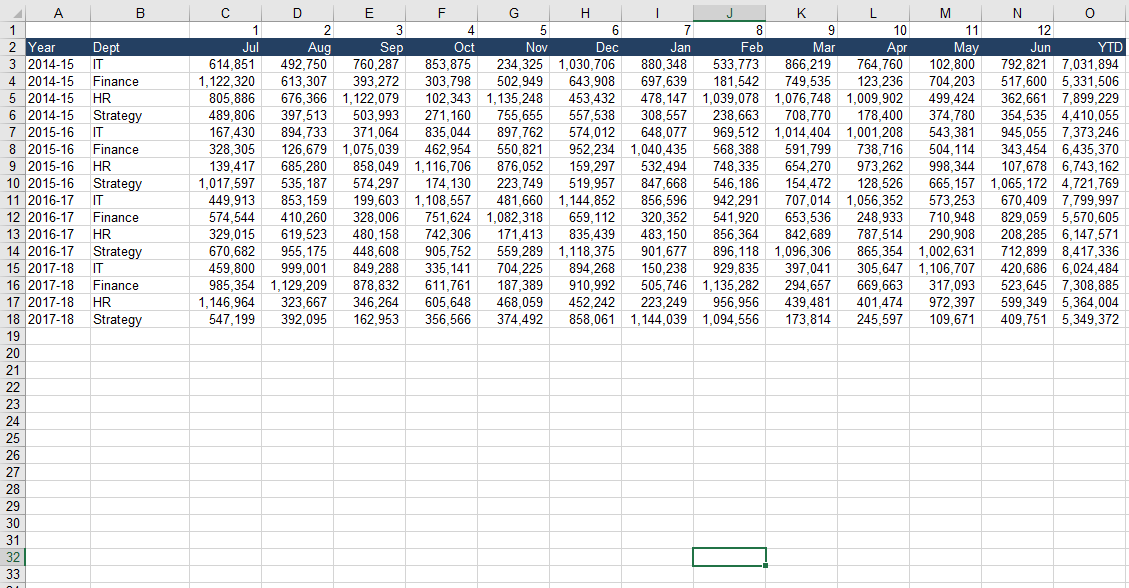
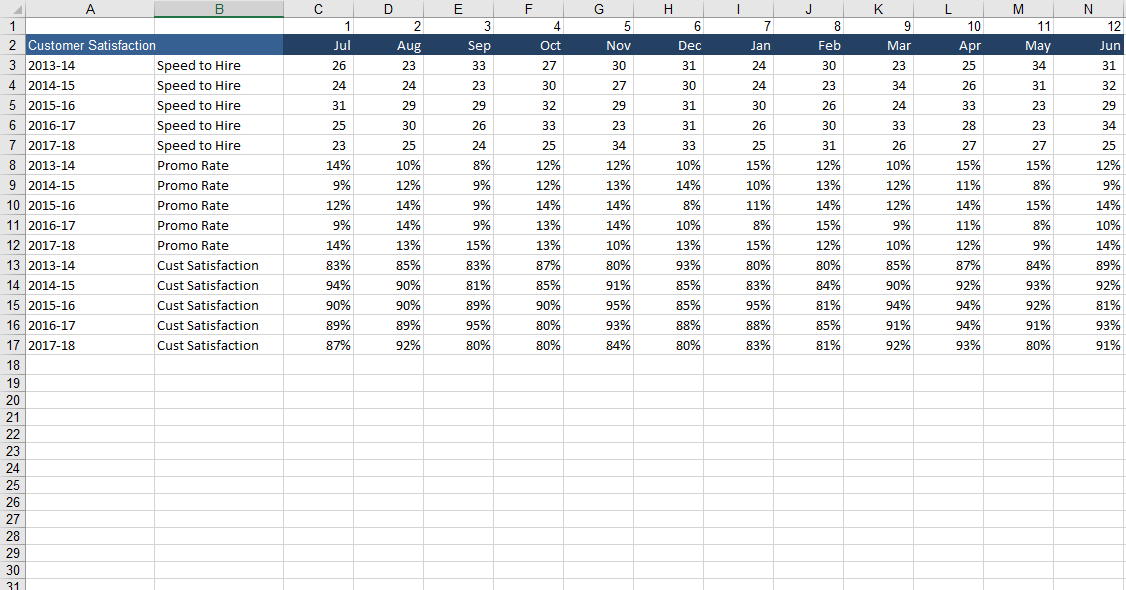
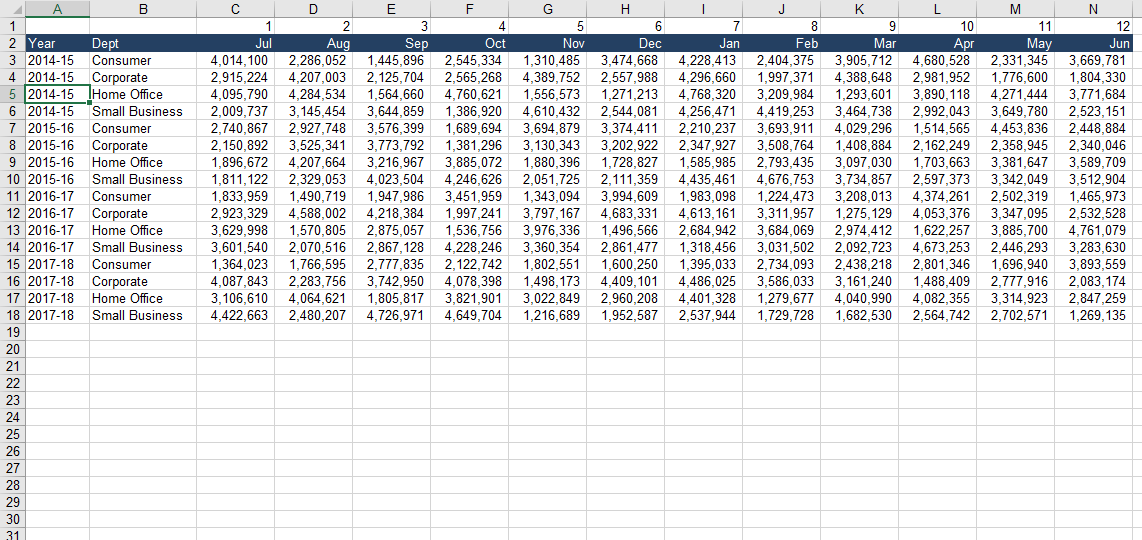
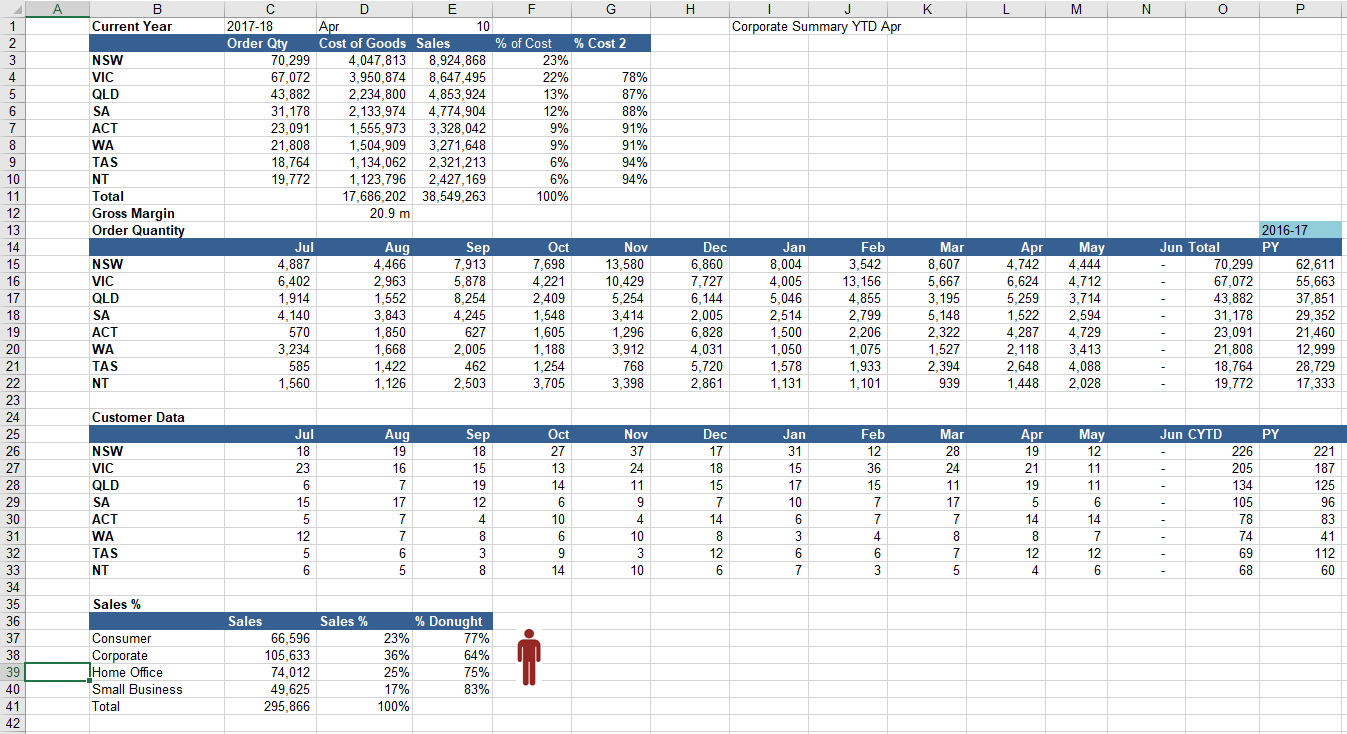
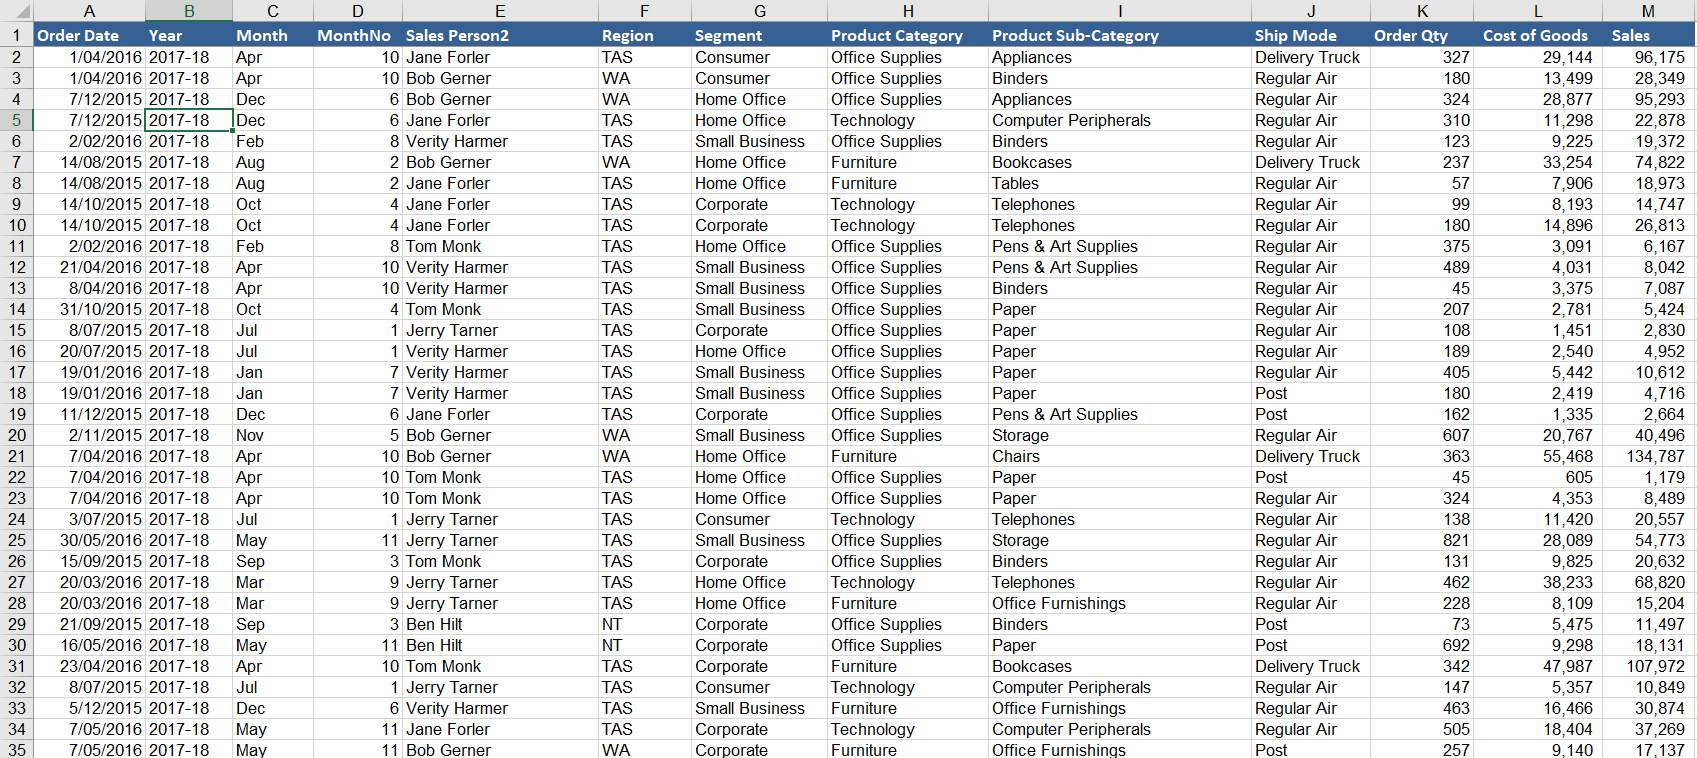
Clean. clear data display with normalised data feeding the calculations page. This report would make a great addition to any board reporting pack.
