

Originally published: 01/06/2020 09:21
Publication number: ELQ-96816-1
View all versions & Certificate
Publication number: ELQ-96816-1
View all versions & Certificate

Single Family Residential Model
The model presents the case where a property is purchased and subsequently rented before being sold.
real estateexcel modelfinancial modelsingle family propertyinternal rate of returnnet present valuecash on cashfree cash flowsnet operating incomenoi
Description
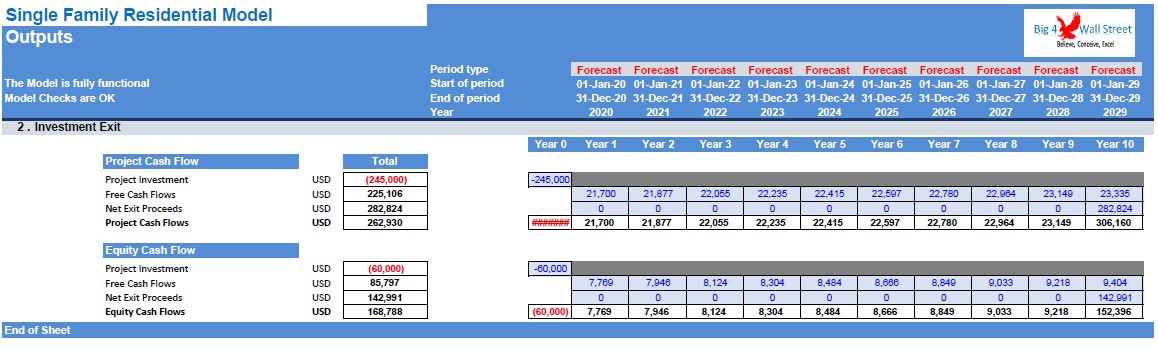
Single Family Residential Model presents the case where a property is purchased and subsequently rented for several years before the property being sold. The model generates cash flows an a project and equity basis and also calculates the relevant metrics (cash on cash, Internal Rate of Return, net present value, loan to value, debt yield, coverage ratio and DSCR). The financing options for the project include equity funding from investors and an amortizing loan.
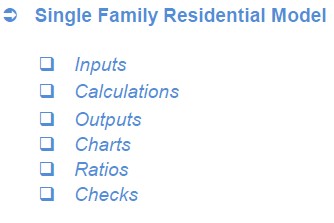
So, a quick overview of the model, in the contents tab you can see the structure of the model and by clicking on any of the headlines to be redirected to the relevant worksheet.
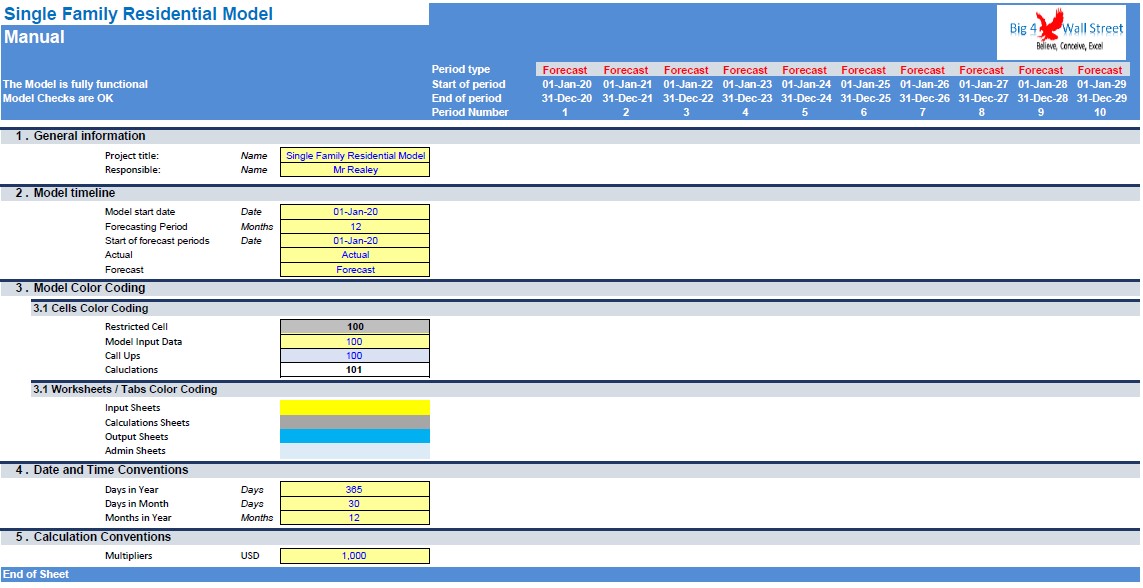
On the manual tab you can feed the general information for the model such as: model name, responsible, timeline of the model and date and currency conventions.
Additionally there is a description of the color coding of the model in the same tab. Inputs are always depicted with a yellow fill and blue letters, call up (that is direct links from other cells) are filled in light blue with blue letters while calculations are depicted with white fill and black characters.
There is also a color coding for the various tabs of the model. Yellow tabs are mostly assumptions tabs, grey tabs are calculations tabs, blue tabs are outputs tabs (that is effectively results or graphs) and finally light blue tabs are admin tabs (for example: the cover page, contents and checks).
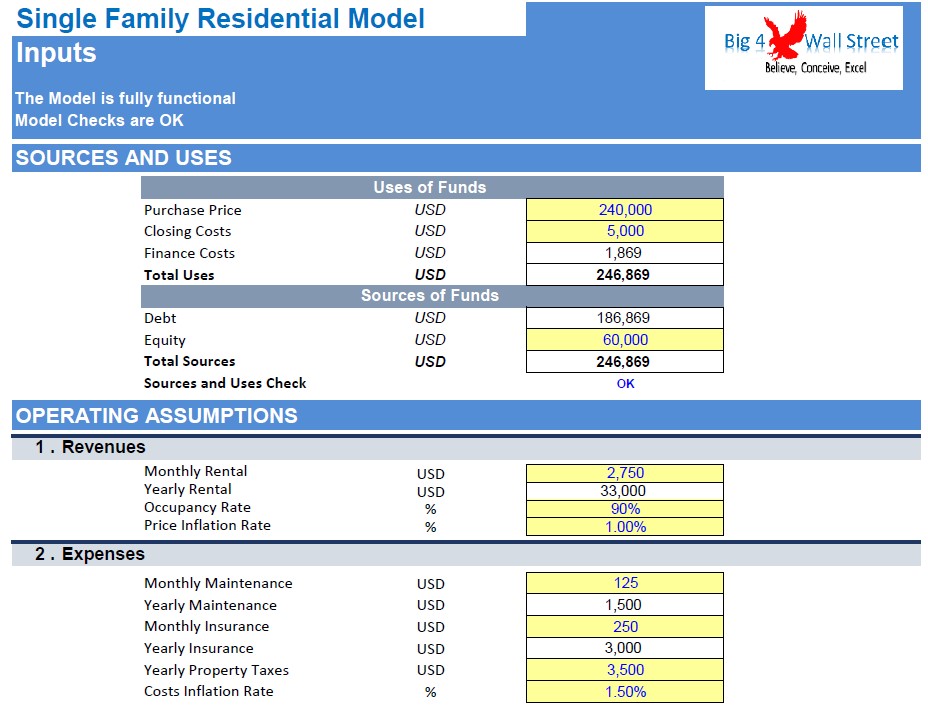
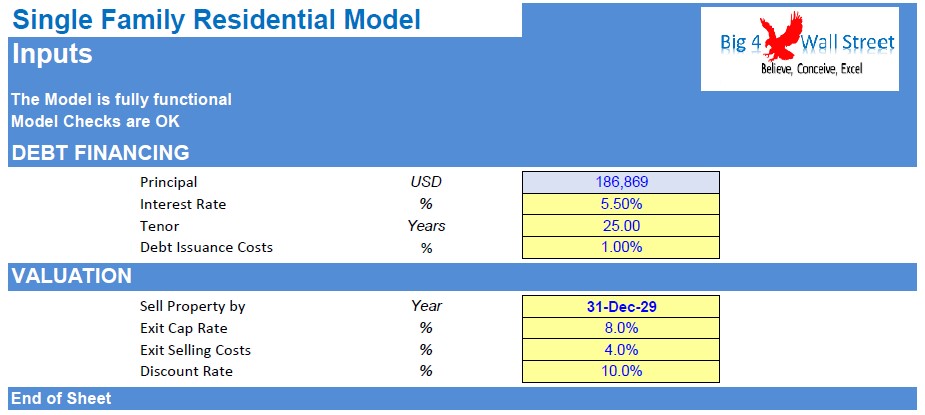
Moving on to the inputs tab, you can adjust the various assumptions of the model based on the specifications and requirements of your business (in yellow whatever can be amended as an assumption). So effectively you can adjust a set of inputs such as purchase price along with closing costs and equity contribution, monthly rental, occupancy, inflation rates, maintenance, and insurance, as well as property taxes. Afterwards you can set debt financing assumptions (interest rates, tenor in years, and debt issuance costs), and valuation assumptions such as the exit year when the property will be sold, the exit cap rate and selling costs, as well as the discount rate used.
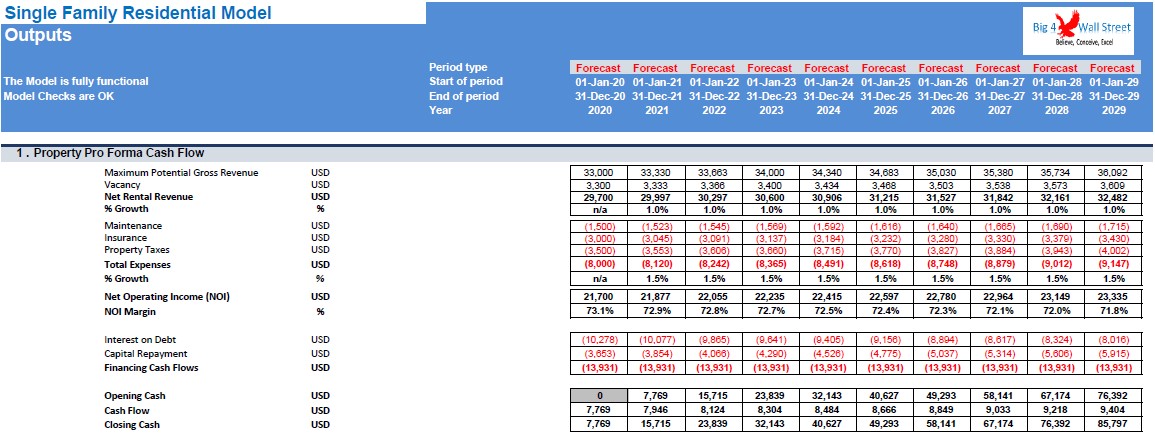
On the calculation tab, all calculations are performed. The calculations follow the same logical flow as the in the inputs tab. As already mentioned, no inputs from the user are needed here, as all the inputs are fed in the yellow cells on the inputs tab mainly. So, in this tab revenues, expenses, financing flows and free cash flows are calculated.
On the Outputs tab everything is aggregated into a cash flow statement, together with a free cash flow on a project basis as well as on an equity basis.
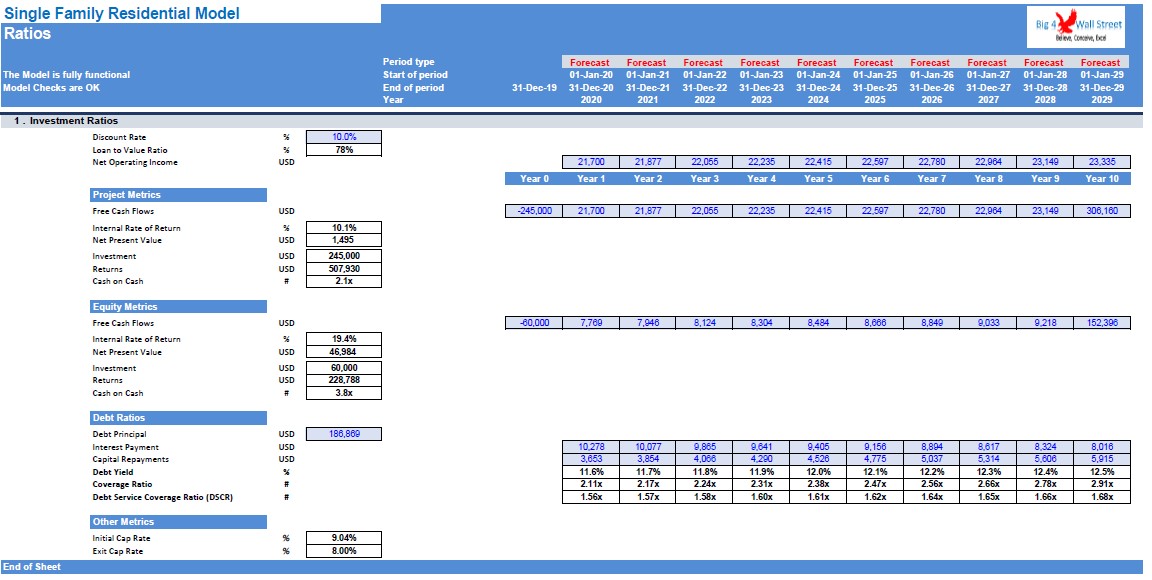
The most important investment metrics are presented on the ratios tab where you will find all the relevant KPIs summarized.
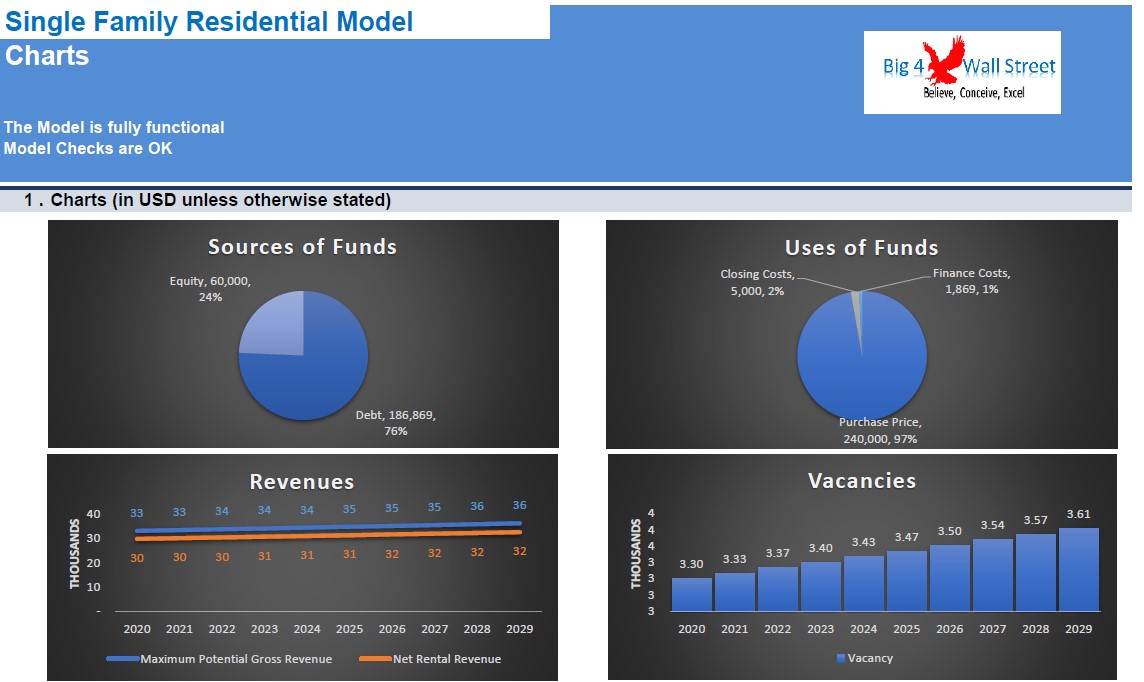
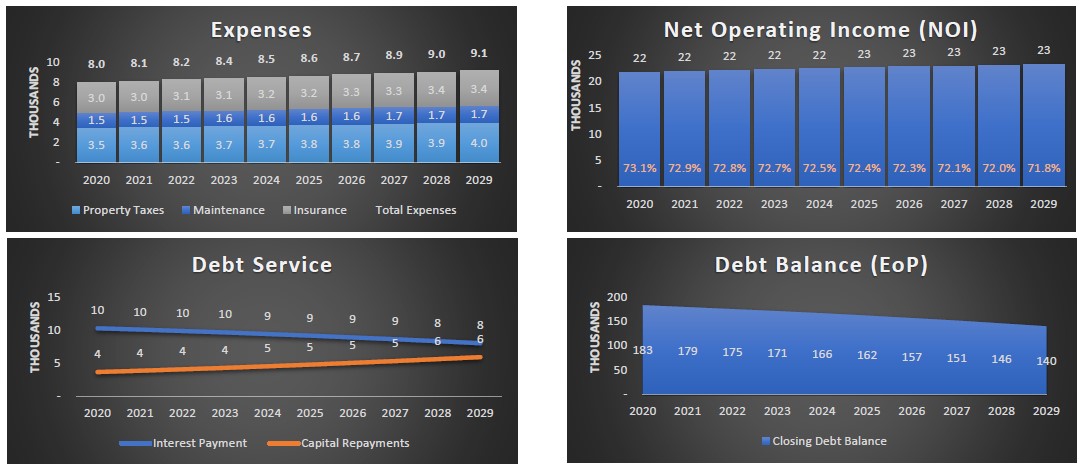
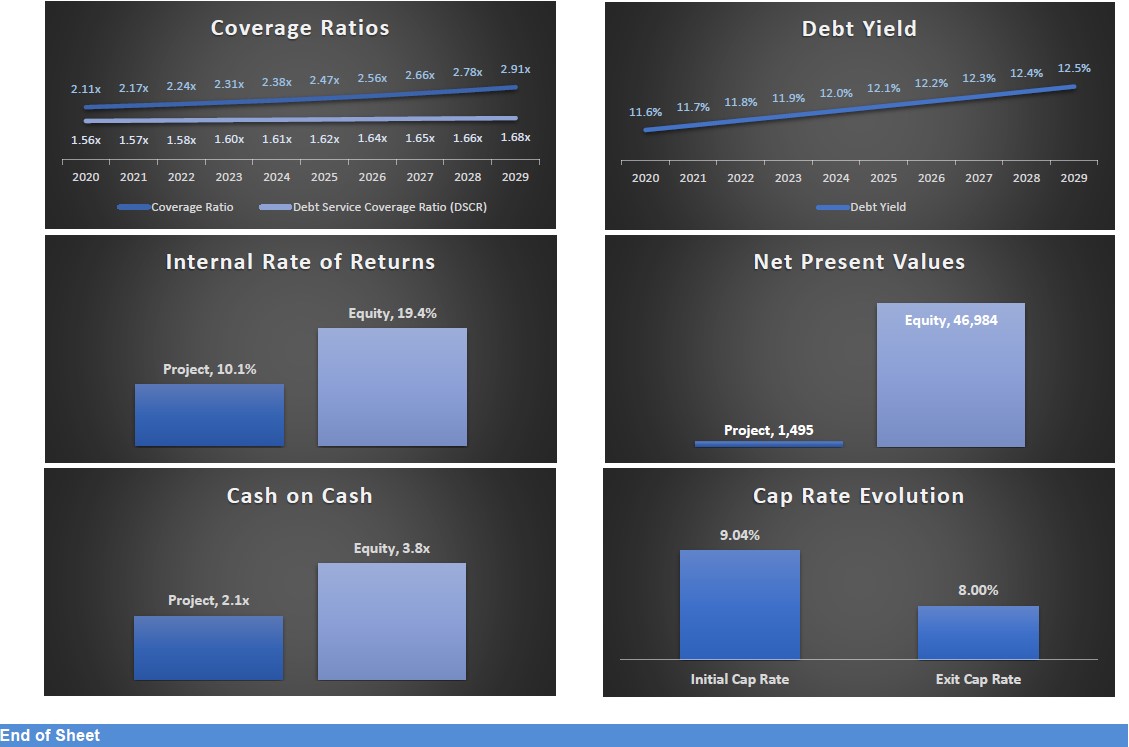
Additionally on the charts tab, a series of charts are presented: sources and uses, revenues, expenses, net operating income, debt service, debt balance, coverage ratios, debt yield, internal rate of returns, net present values, cash on cash and cap rate evolution.
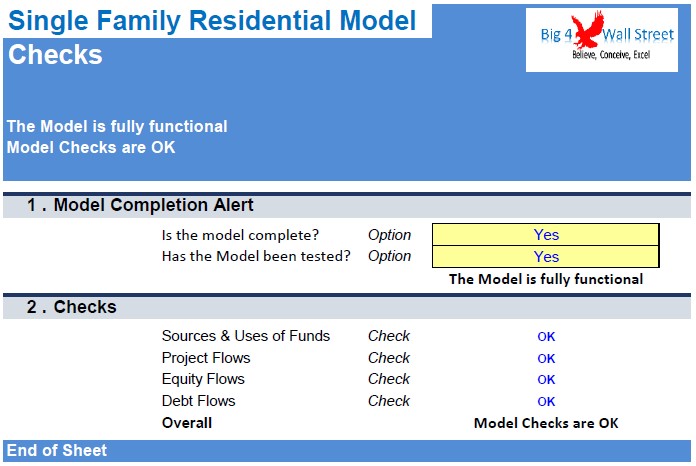
Finally the checks tab where the most critical checks are aggregated. Whenever you see an error message in any page, you should consult this page to see where the error is coming from.
Single Family Residential Model presents the case where a property is purchased and subsequently rented for several years before the property being sold. The model generates cash flows an a project and equity basis and also calculates the relevant metrics (cash on cash, Internal Rate of Return, net present value, loan to value, debt yield, coverage ratio and DSCR). The financing options for the project include equity funding from investors and an amortizing loan.
So, a quick overview of the model, in the contents tab you can see the structure of the model and by clicking on any of the headlines to be redirected to the relevant worksheet.
On the manual tab you can feed the general information for the model such as: model name, responsible, timeline of the model and date and currency conventions.
Additionally there is a description of the color coding of the model in the same tab. Inputs are always depicted with a yellow fill and blue letters, call up (that is direct links from other cells) are filled in light blue with blue letters while calculations are depicted with white fill and black characters.
There is also a color coding for the various tabs of the model. Yellow tabs are mostly assumptions tabs, grey tabs are calculations tabs, blue tabs are outputs tabs (that is effectively results or graphs) and finally light blue tabs are admin tabs (for example: the cover page, contents and checks).
Moving on to the inputs tab, you can adjust the various assumptions of the model based on the specifications and requirements of your business (in yellow whatever can be amended as an assumption). So effectively you can adjust a set of inputs such as purchase price along with closing costs and equity contribution, monthly rental, occupancy, inflation rates, maintenance, and insurance, as well as property taxes. Afterwards you can set debt financing assumptions (interest rates, tenor in years, and debt issuance costs), and valuation assumptions such as the exit year when the property will be sold, the exit cap rate and selling costs, as well as the discount rate used.
On the calculation tab, all calculations are performed. The calculations follow the same logical flow as the in the inputs tab. As already mentioned, no inputs from the user are needed here, as all the inputs are fed in the yellow cells on the inputs tab mainly. So, in this tab revenues, expenses, financing flows and free cash flows are calculated.
On the Outputs tab everything is aggregated into a cash flow statement, together with a free cash flow on a project basis as well as on an equity basis.
The most important investment metrics are presented on the ratios tab where you will find all the relevant KPIs summarized.
Additionally on the charts tab, a series of charts are presented: sources and uses, revenues, expenses, net operating income, debt service, debt balance, coverage ratios, debt yield, internal rate of returns, net present values, cash on cash and cap rate evolution.
Finally the checks tab where the most critical checks are aggregated. Whenever you see an error message in any page, you should consult this page to see where the error is coming from.
This Best Practice includes
1 Excel and 1 PDF
