
Originally published: 17/06/2022 12:03
Publication number: ELQ-45999-1
View all versions & Certificate
Publication number: ELQ-45999-1
View all versions & Certificate

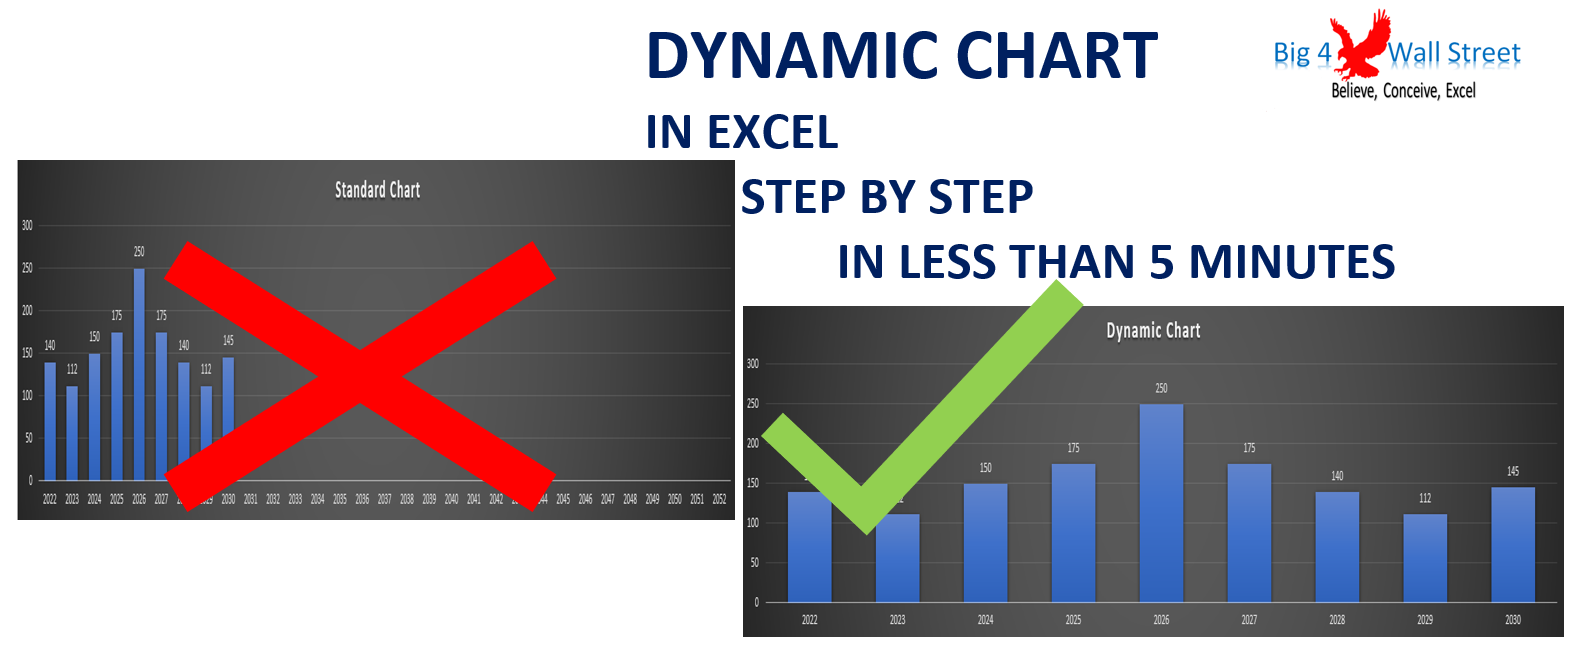
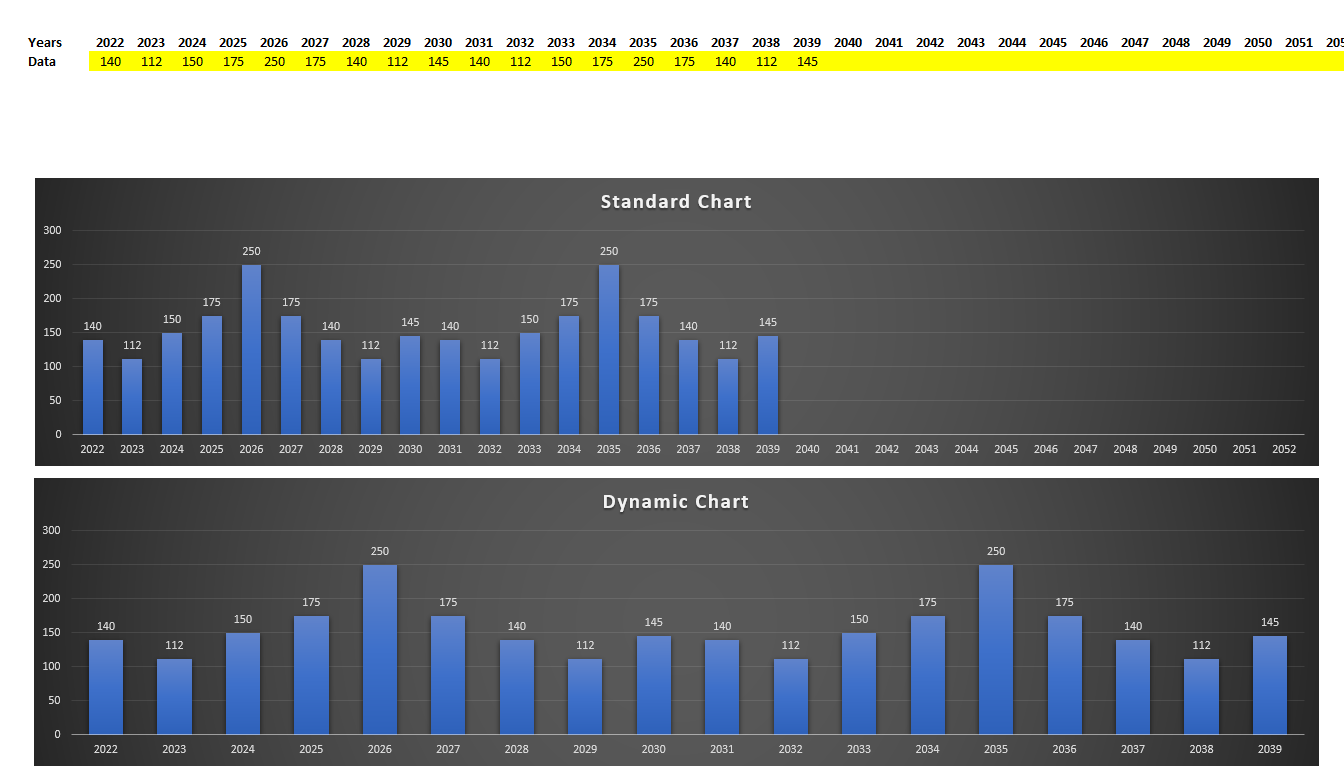
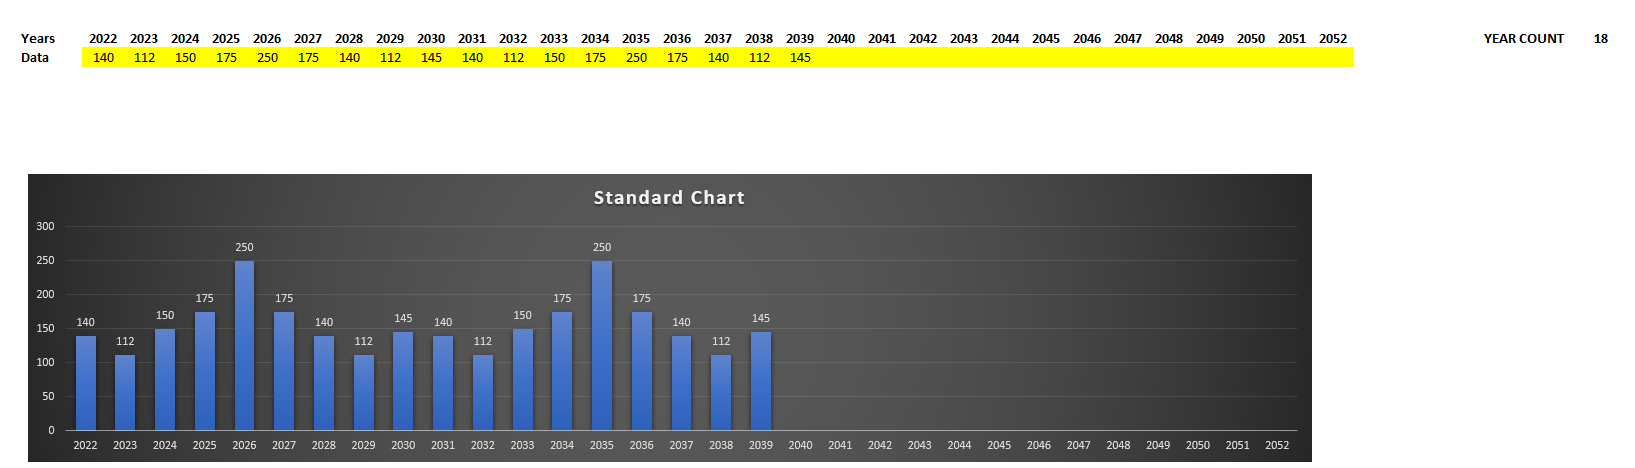
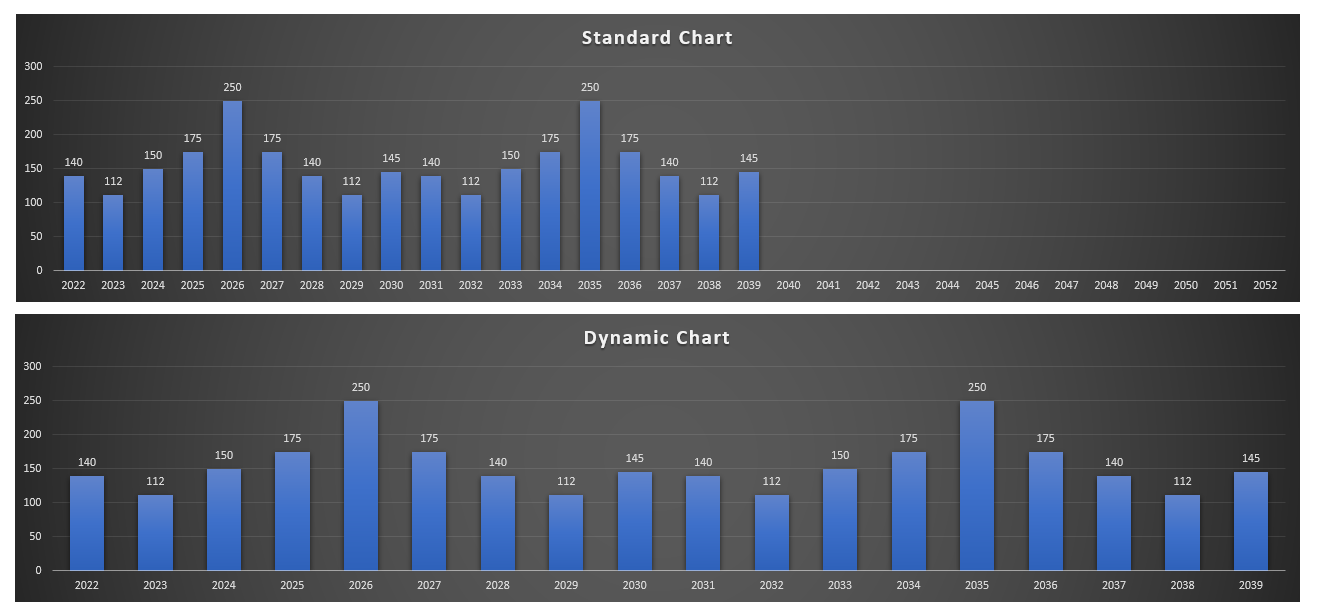
Dynamic Chart in Excel
Dynamic Chart in Excel Step by Step in less than 5 minutes. You can download the excel file / worked example in the video for free.
