
Originally published: 07/04/2023 07:59
Publication number: ELQ-75415-1
View all versions & Certificate
Publication number: ELQ-75415-1
View all versions & Certificate

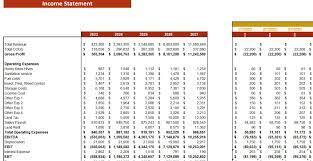
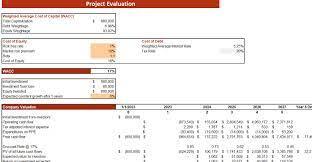
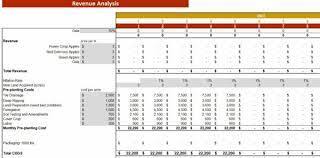
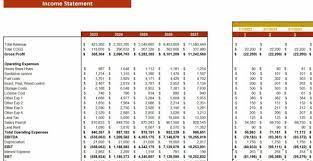
Apple Orchard Excel Financial Model
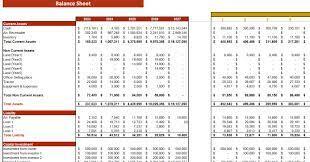
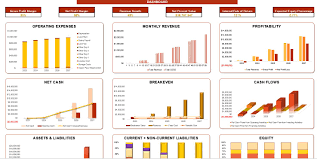
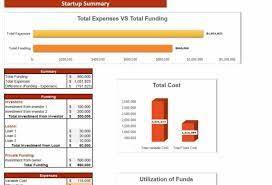
Our Apple Orchard Excel Financial Model is designed to help you make informed principal business and financial decisions based on accurate reporting.
Our mission is to be the industrial leader and pioneer in our business domainFollow 17
Further information
The objective of this model is to provide you with an optimal financial plan to support fundraising plans, improve your startup plan, and enable you and your potential investors to acknowledge a deep knowledge of how the economics of your business works.
