Publication number: ELQ-42122-1
View all versions & Certificate

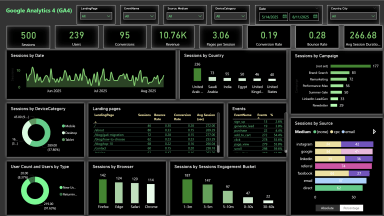
Google Analytics 4 (GA4) Dashboard (Power BI)
GA4 Dashboard Power BI
Further information
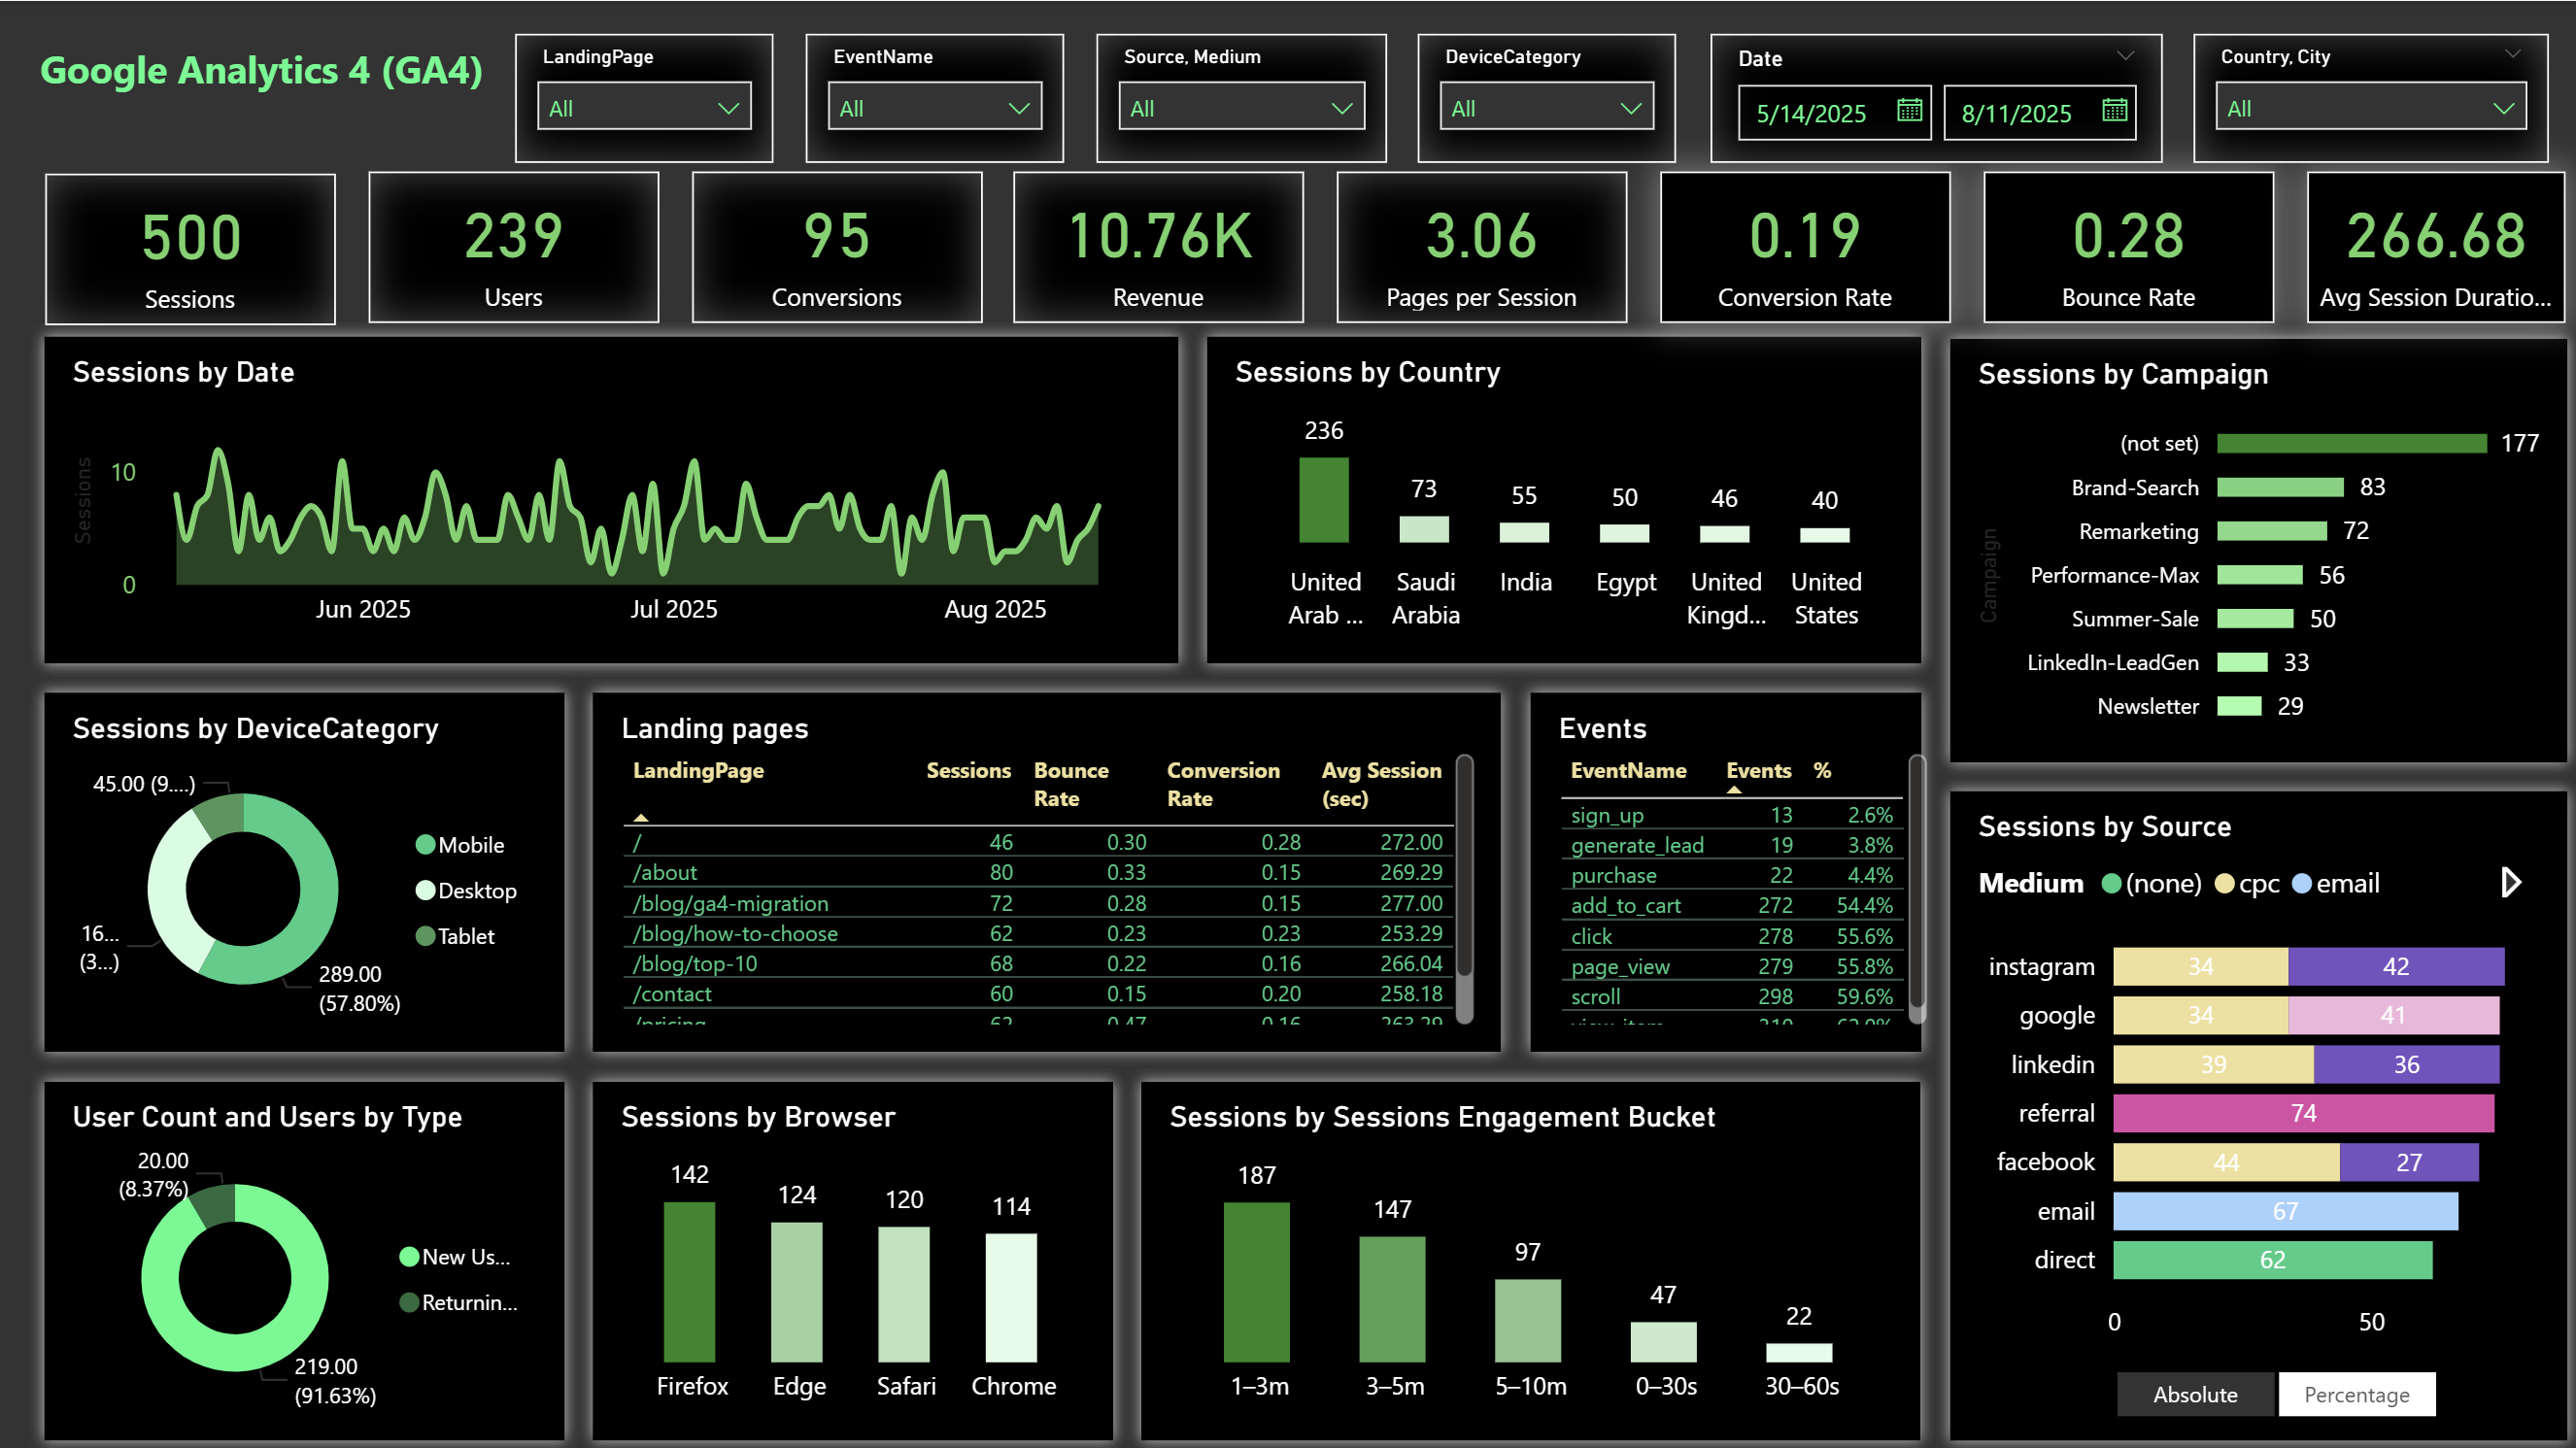
Provide a ready-to-use Power BI dashboard template for visualizing Google Analytics 4 (GA4) data.
Enable quick and accurate analysis of website performance metrics, including sessions, users, conversions, and revenue.
Offer actionable insights into user acquisition channels, device usage, geographic distribution, and behavior patterns.
Support marketing and analytics teams in identifying high-performing campaigns and optimizing underperforming ones.
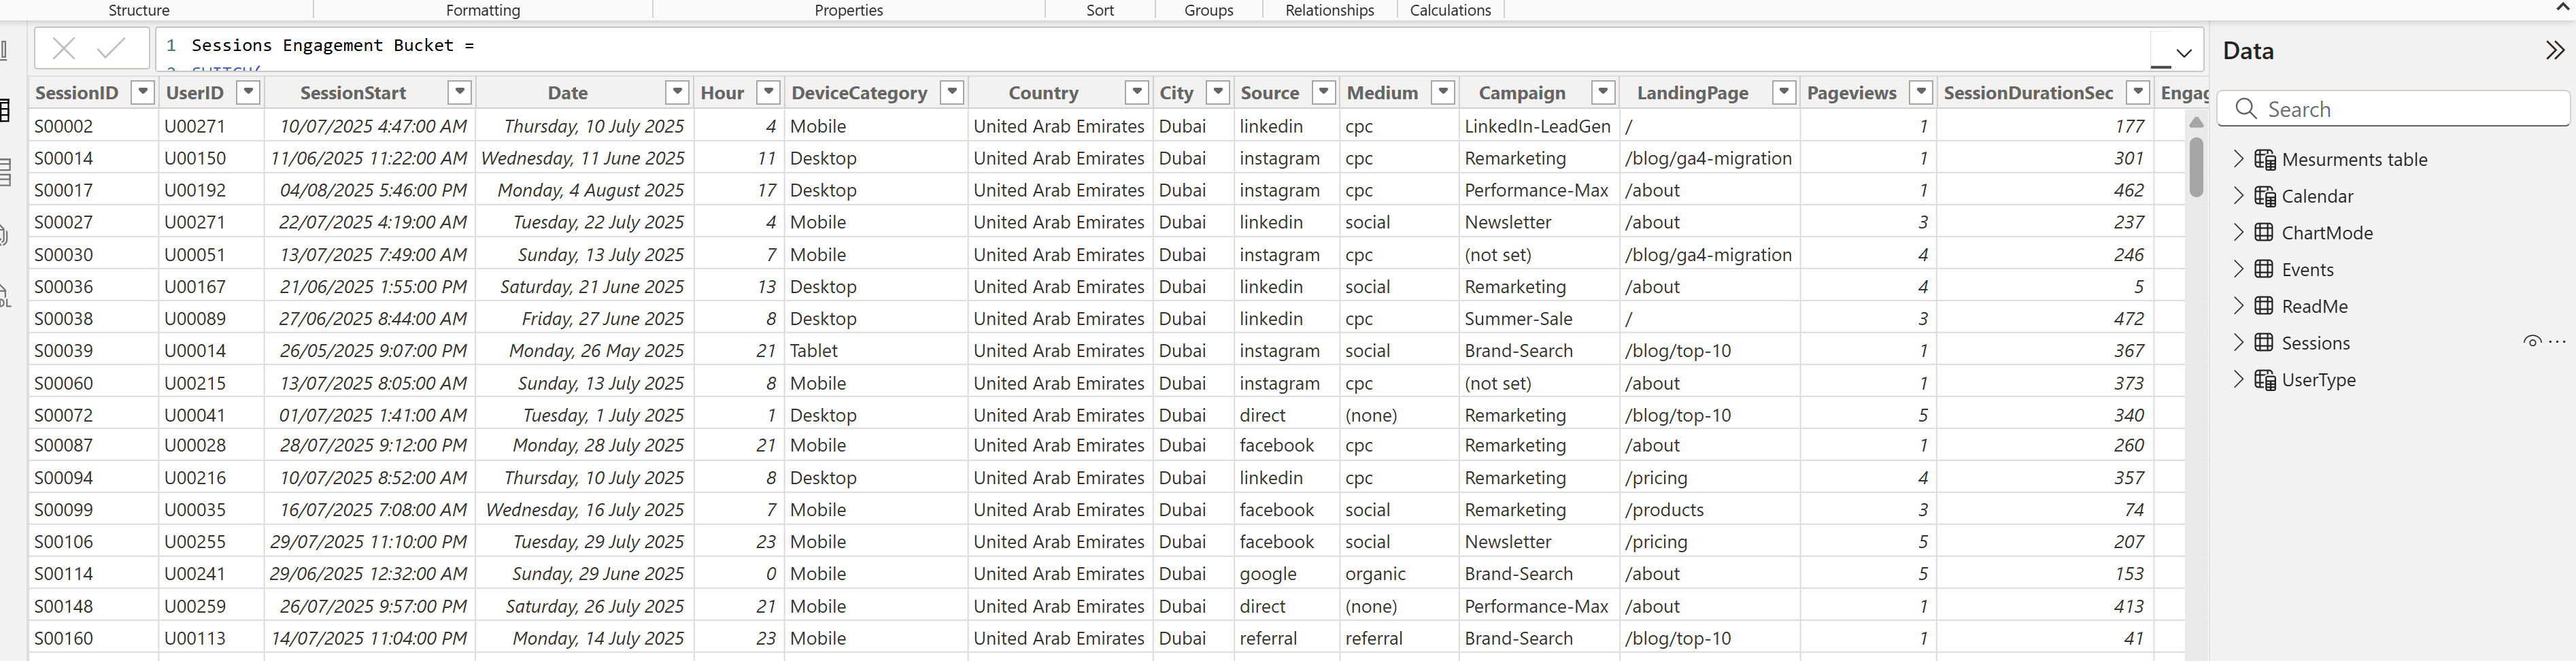
Streamline the reporting process by integrating session-level and event-level GA4 data into a single, interactive view.
Facilitate conversion funnel analysis to pinpoint drop-off stages and improve customer journeys.
Provide a flexible filtering system (date range, device category, country, campaign, landing page, event name) to customize analysis.
Incorporate advanced visual features such as absolute/percentage toggles and engagement time distributions for deeper insight.
Maintain a professional and visually consistent theme to enhance usability and executive reporting.
Reduce setup time for GA4 reporting, allowing teams to focus on decision-making rather than manual data preparation.
Organizations actively tracking website performance data through Google Analytics 4 (GA4).
Businesses that want to centralize and visualize GA4 metrics in Power BI for interactive reporting.
Marketing, analytics, and product teams that need quick insights into acquisition, engagement, and conversion trends.
Companies running multi-channel digital marketing campaigns (Google Ads, social media, email) and needing cross-channel performance comparison.
Websites with measurable goals such as purchases, sign-ups, or lead generation, where conversion tracking is essential.
Teams seeking a professional, presentation-ready dashboard for stakeholders and management.
Environments where slicers and dynamic filters are important for drilling into specific date ranges, devices, locations, or campaigns.
Users who need toggle views (absolute vs. percentage) for better interpretation of acquisition and engagement data.
Scenarios where both session-level and event-level analysis is required for comprehensive reporting.
Organizations looking for a dark/green themed modern visual style that maintains clarity in large datasets.
Businesses that do not use Google Analytics 4 (GA4) as their primary web analytics platform.
Organizations without access to session-level and event-level GA4 data needed to populate the dashboard.
Teams that require real-time dashboards directly connected to live GA4 APIs (this template uses imported datasets).
Websites with extremely minimal traffic or limited event tracking, where visualizations may not be meaningful.
Companies that need to integrate multiple non-web data sources (e.g., CRM, ERP) into the same report without additional customization.
