

Publication number: ELQ-53744-1
View all versions & Certificate

Real Estate Private Equity Fund Financial Projection Model 10 Years
A comprehensive editable, 10 Year 3 statement MS Excel spreadsheet for tracking Real Estate Private Equity Funding
AllFinancialModels offer a curated selection of high-quality yet financial model templates designed to support a wide range of business needs.Follow
A 10-year 3-statement Real Estate Private Equity Fund Financial Model is a robust financial tool designed to forecast, analyze, and evaluate the long-term performance of a private equity (PE) fund. Built with a focus on the fund’s lifecycle, it combines detailed financial projections across the Income Statement, Balance Sheet, and Cash Flow Statement over a 10-year horizon, capturing both fund- and portfolio-level metrics.
Core Features and Components
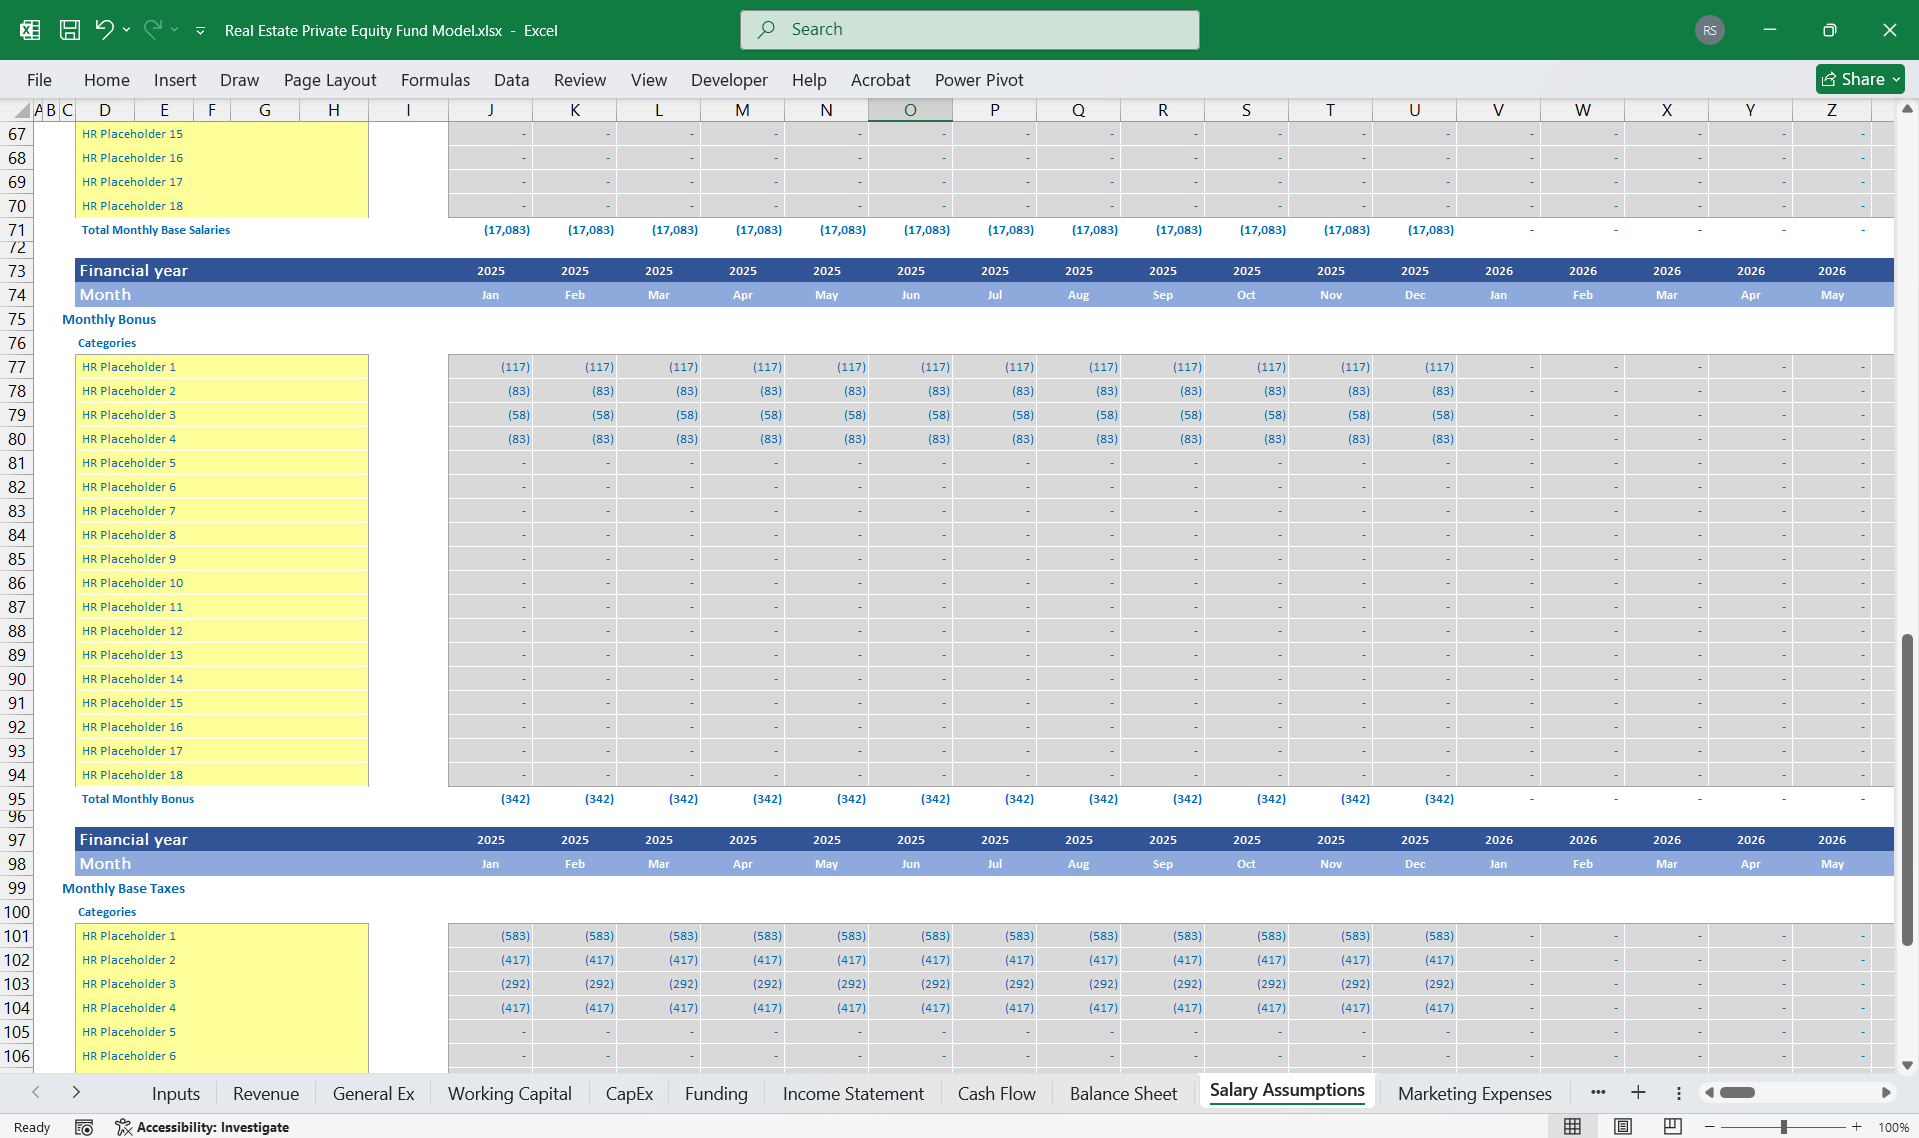
1. Fund Structure and Management Assumptions
Capital Commitments: Models Limited Partner (LP) and General Partner (GP) commitments, including commitment schedules, contributions, and unused capital.
Management Fees: Calculates fixed or percentage-based fees based on committed or deployed capital, adjusting over the fund’s life.
Carried Interest and Waterfall Modeling: Includes industry-standard waterfall structures, such as hurdles (preferred returns), GP catch-up phases, and residual profit-sharing.
Hurdle Rates: Incorporates IRR thresholds for prioritizing LP returns before the GP earns carried interest.
2. Investment and Exit Assumptions
Portfolio Construction:
It enables customization of the number of portfolio companies and capital deployment strategies (e.g., percentage allocations over time).
Tracks equity injections, operational improvements, and growth forecasts for underlying investments.
Exit Planning:
Projects exit based on valuation multiples, investment growth, and exit timelines.
Accommodates single and multiple exit scenarios for flexibility.
Deal Analysis:
Provides detailed deal-level cash flows and IRRs.
Calculates unrealized and realized returns separately.
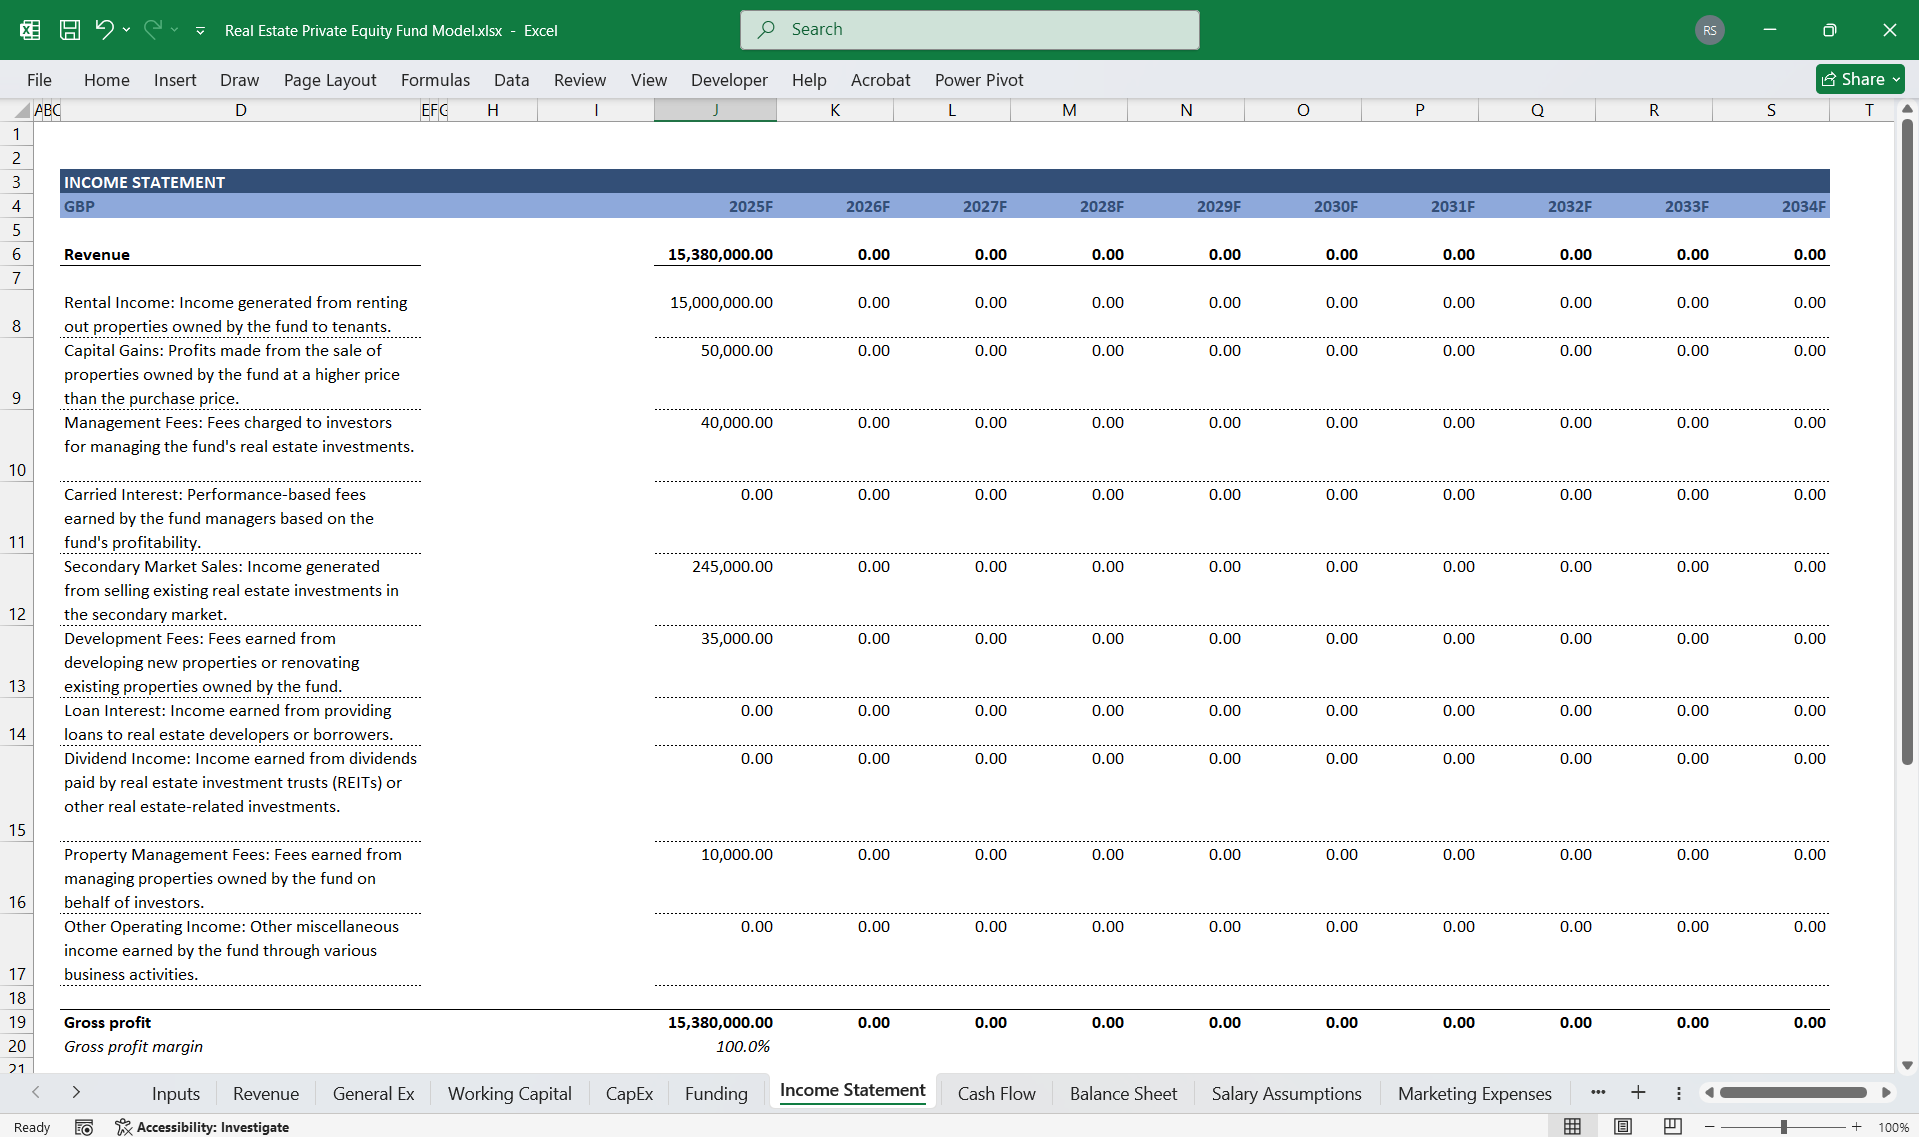
3. Income Statement Projections
Fund Revenue:
Tracks management fees, carried interest income, portfolio company dividends, and other sources of revenue.
Fund Expenses:
Captures fund-level costs such as operational expenses, advisory fees, and interest expense.
Profitability Metrics:
Includes net income, GP performance fee income (carry), and performance breakdowns across investment horizons.
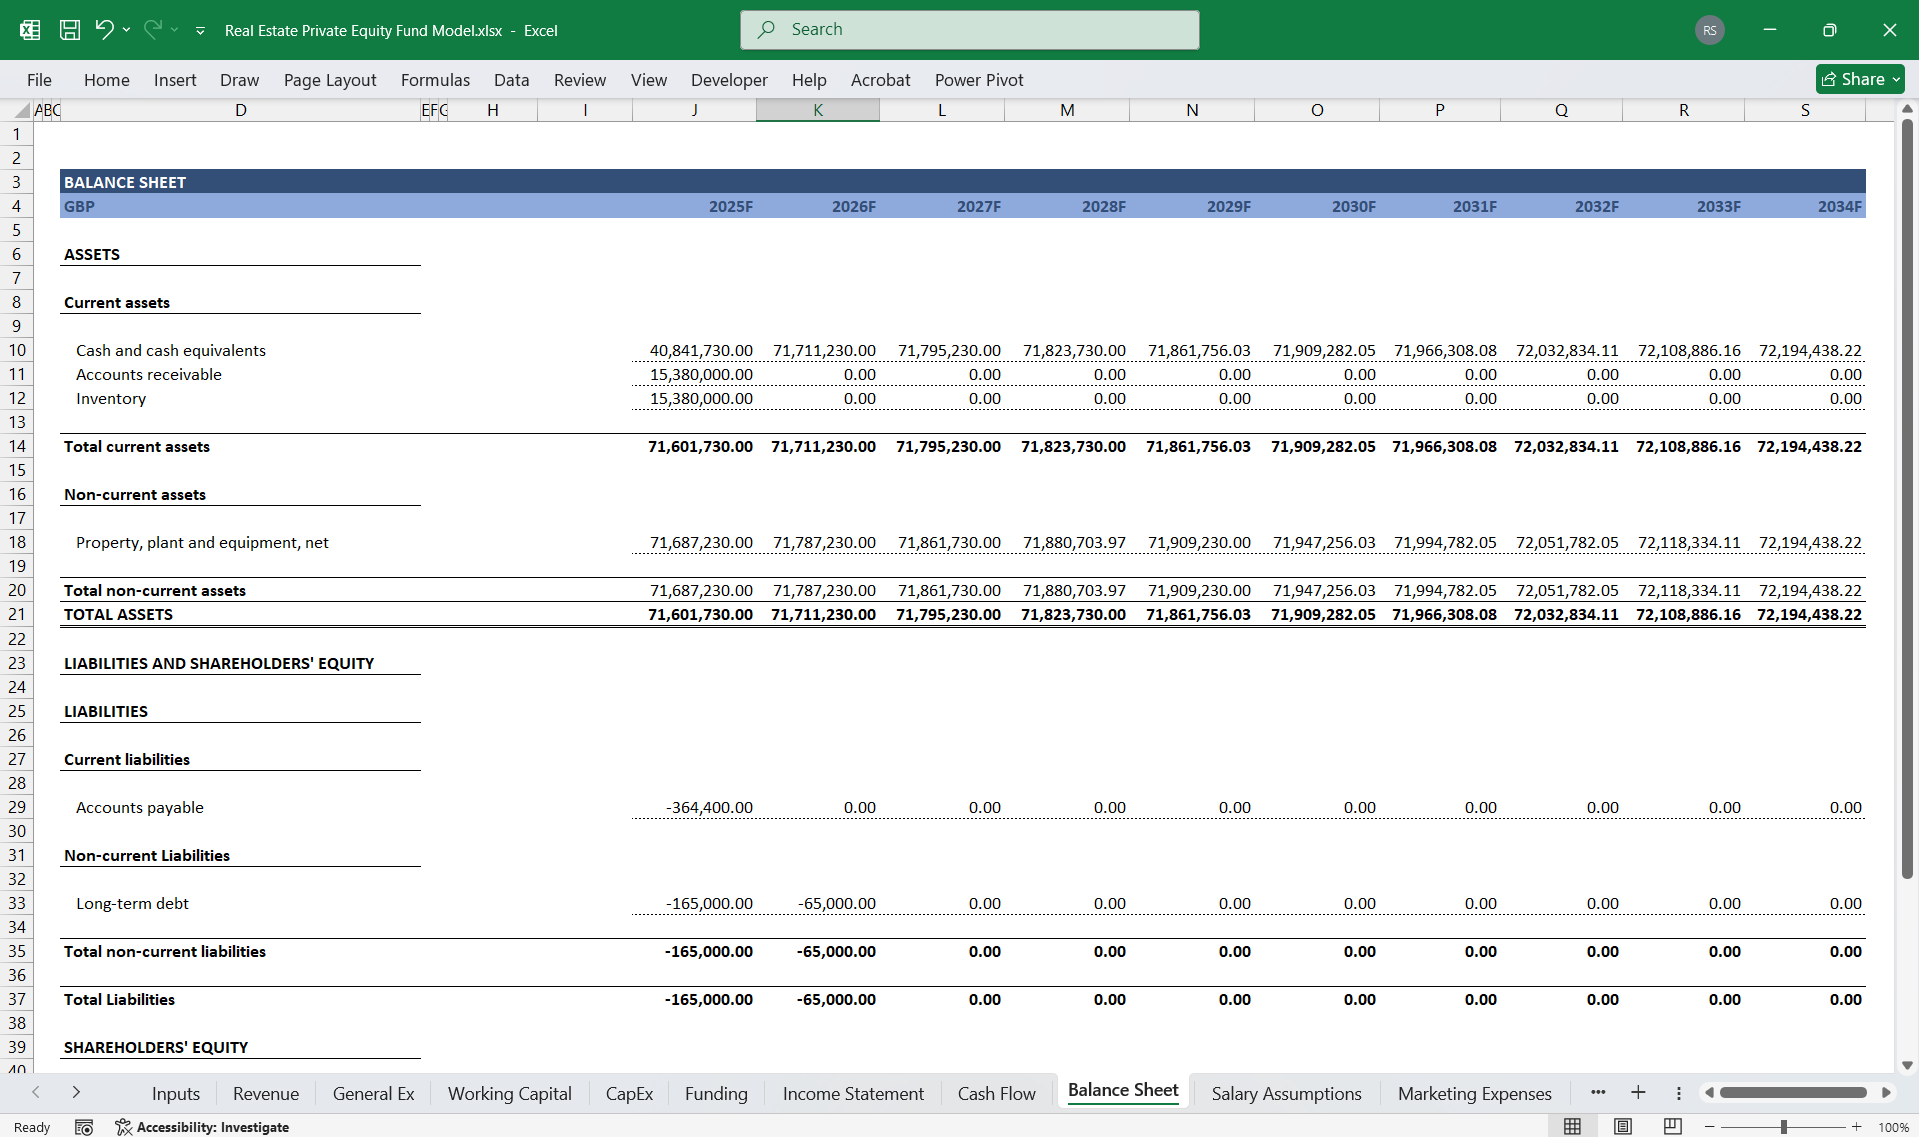
4. Balance Sheet Projections
Fund Assets:
Projects cash balances, unrealized investments, and residual fund value.
Fund Liabilities and Equity:
Models GP commitments, unfunded LP commitments, and cumulative fund equity.
Portfolio Valuation:
Tracks fair market value (FMV) of investments as they mature or exit, with revaluation mechanisms.
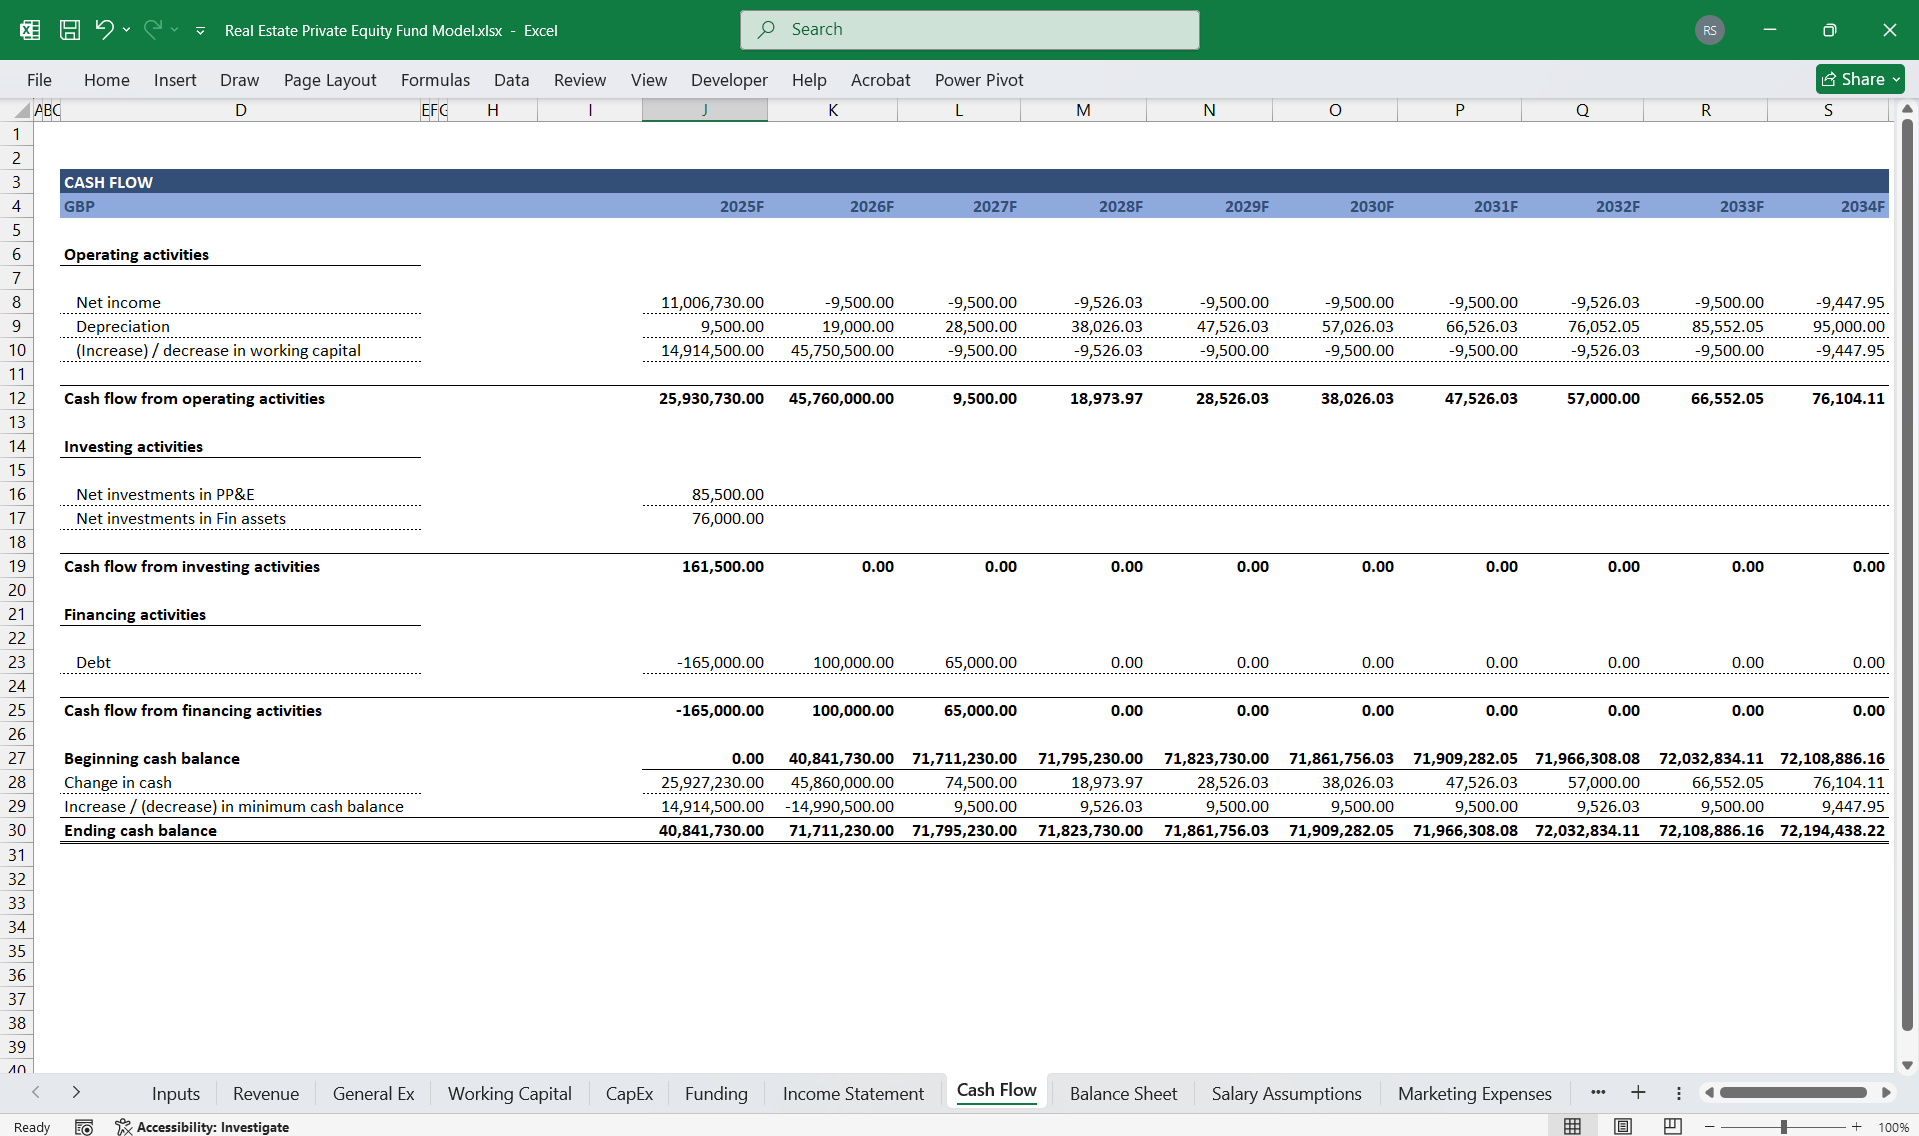
5. Cash Flow Statement Projections
Capital Calls and Returns to Investors:
Dynamically forecasts LP contributions, distributions (return of capital and profits), and residual value realization.
Investment Activities:
Models cash outflows for investments, follow-on funding, and transaction costs.
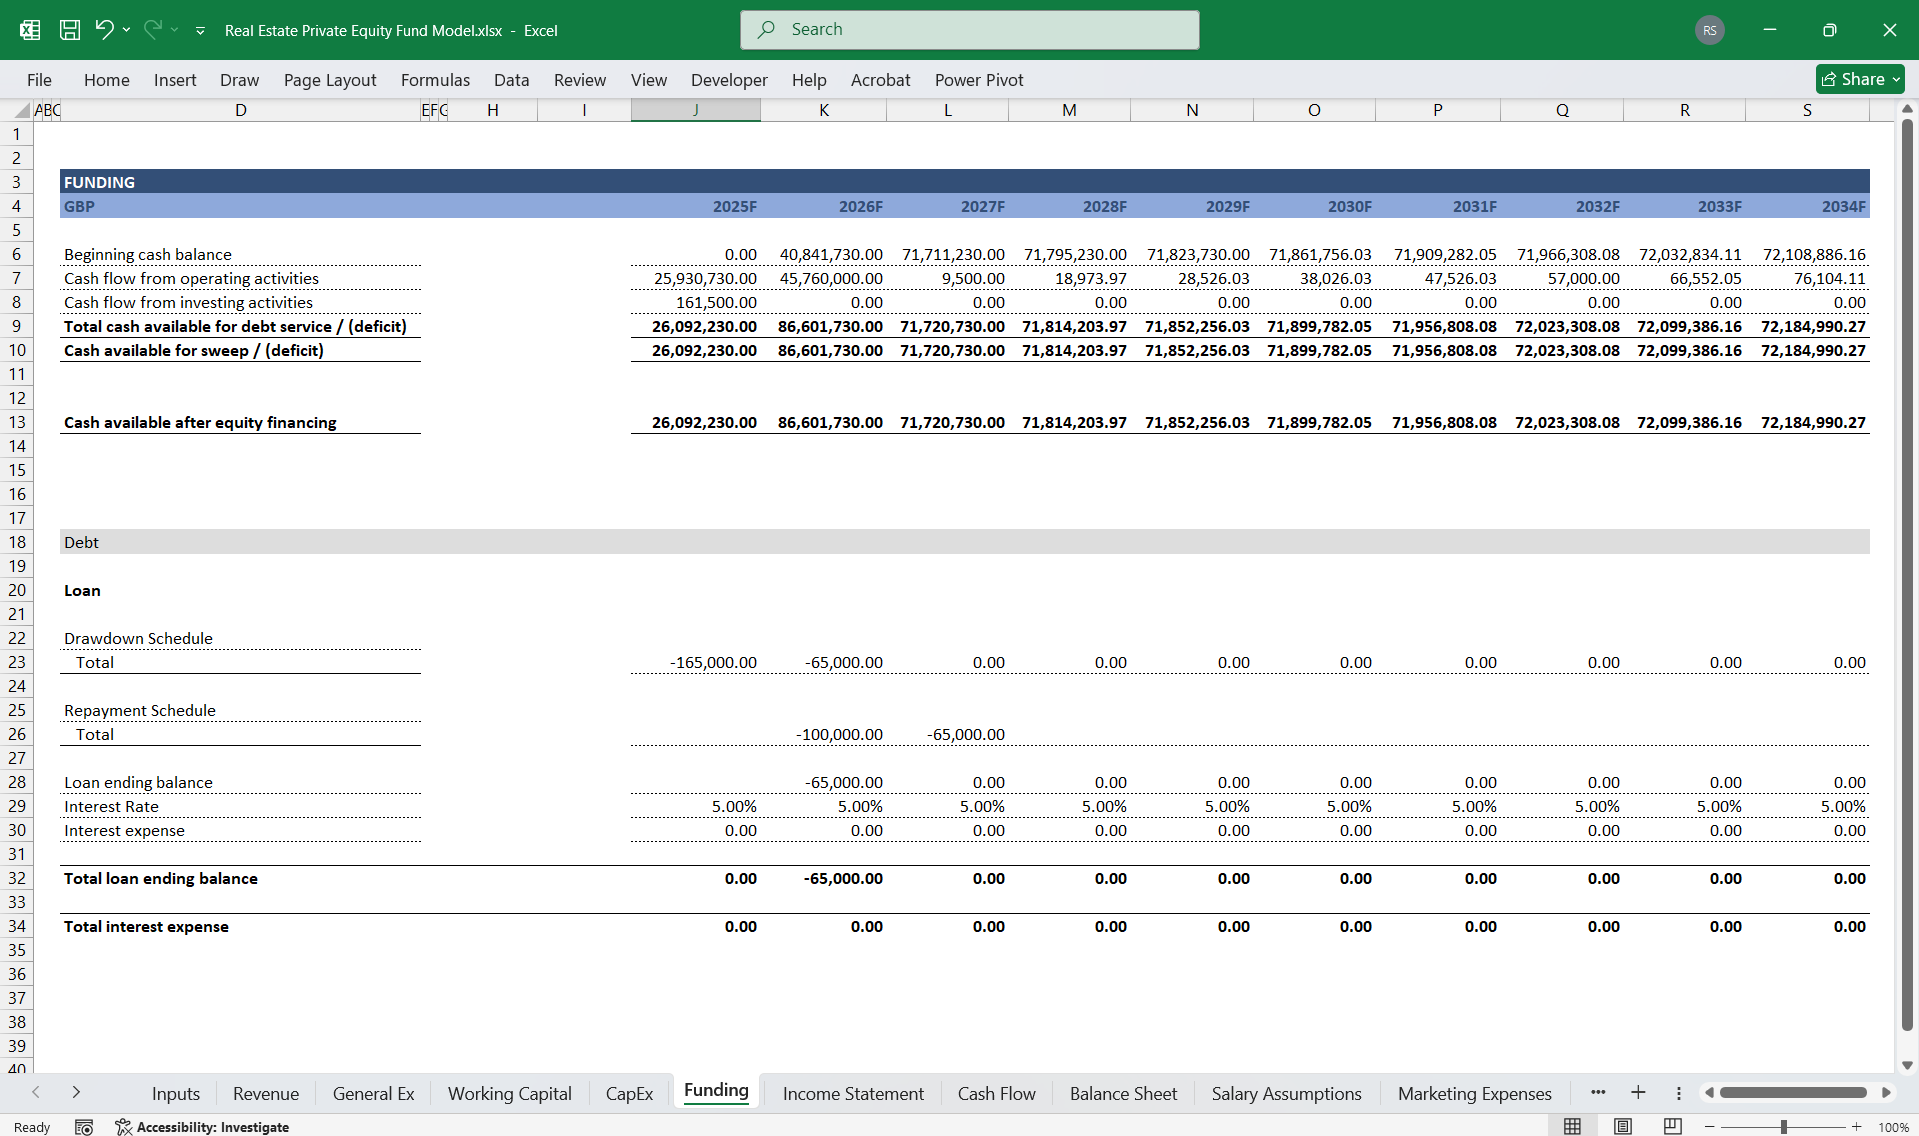
Fund-Level Debt Financing (if applicable):
Includes terms for fund-level loans or subscription line financing with interest payments and repayment schedules.
6. Key Performance Metrics
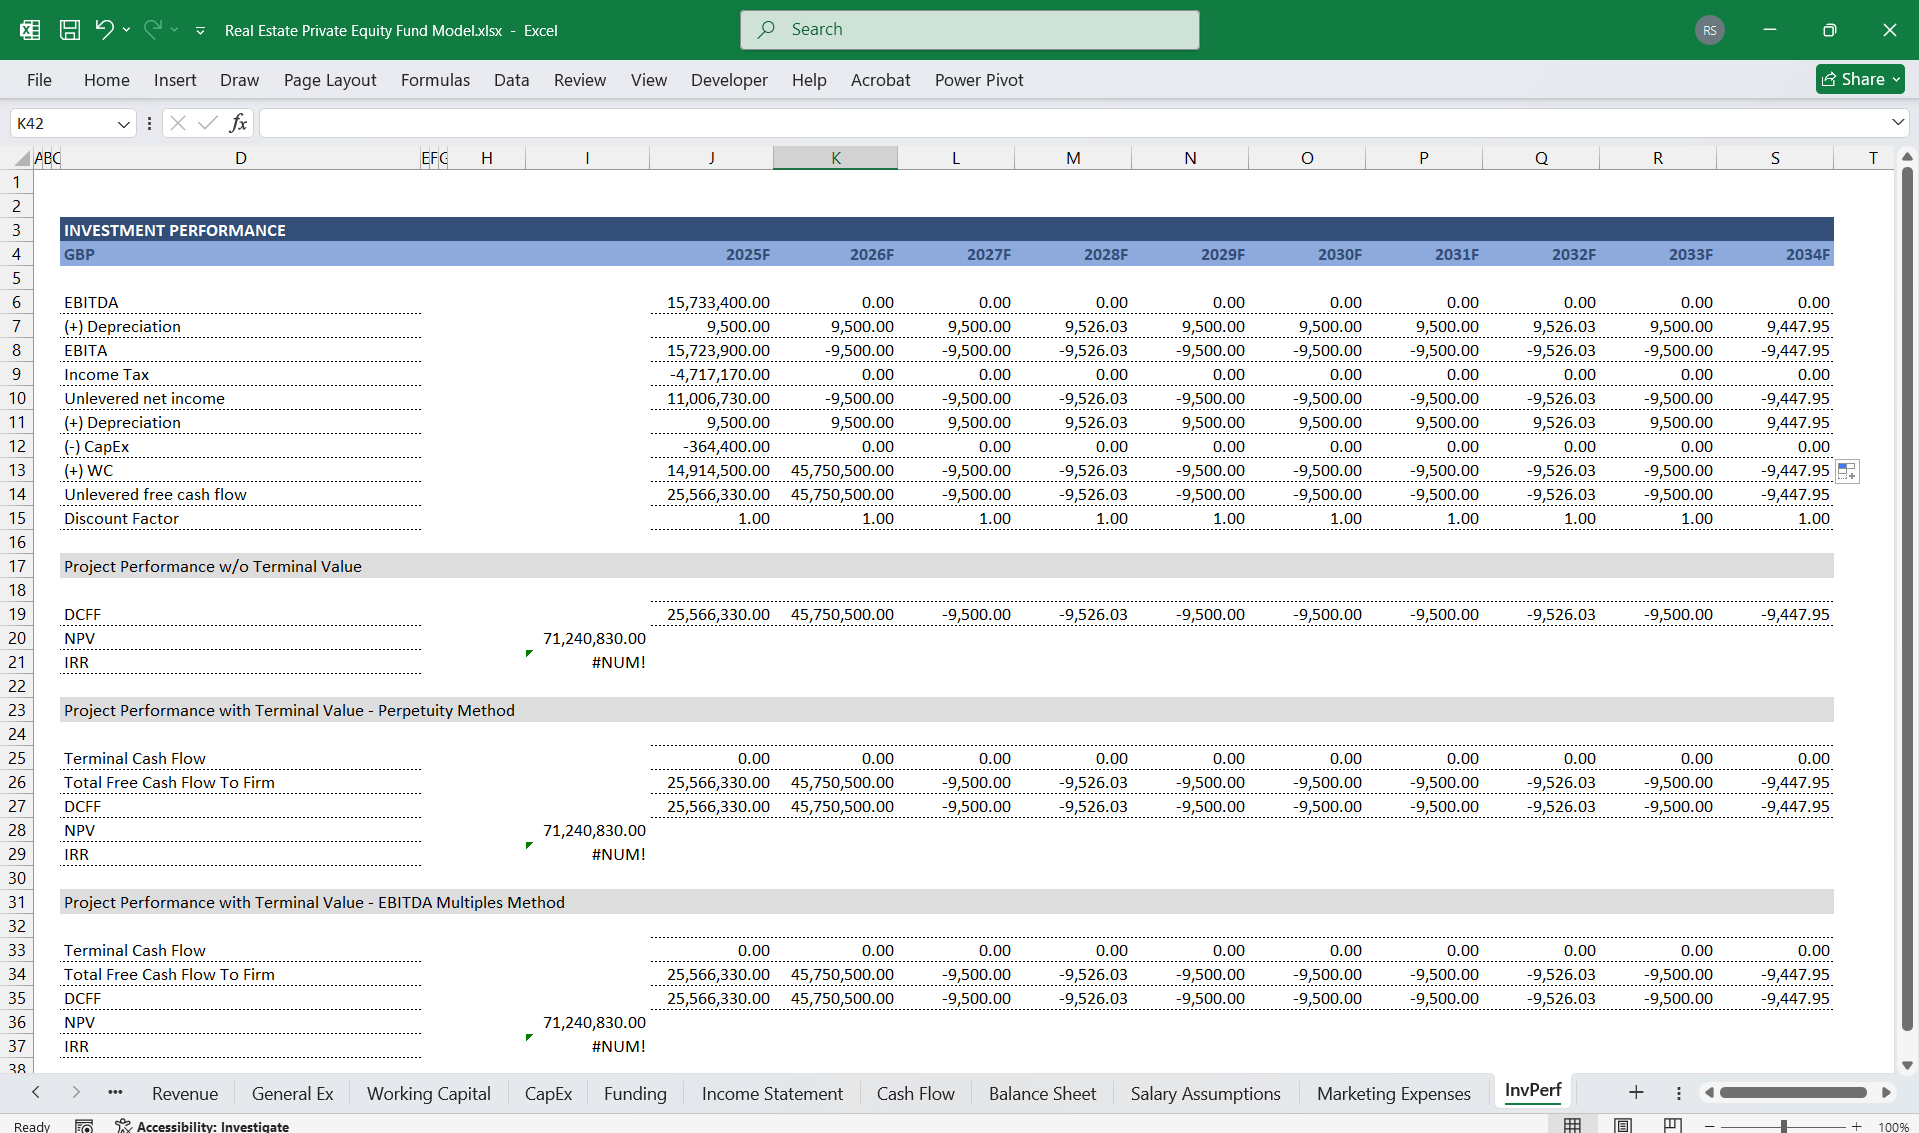
IRR and Multiples:
Tracks both fund-level and deal-level Internal Rates of Return (gross and net).
Calculates DPI (Distributions to Paid-In Capital), RVPI (Residual Value to Paid-In Capital), and TVPI (Total Value to Paid-In Capital).
MOIC (Multiple on Invested Capital):
Breaks down realized and unrealized multiples.
Capital Deployment and Distribution Curves:
Provides visual tools to monitor capital efficiency and cash distributions over the fund’s term.
7. Scenario Analysis and Sensitivity Testing
Custom Inputs:
Enables sensitivity testing for variables like exit multiples, capital deployment rates, leverage ratios, and market returns.
Stress Testing:
Evaluate downside risk scenarios and their impact on IRR and return multiples.
What-If Analysis:
Compares alternative fund strategies and investment plans under varied assumptions.
8. Visualization and Reporting
Dashboards and Summaries:
Consolidates key insights like capital utilization, fund lifecycle graphs, IRR distributions, and valuation multiples.
Portfolio Analytics:
Displays performance for individual companies and how they contribute to overall fund returns.
LP Reporting:
Structured outputs for Limited Partners, providing transparency into fund performance, cash flows, and projected distributions.
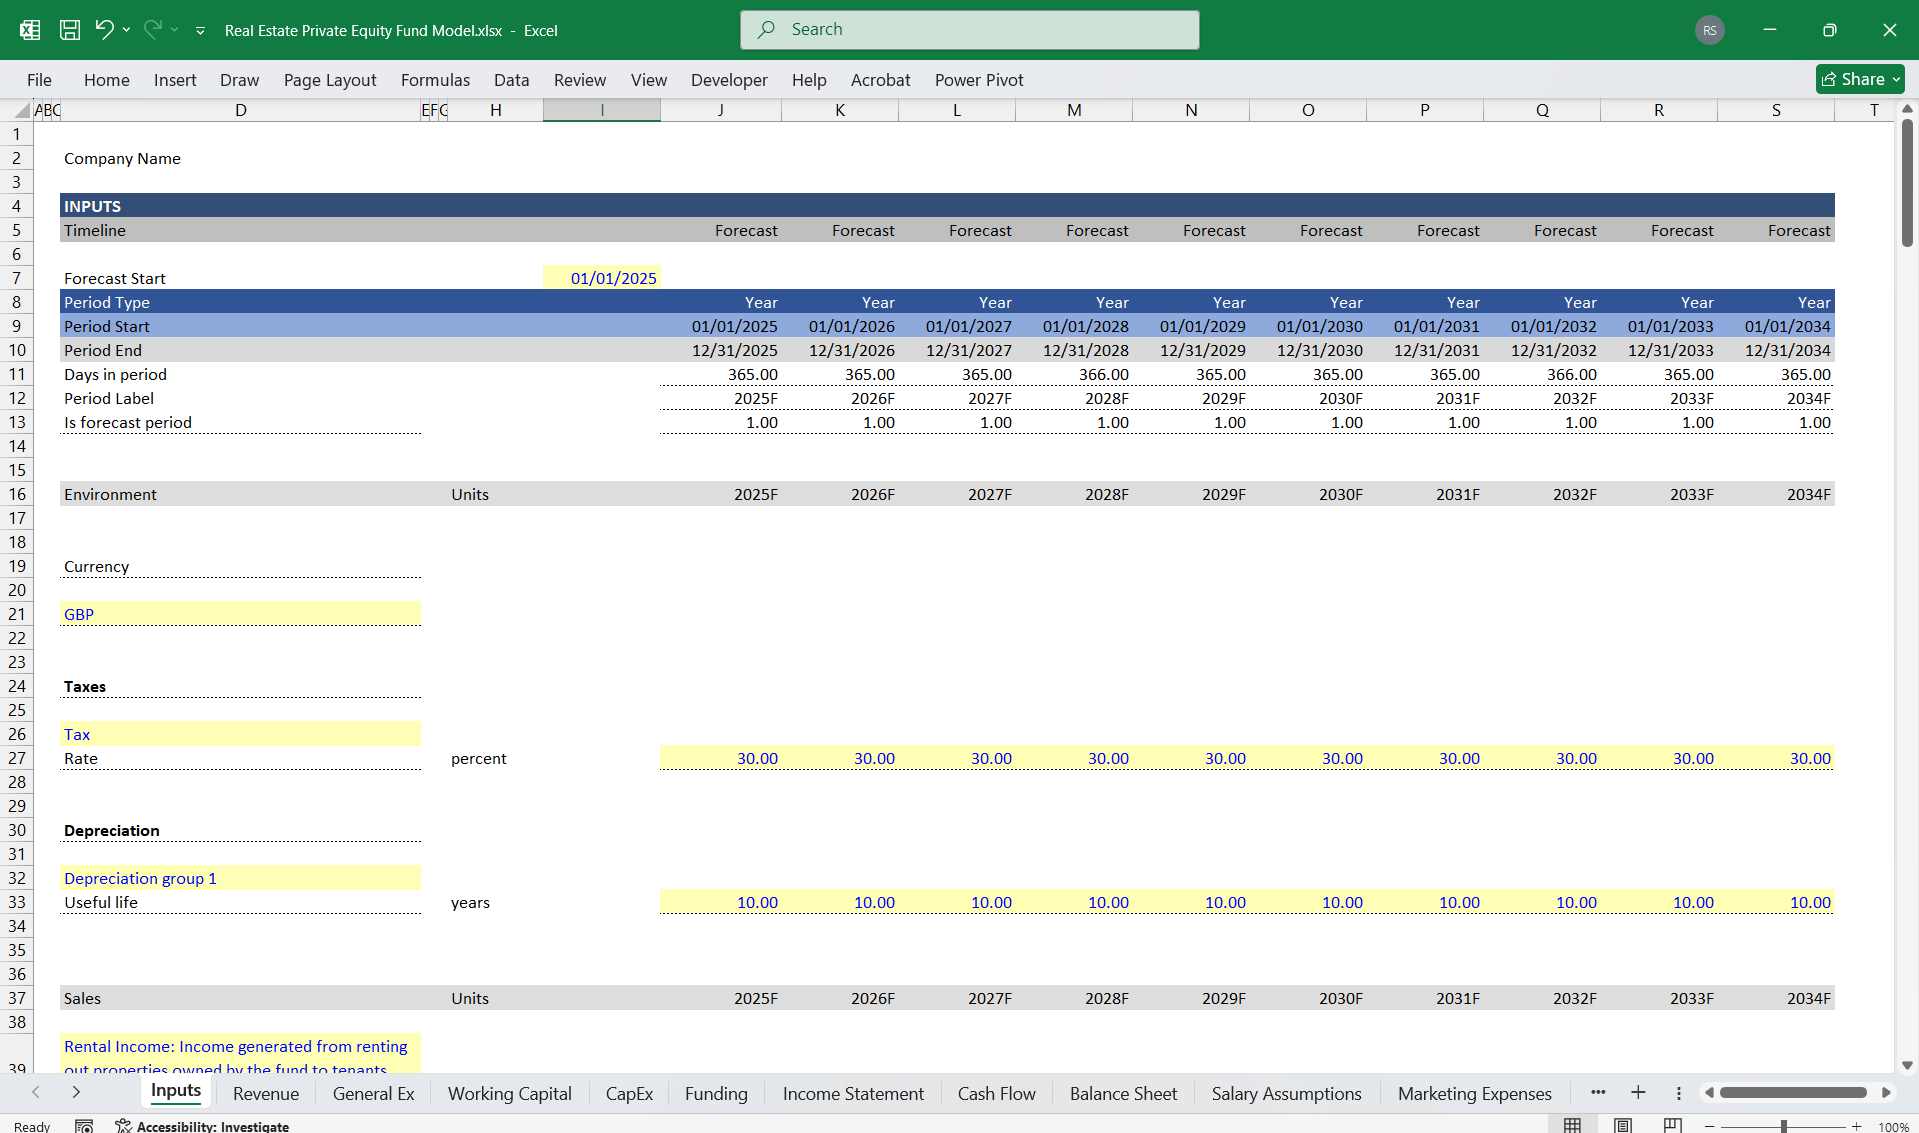
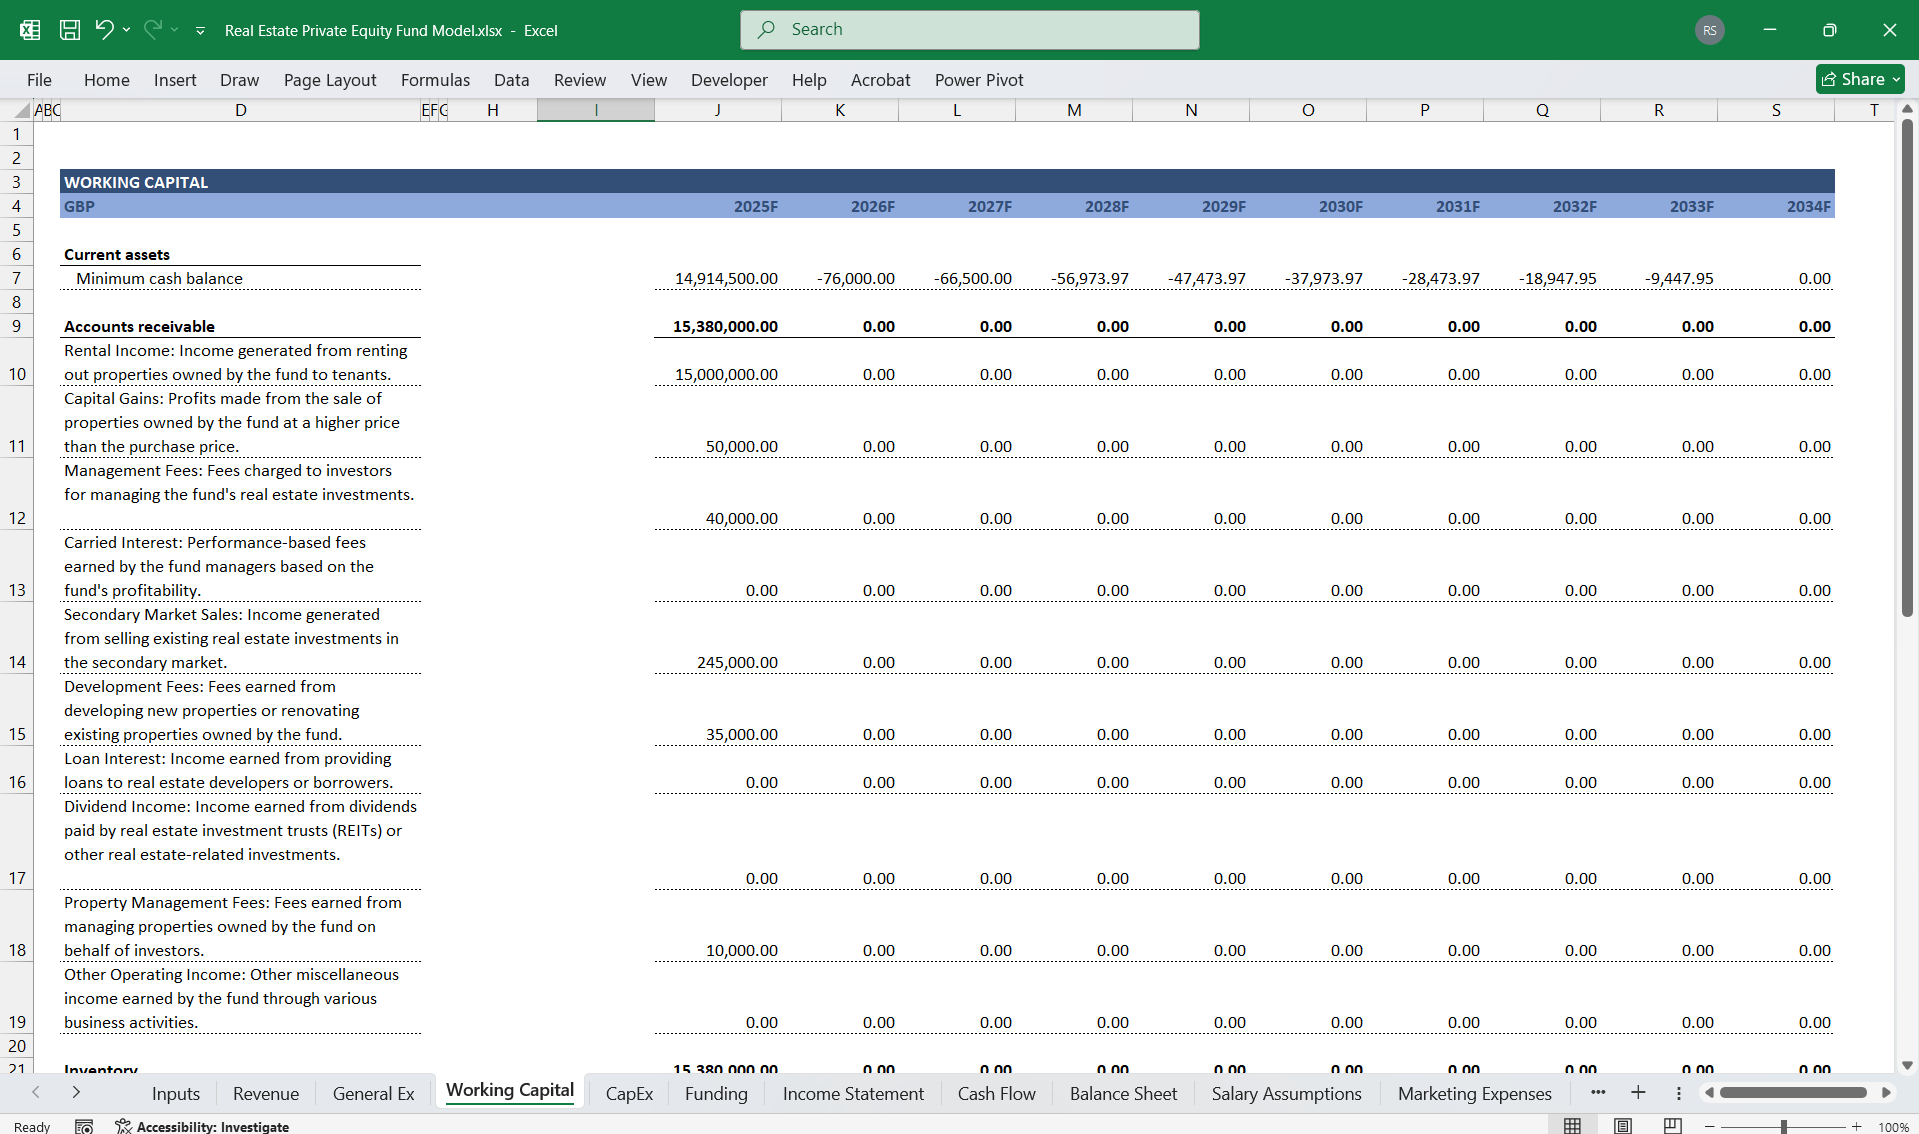
Inputs:
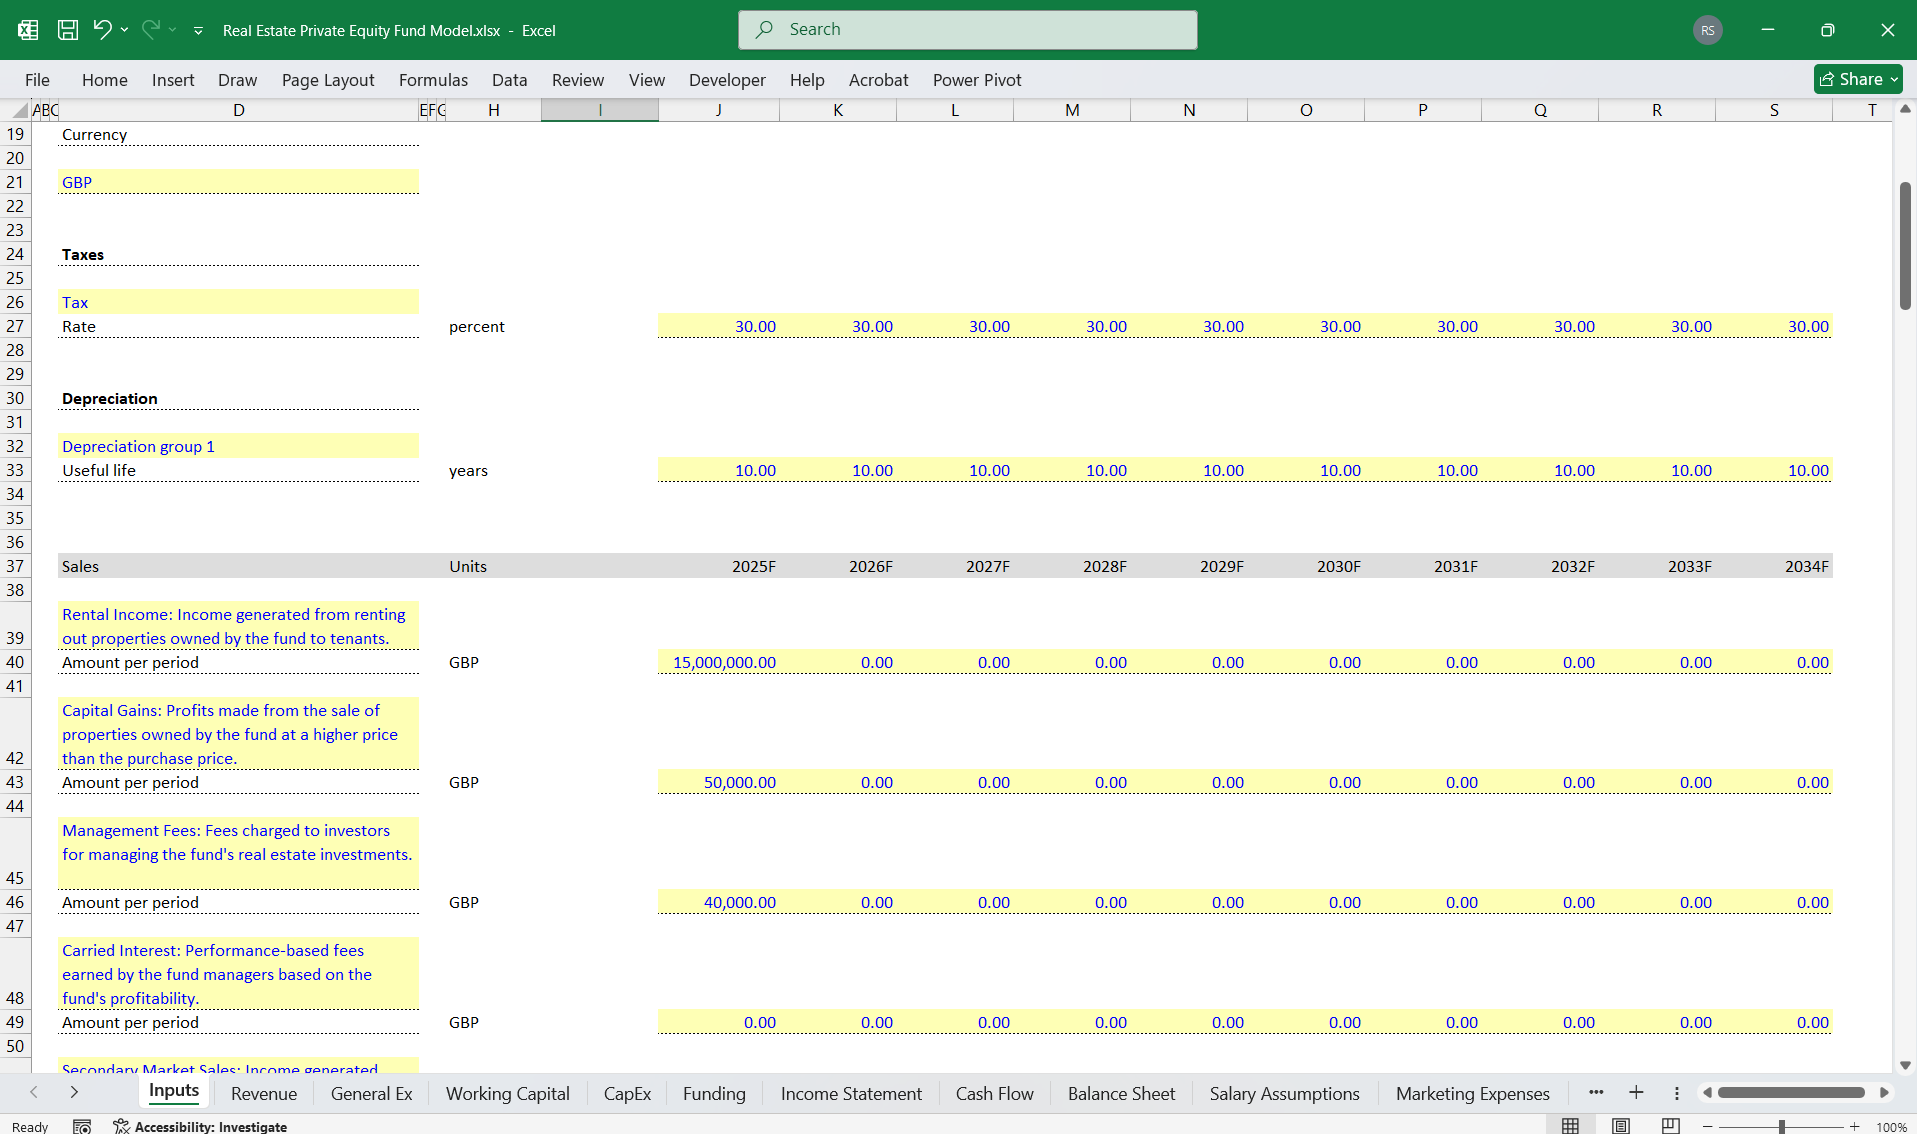
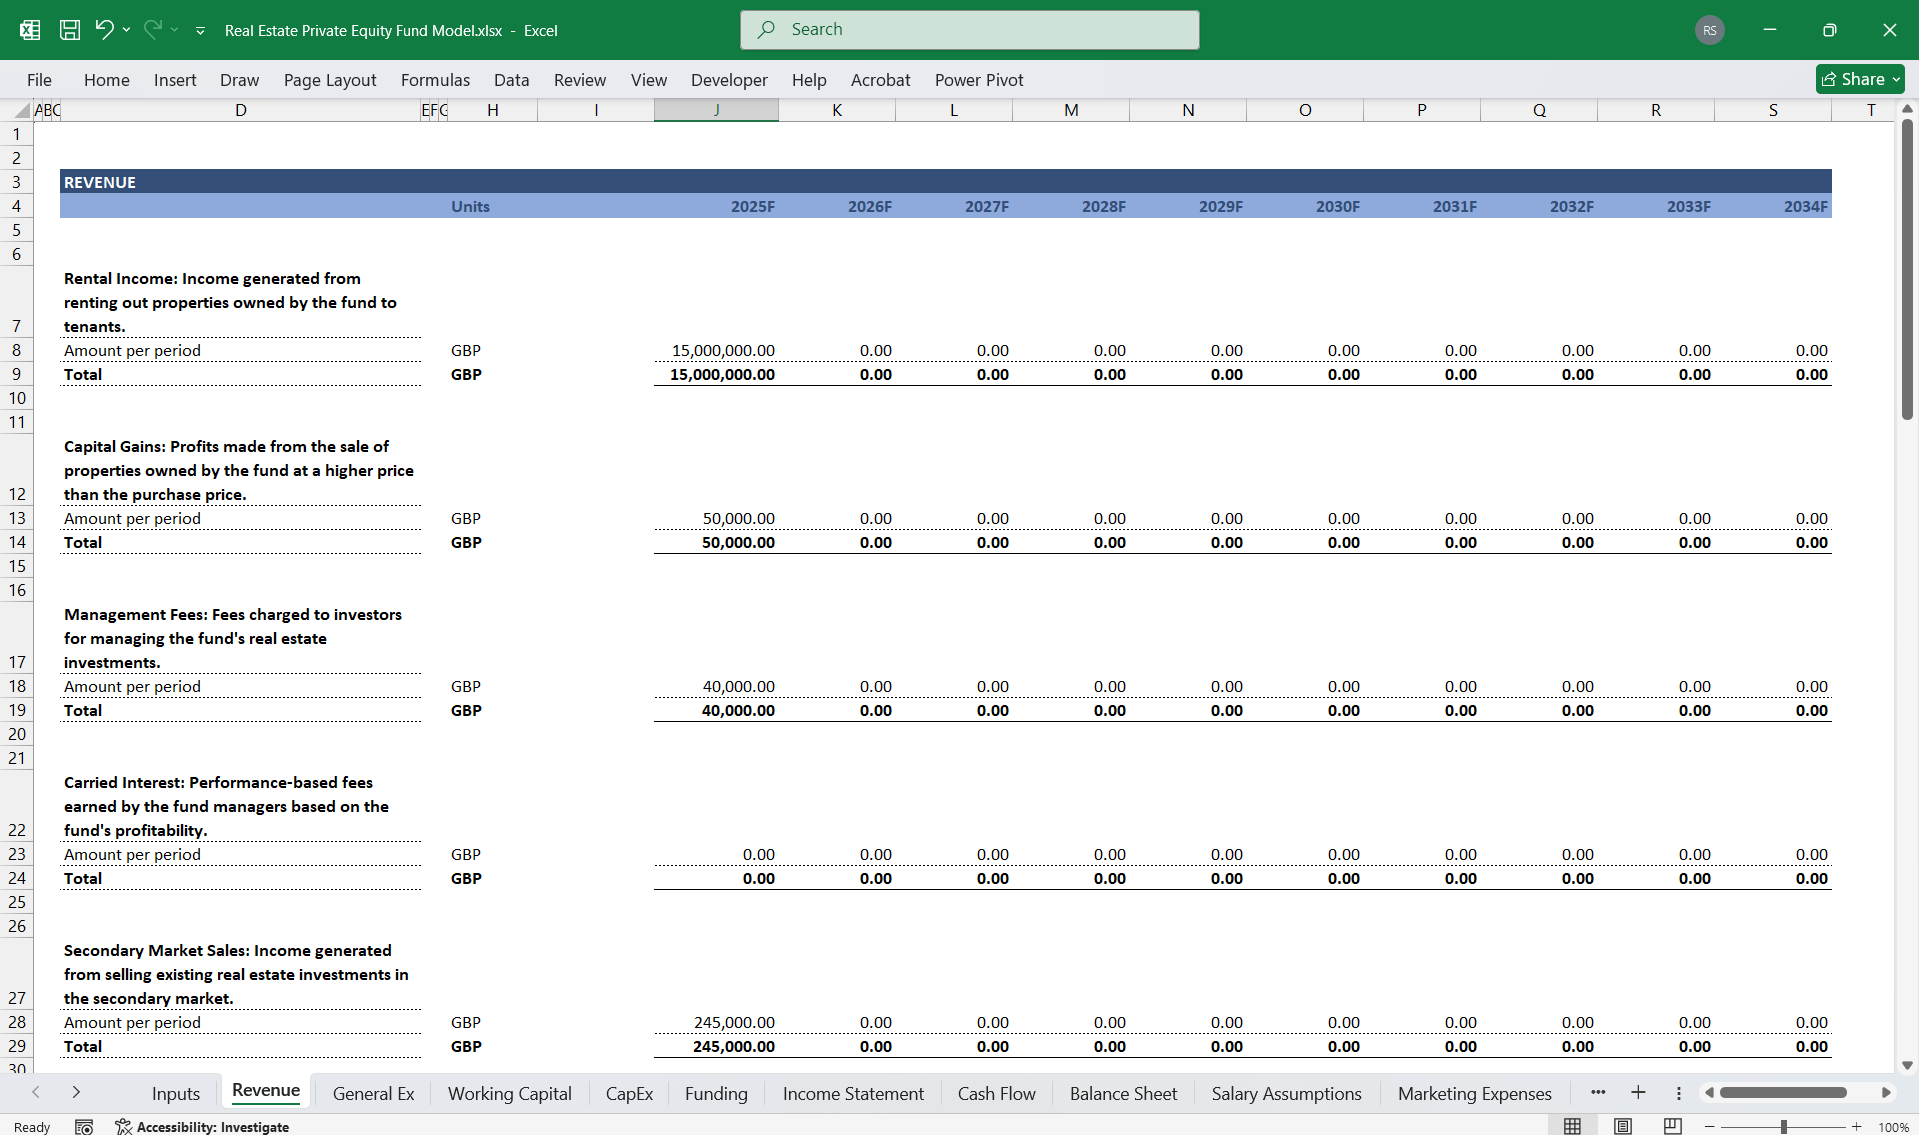
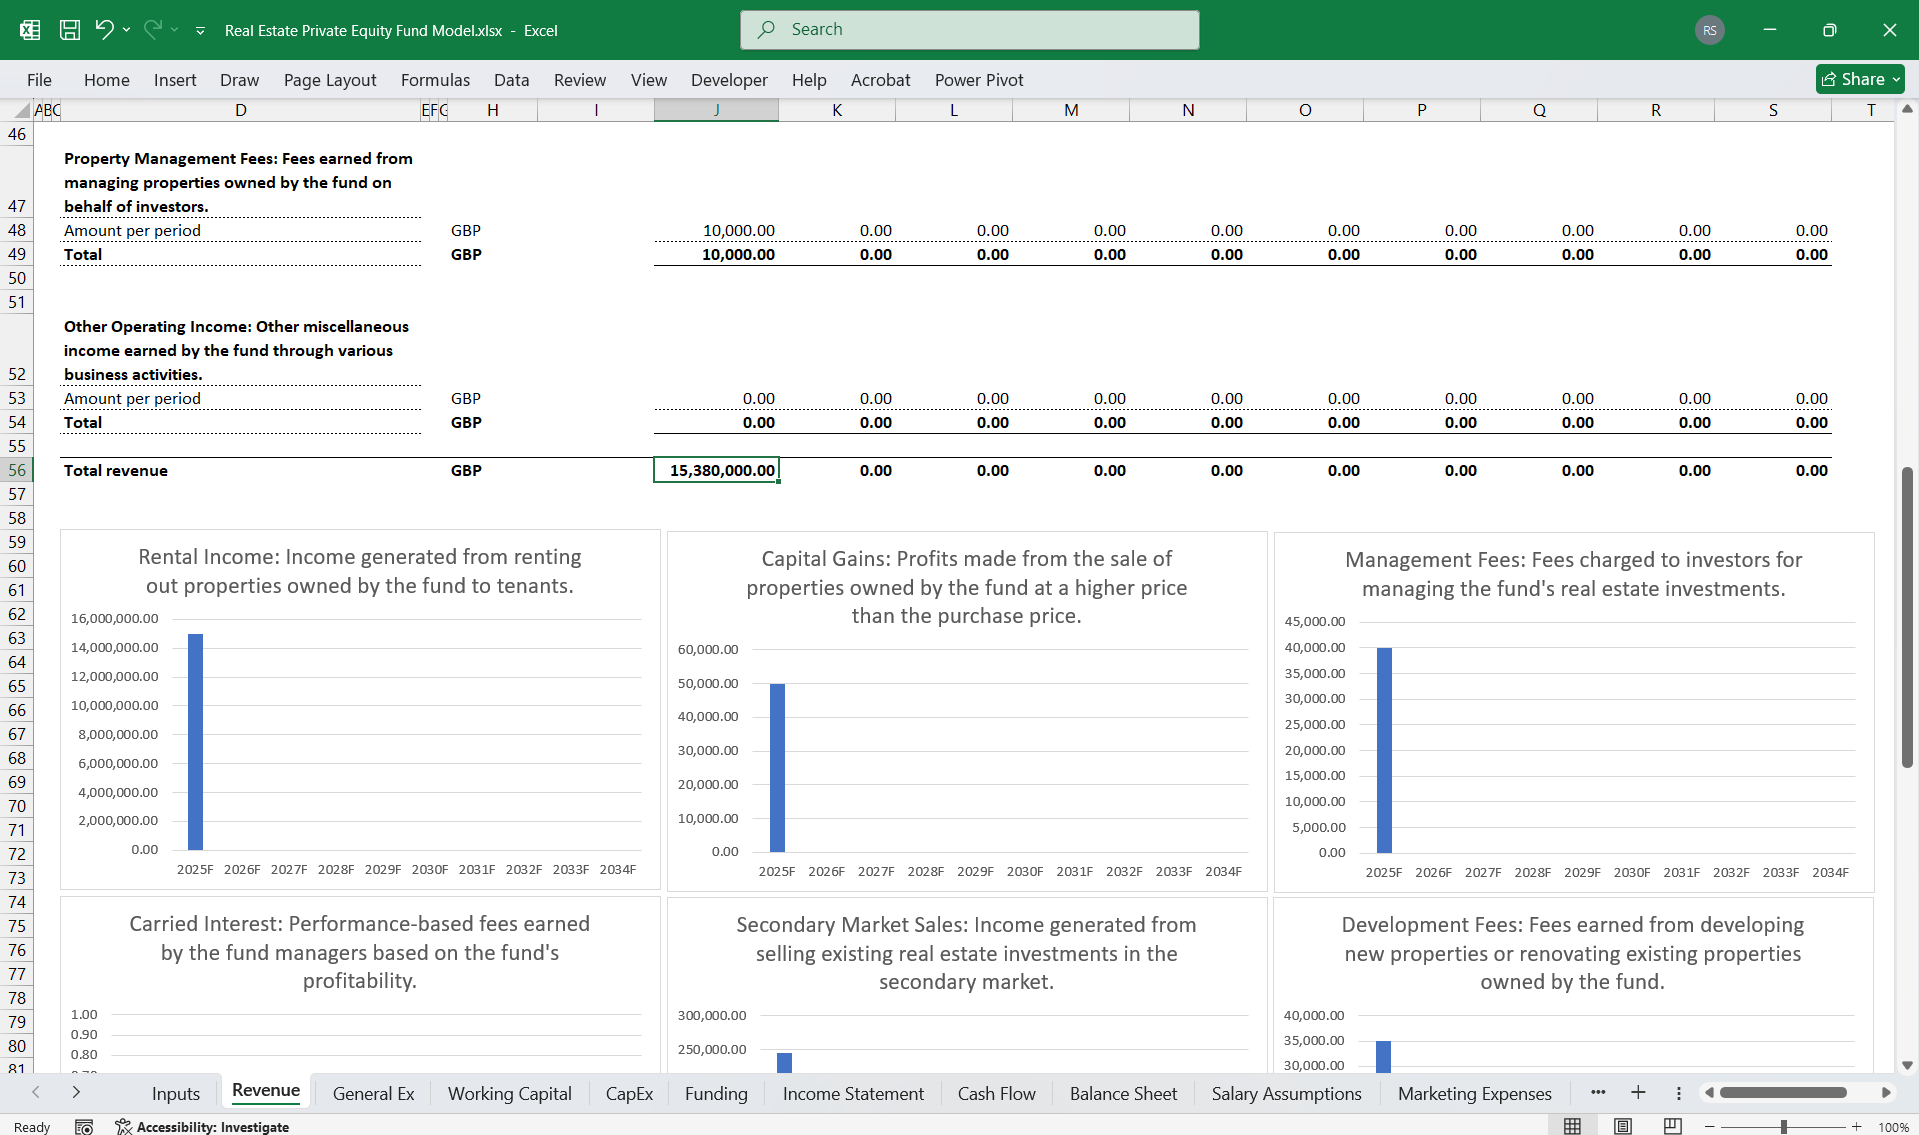
Rental Income: Income generated from renting out properties owned by the fund to tenants.
Capital Gains: Profits made from the sale of properties owned by the fund at a higher price than the purchase price.
Management Fees: Fees charged to investors for managing the fund's real estate investments
Carried Interest: Performance-based fees earned by the fund managers based on the fund's profitability.
Secondary Market Sales: Income generated from selling existing real estate investments in the secondary market.
Development Fees: Fees earned from developing new properties or renovating existing properties owned by the fund.
Loan Interest: Income earned from providing loans to real estate developers or borrowers.
Dividend Income: Income earned from dividends paid by real estate investment trusts (REITs) or other real estate-related investments.
Property Management Fees: Fees earned from managing properties owned by the fund on behalf of investors.
Other Operating Income: Other miscellaneous income earned by the fund through various business activities.
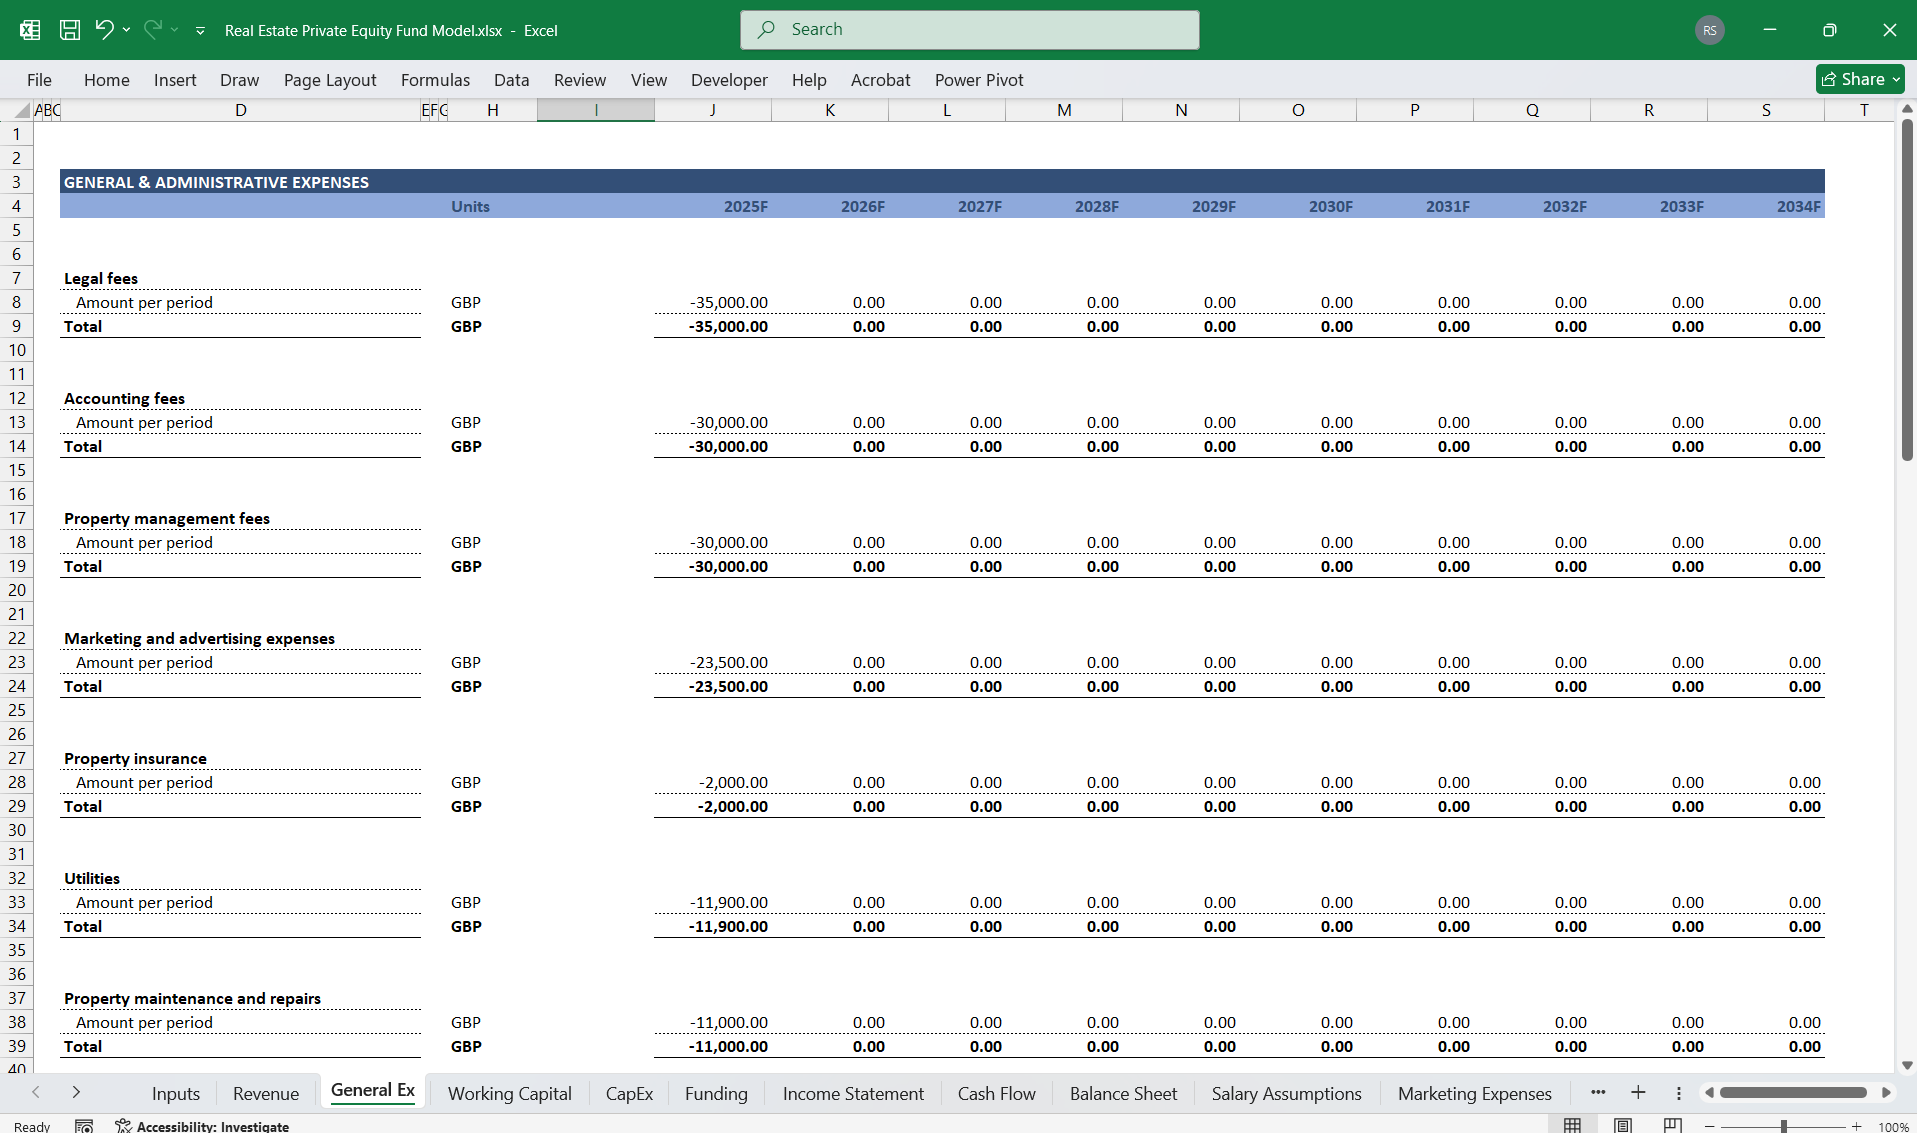
Selling and general expense
Legal fees
Accounting fees
Property management fees
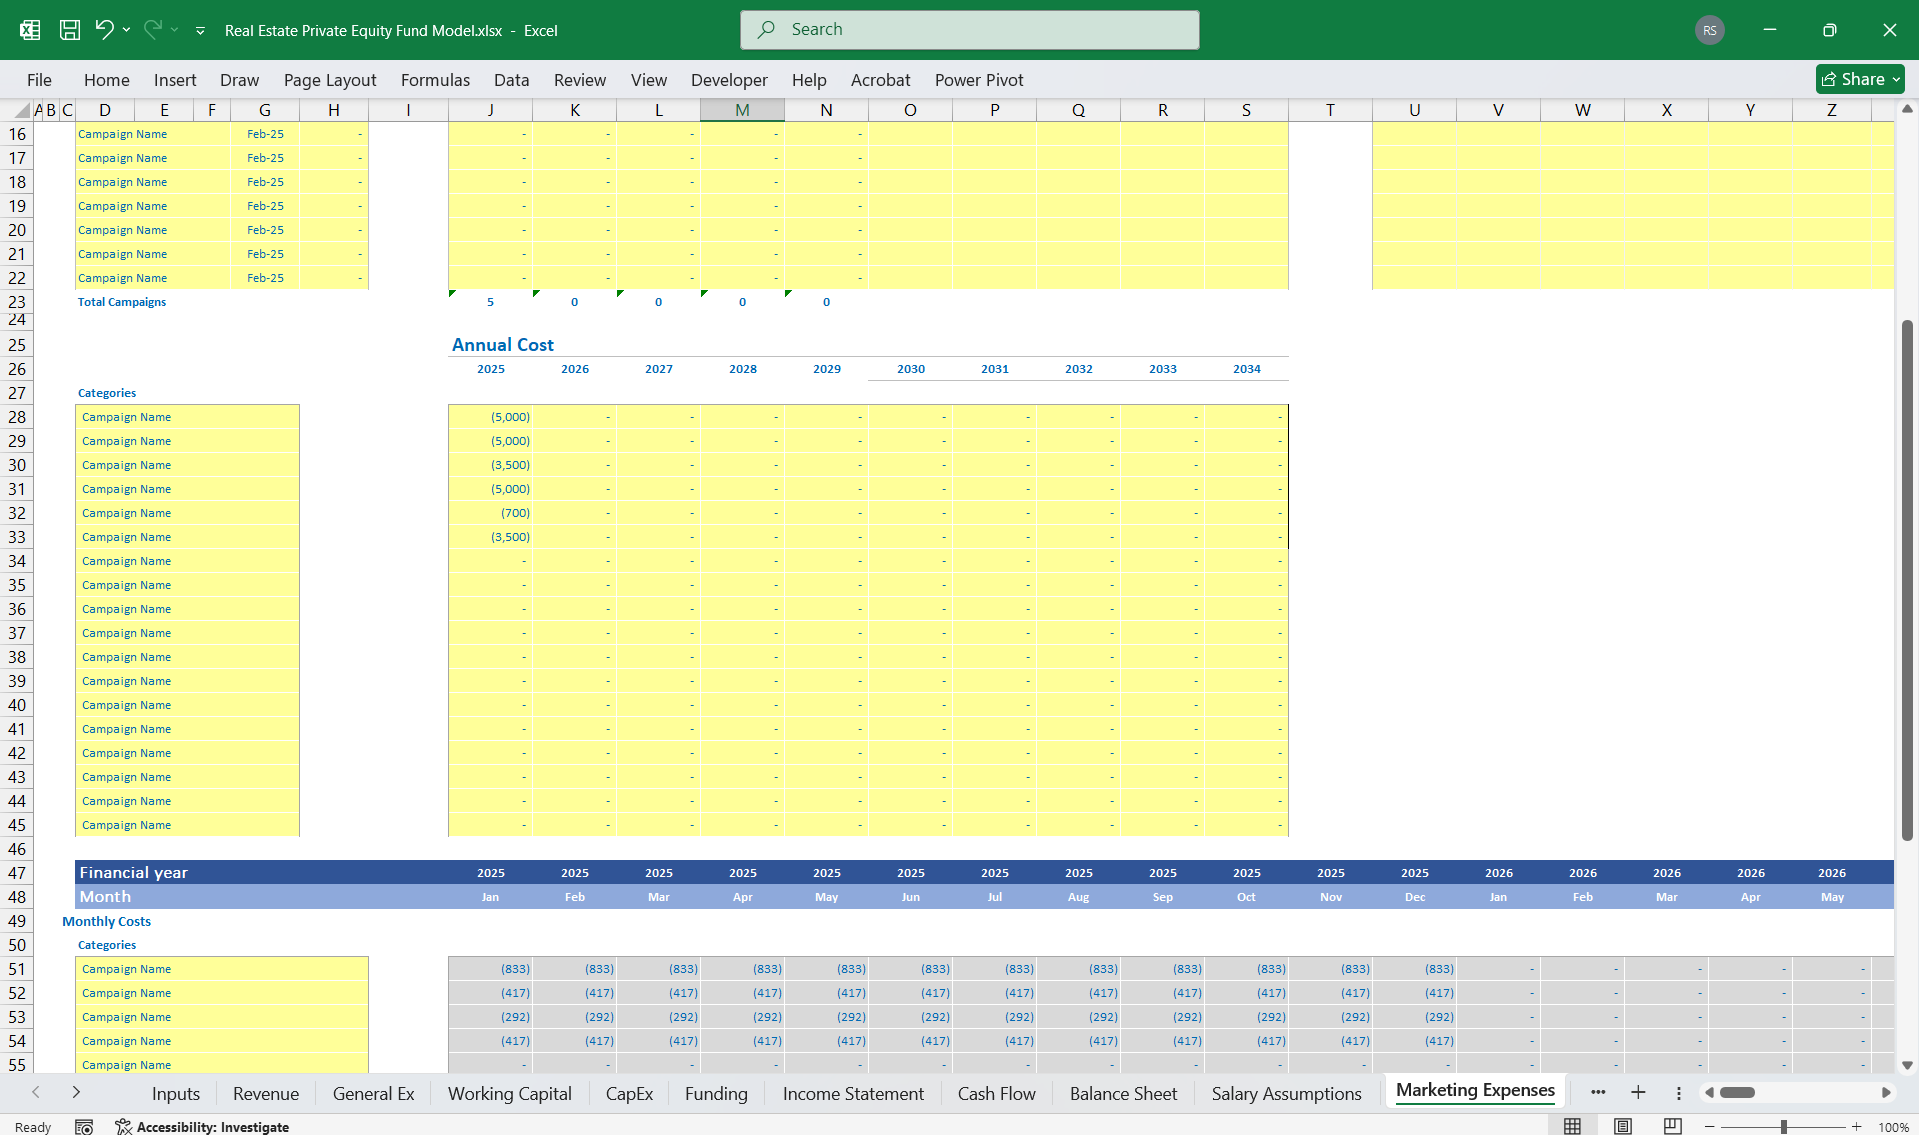
Marketing and advertising expenses
Property insurance
Utilities
Property maintenance and repairs
Property taxes
Licensing and permit fees
Technology expenses
Travel and entertainment expenses
Employee salaries and benefits
Investor relations expenses
Office rent and equipment costs
Insurance premiums
Loan servicing fees
Professional consulting fees (e.g. financial advisors, tax advisors)
Contingency funds
Miscellaneous expenses (e.g. office supplies, postage)
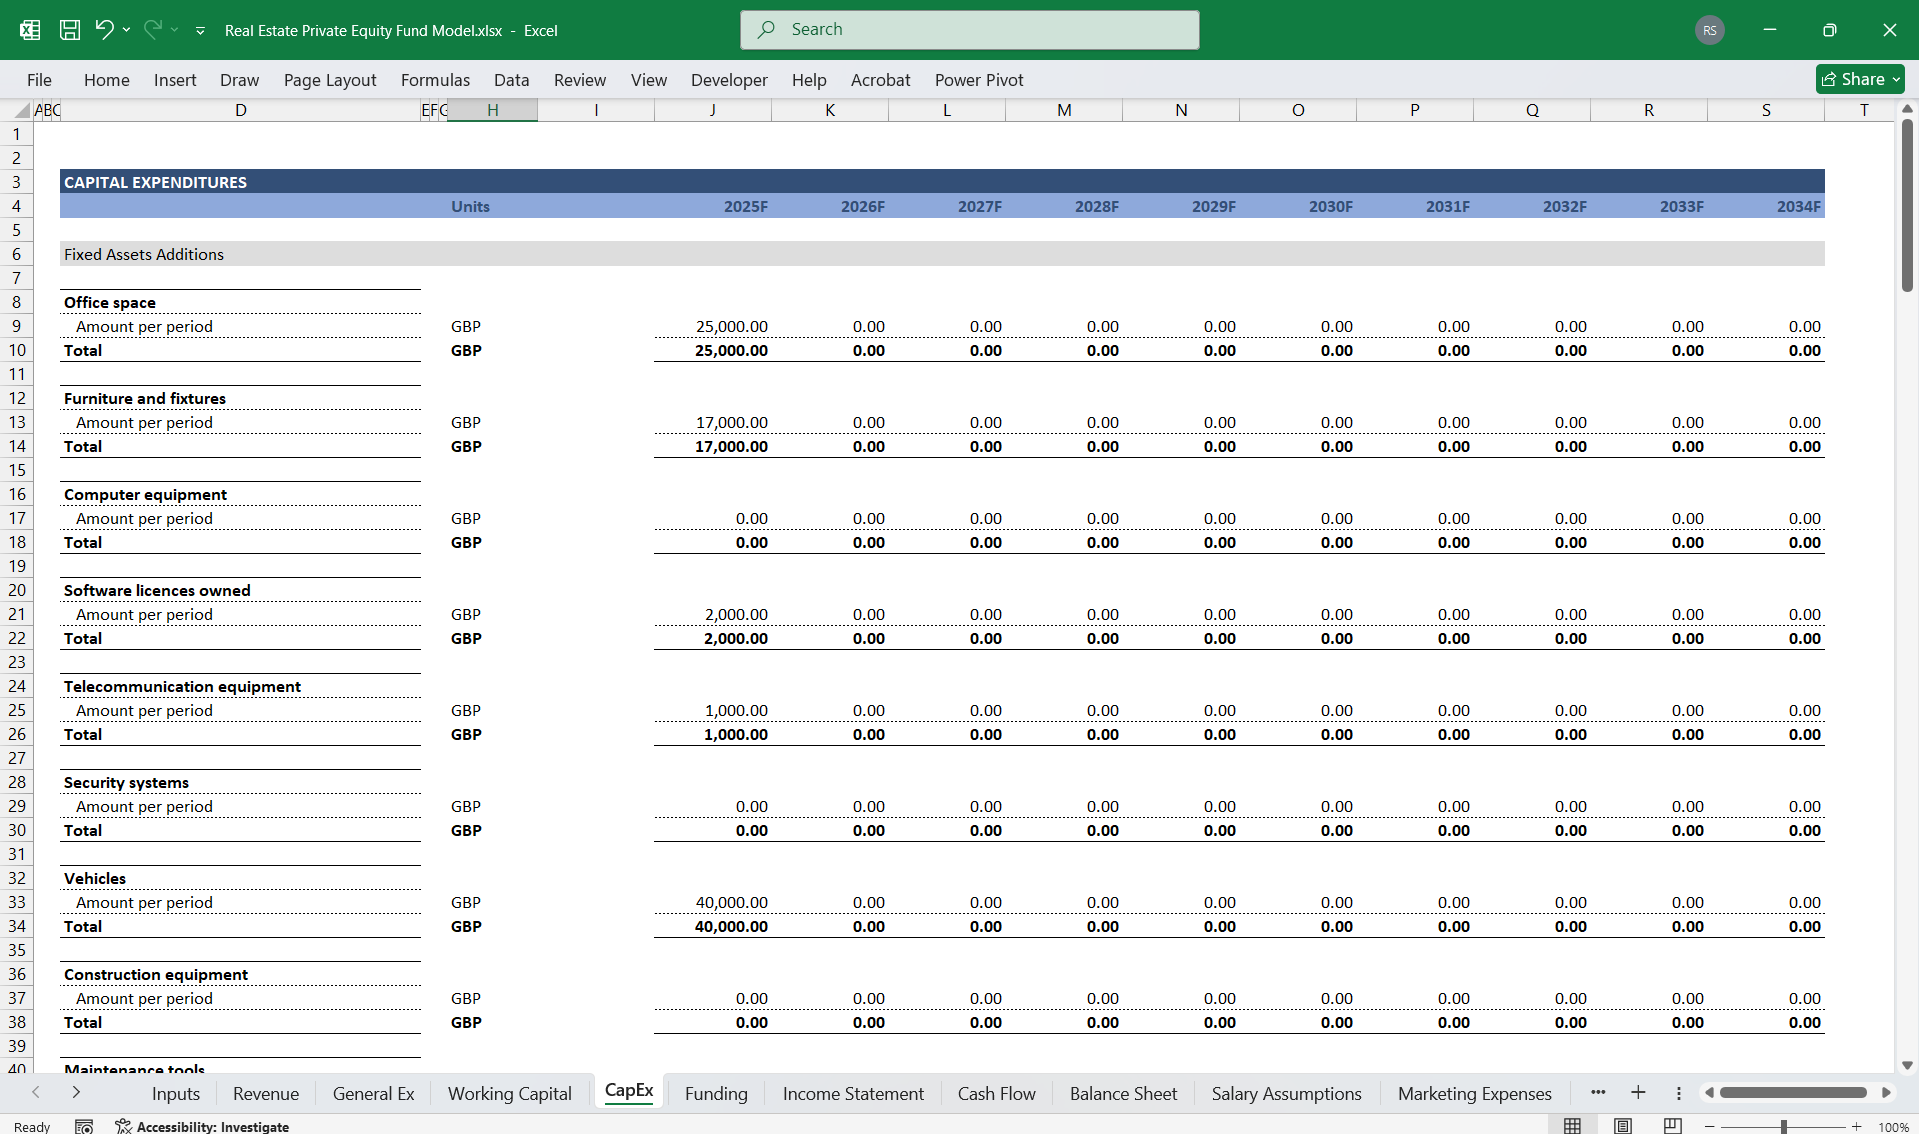
Fixed Assets Depreciation
Office space
Furniture and fixtures
Computer equipment
Software licences owned
Telecommunication equipment
Security systems
Vehicles
Construction Equipment
Maintenance tools
Land holdings
Commercial real estate properties
Residential real estate properties
Development projects
Inventory of building materials
Leases and rental agreements.
Intended Users
This model is ideal for:
Private Equity Fund Managers: To structure and evaluate fund performance and ensure adherence to LP agreements.
Financial Analysts and Advisors: For conducting diligence and presenting analyses to potential investors.
Institutional and Retail Investors: To understand expected returns and risk under different scenarios.
Corporate Development Teams: Assisting GPs and management teams in tracking portfolio company financials and aligning strategies.
The 10-Year 3-Statement Private Equity Fund Financial Model bridges fund-level strategic planning with granular portfolio-level details, delivering clarity, accuracy, and actionable insights for all stakeholders.
This Best Practice includes
1 Excel Financial Model
Further information
Provides thorough oversight, tracking, and reporting of Private Equity Fund finances, including updates on budget utilisation and projections.
