

Originally published: 10/03/2025 09:12
Last version published: 12/03/2025 09:36
Publication number: ELQ-10906-2
View all versions & Certificate
Last version published: 12/03/2025 09:36
Publication number: ELQ-10906-2
View all versions & Certificate

SMA Indicator Google Sheets Template – Technical Analysis
Get SMA Indicator in Google Sheets for stock analysis.
Description
In this article, we will be covering the following.
How to calculate Moving Averages?
Moving Averages is one of the most used technical indicators. It is a simple concept, easy to understand and interpret. It is basically a smoothing device.
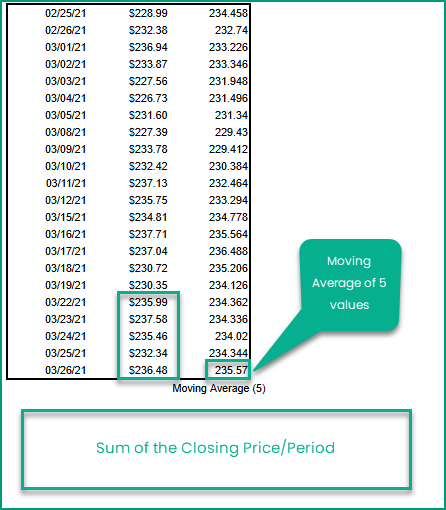
Let’s take a simple example where we have closing price of a stock for each trading day.
Moving Average explanation
To calculate the moving average of 5 periods, for March 26th, we average the price of 5 days (Mar 22nd to 26th).
To calculate the moving average of 5 periods, for March 25th, we average the price of 5 days (Mar 19th to 25th).
A couple of parameters in this calculation are
1) Length of the moving average – how many periods to use for calculating average. In the example above, we used 5.
Common moving average lengths are 10, 20, 50, 100 and 200.
If the length is greater, the smoothing effect is greater and the indicator is less impacted by sudden price fluctuations.
2) Source – what value are we averaging. In the example we used the closing price of the stock.
Though Closing price is the most used for calculating simple moving average, you can also use High, Low, Open, and Volume as well.
Trading Signals
Commonly used trading signals using the Moving average method are listed below.
How to calculate Moving Averages in Google Sheets?
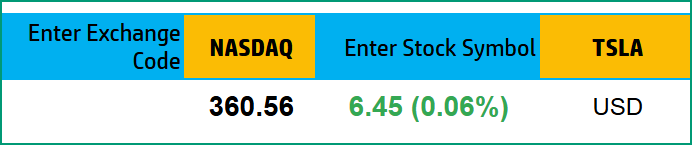
Type in a stock exchange code (like NASDAQ) and the stock symbol (example: “TSLA” for TESLA) as shown on the top left.
Chart Header for SMA
Kindly ensure to enter the correct exchange code and stock symbol for Google sheets to recognize the same.
Period
The template can pull up to 1 year of price history by default. You can choose how much history to display on the chart easily using the check box.
The options are 5 Days, 1 Month, 3 Months, 6 Months, 1 Year, Month Till Date, and Year Till Date.
Interval
The template allows price history at 2 different intervals: Daily and Weekly.
Input Parameters
SMA Input parameters
Signals
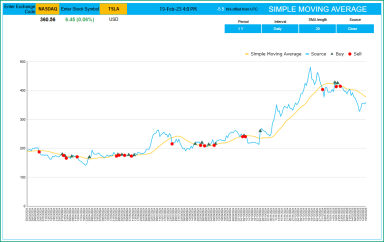
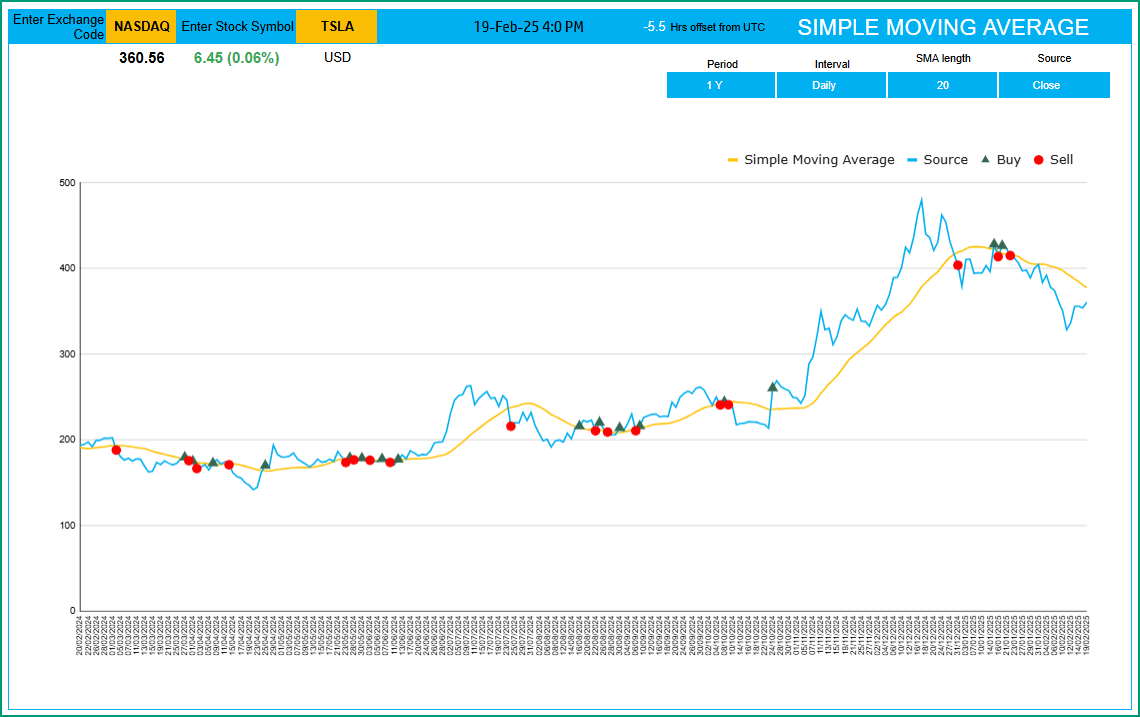
The template shows two types of signals (Buy, Sell) on the chart.
SMA Indicator with Trading SignalsThe following rule generates the signals.
On the top right you can see the maximum of the last trade time of these currencies.
SMA Timezone
The default time that Googlefinance functions provides is Timezone present in the Google Sheets settings.
In this article, we will be covering the following.
- Introduction to Technical Indicators
- Simple Moving Average – Concept
- Template and its Features
How to calculate Moving Averages?
Moving Averages is one of the most used technical indicators. It is a simple concept, easy to understand and interpret. It is basically a smoothing device.
Let’s take a simple example where we have closing price of a stock for each trading day.
Moving Average explanation
To calculate the moving average of 5 periods, for March 26th, we average the price of 5 days (Mar 22nd to 26th).
To calculate the moving average of 5 periods, for March 25th, we average the price of 5 days (Mar 19th to 25th).
A couple of parameters in this calculation are
1) Length of the moving average – how many periods to use for calculating average. In the example above, we used 5.
Common moving average lengths are 10, 20, 50, 100 and 200.
If the length is greater, the smoothing effect is greater and the indicator is less impacted by sudden price fluctuations.
2) Source – what value are we averaging. In the example we used the closing price of the stock.
Though Closing price is the most used for calculating simple moving average, you can also use High, Low, Open, and Volume as well.
Trading Signals
Commonly used trading signals using the Moving average method are listed below.
Once again there is no golden rule or a rule that works all the time. Otherwise, everyone will use that rule and make a lot of money easily.
- BUY – If the closing price moves from below the Moving Average line to above the Moving average line, then a Buy signal is generated.
- SELL – If the closing price moves from above the Moving Average line to below the Moving average line, then a Sell signal is generated.
How to calculate Moving Averages in Google Sheets?
Type in a stock exchange code (like NASDAQ) and the stock symbol (example: “TSLA” for TESLA) as shown on the top left.
Chart Header for SMA
Kindly ensure to enter the correct exchange code and stock symbol for Google sheets to recognize the same.
Period
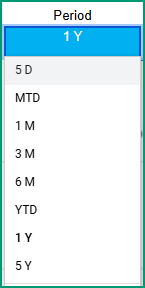
The template can pull up to 1 year of price history by default. You can choose how much history to display on the chart easily using the check box.
The options are 5 Days, 1 Month, 3 Months, 6 Months, 1 Year, Month Till Date, and Year Till Date.
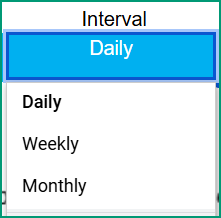
Interval
The template allows price history at 2 different intervals: Daily and Weekly.
Input Parameters
SMA Input parameters
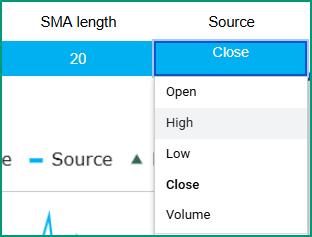
- Source: Closing price is the one that is used for calculations typically. However, you can choose from Open, High, Low, Close or Volume.
- Length: You can type in a length in periods. The commonly used is 14.
Signals
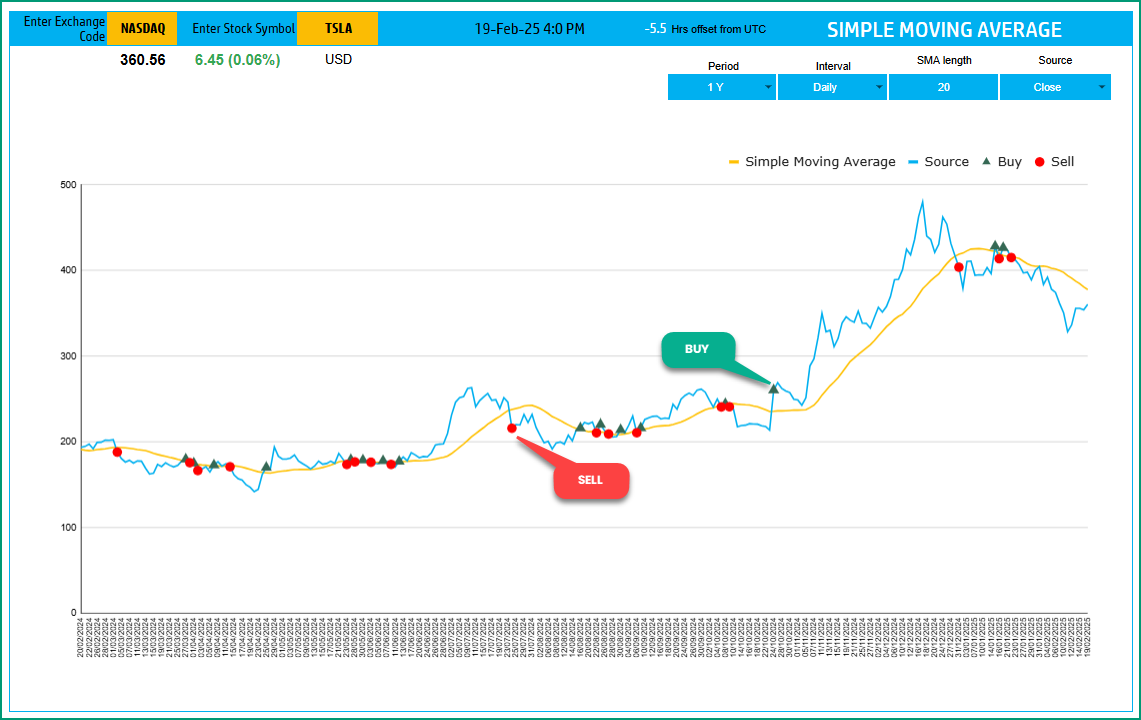
The template shows two types of signals (Buy, Sell) on the chart.
SMA Indicator with Trading SignalsThe following rule generates the signals.
- Buy If the value crosses over from below the Moving Average to above the Moving Average
- Sell If the value crosses over from above the Moving Average to below the Moving Average
On the top right you can see the maximum of the last trade time of these currencies.
SMA Timezone
The default time that Googlefinance functions provides is Timezone present in the Google Sheets settings.
You can modify the timezone in settings if you need the time in a different time zone.
This Best Practice includes
1 PDF File with link to download your copy of the Google Sheet Template
