Expense Tracking Dashboard | Excel Budget Monitoring & Cost Analysis Template
Originally published: 07/05/2026 16:02
Last version published: 16/06/2026 14:42
Publication number: ELQ-16030-2
View all versions & Certificate
certified

Expense Tracking Dashboard | Excel Budget Monitoring & Cost Analysis Template

Interactive Excel dashboard designed to track expenses, monitor budgets, analyze spending trends, and evaluate financial performance through dynamic charts and

Description
Expenses Tracking Dashboard | Interactive Budget Tracker | Automated KPI Charts & Refresh Button

Product Description:
You can track of your expenses with this fully interactive Excel Expense Dashboard which is designed for individuals and small business owners who want to control their spending and make better financial decisions.

Who Should Use This Dashboard?
  • Freelancers who want to track their cost of doing business
  • Small business owners wishing to track their project based spending
  • Budget-conscious individuals managing family expenses
  • Entrepreneurs who need smart financial tool

What This Dashboard Includes:
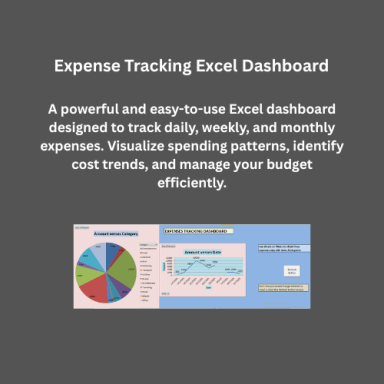
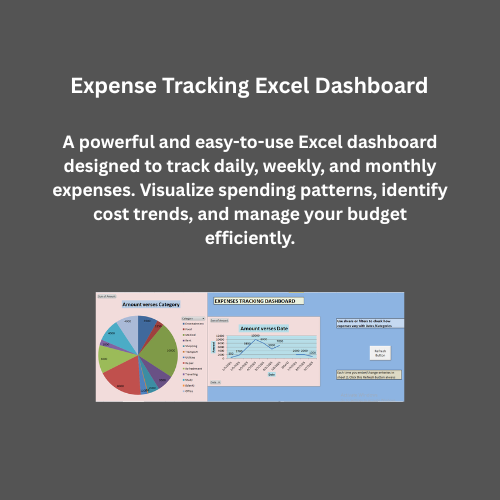
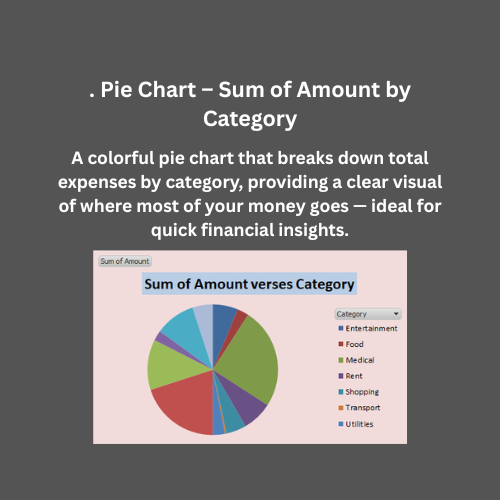
  • Interactive Pie Chart showing category-wise expense visualization
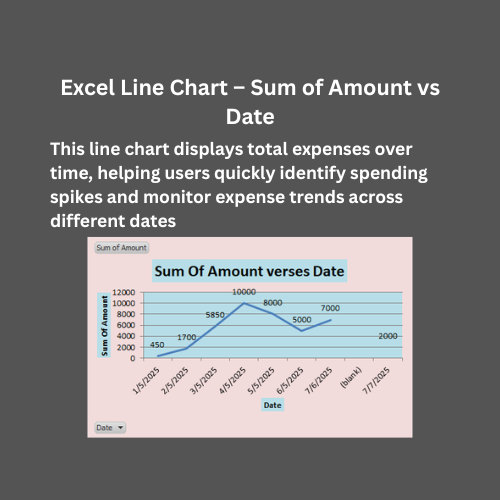
  • Dynamic Line Chart to show expense trends over time
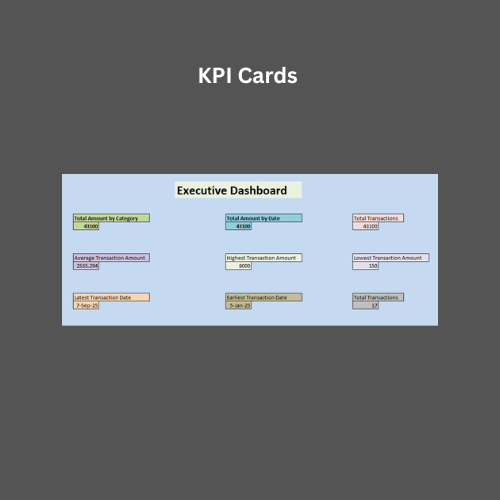
  • Automated KPI Cards showing updated total expense values
  • Refresh Button To update immediately dashboard and KPI Cards after adding data
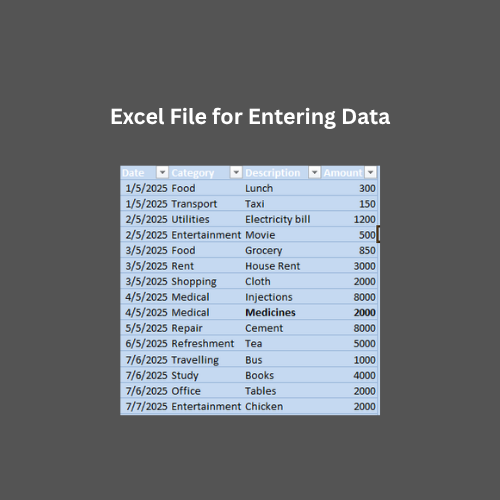
  • Easy to use data entry sheet (no formulas or edits needed)
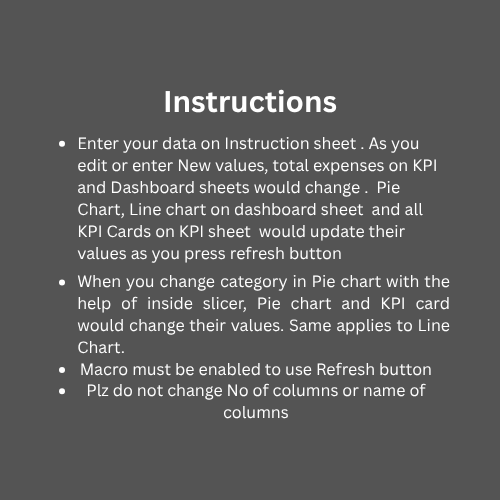
  • Instructions Sheet – simple steps for editing and updating
  • Pre-designed with clean formatting and color-coordinated charts

What will you Gain After Using This Dashboard:
  • A clear overview of your Expense breakdown
  • Immediate insights through interactive dashboards
  • Confidence in making facts based decisions
  • Save time, no need to build anything from scratch
  • A professional tool you can reuse every month or year

How to Use:
  1. Open the Excel file
  2. Enter your own expense data in the “Data Entry” sheet
  3. Click the Refresh Button
  4. Instantly see updated charts and KPIs
No advanced Excel knowledge required.
Works perfectly in Microsoft Excel 2010 or later

This Best Practice includes
1 excel dashboard file (xlmx), instruction set

Acquire business license for $25.00

Add to cart

Add to bookmarks

Discuss

Further information

1. Objectives of This Downloadable Best Practice
Track and monitor business expenses through an interactive Excel dashboard.
Analyze spending trends using dynamic charts and KPI indicators.
Support budget monitoring and financial performance evaluation.
Identify high-expense categories, vendors, or departments for better cost control.
Reduce manual reporting effort through automated calculations and refresh-enabled summaries.
Improve financial decision-making with clear visual reporting and expense analysis.

2. Conditions for Which This Downloadable Best Practice Applies
Small and medium businesses managing expenses in Excel.
Organizations preparing monthly or weekly expense reports.
Finance teams requiring budget tracking and spending analysis.
Consultants, freelancers, and business owners needing a simple financial monitoring tool.
Users looking for an affordable and easy-to-use Excel-based expense management dashboard.

3. Conditions for Which This Downloadable Best Practice Does Not Apply
Large enterprises using ERP or advanced accounting systems.
Businesses requiring real-time cloud-based or multi-user reporting solutions.
Organizations needing automated invoice processing or integrated tax systems.
Users seeking mobile applications or web-based dashboards instead of Excel.
Highly complex financial environments requiring enterprise-level analytics tools.


0.0 / 5 (0 votes)

please wait...