Originally published: 25/01/2017 17:04
Last version published: 31/01/2017 14:22
Publication number: ELQ-27655-2
View all versions & Certificate
Last version published: 31/01/2017 14:22
Publication number: ELQ-27655-2
View all versions & Certificate

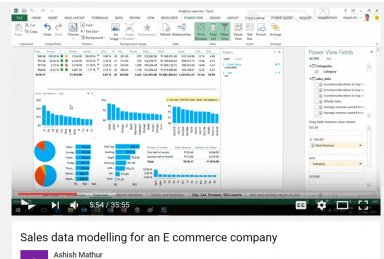
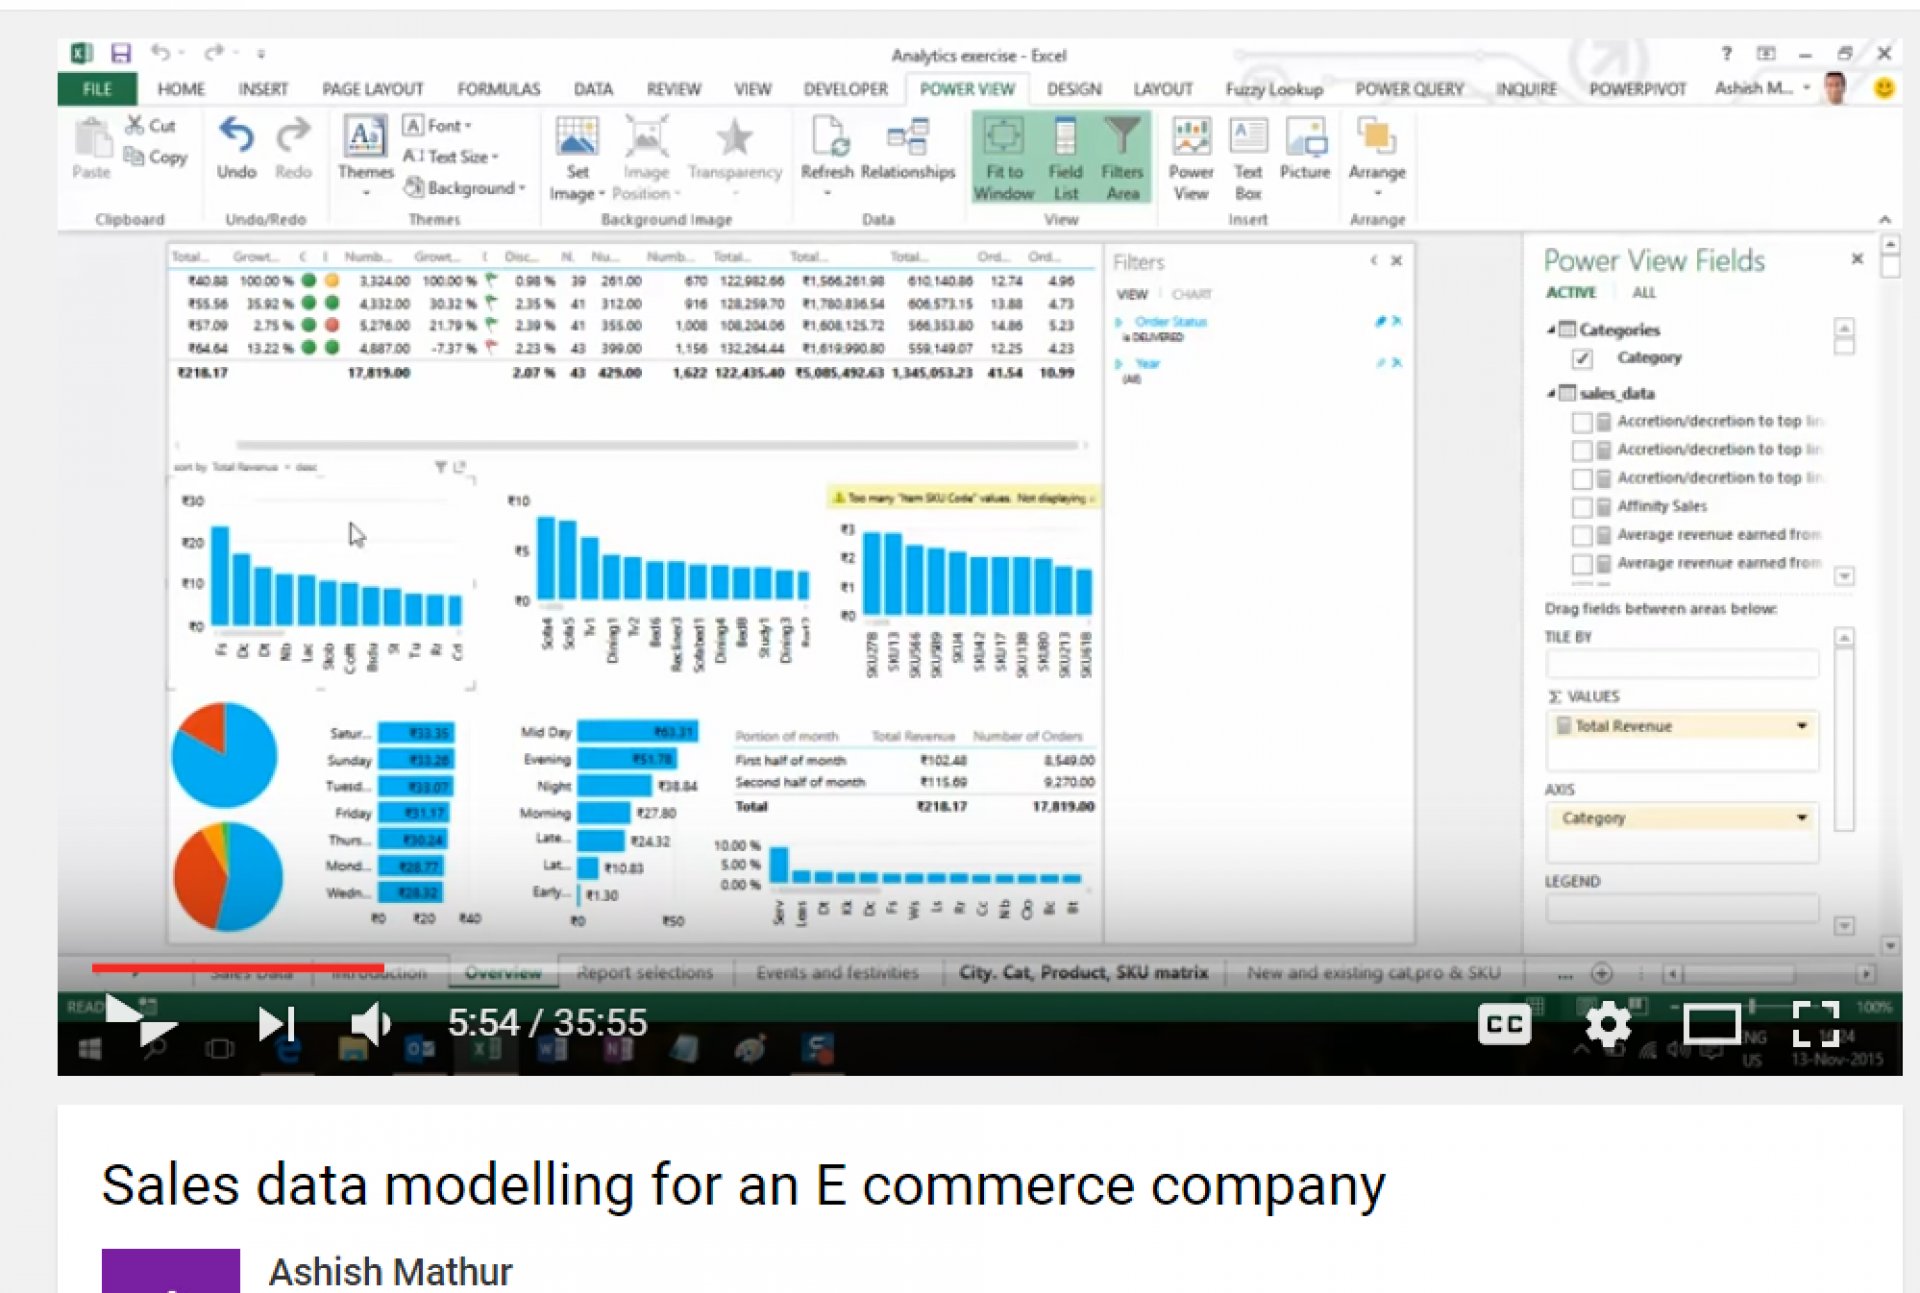
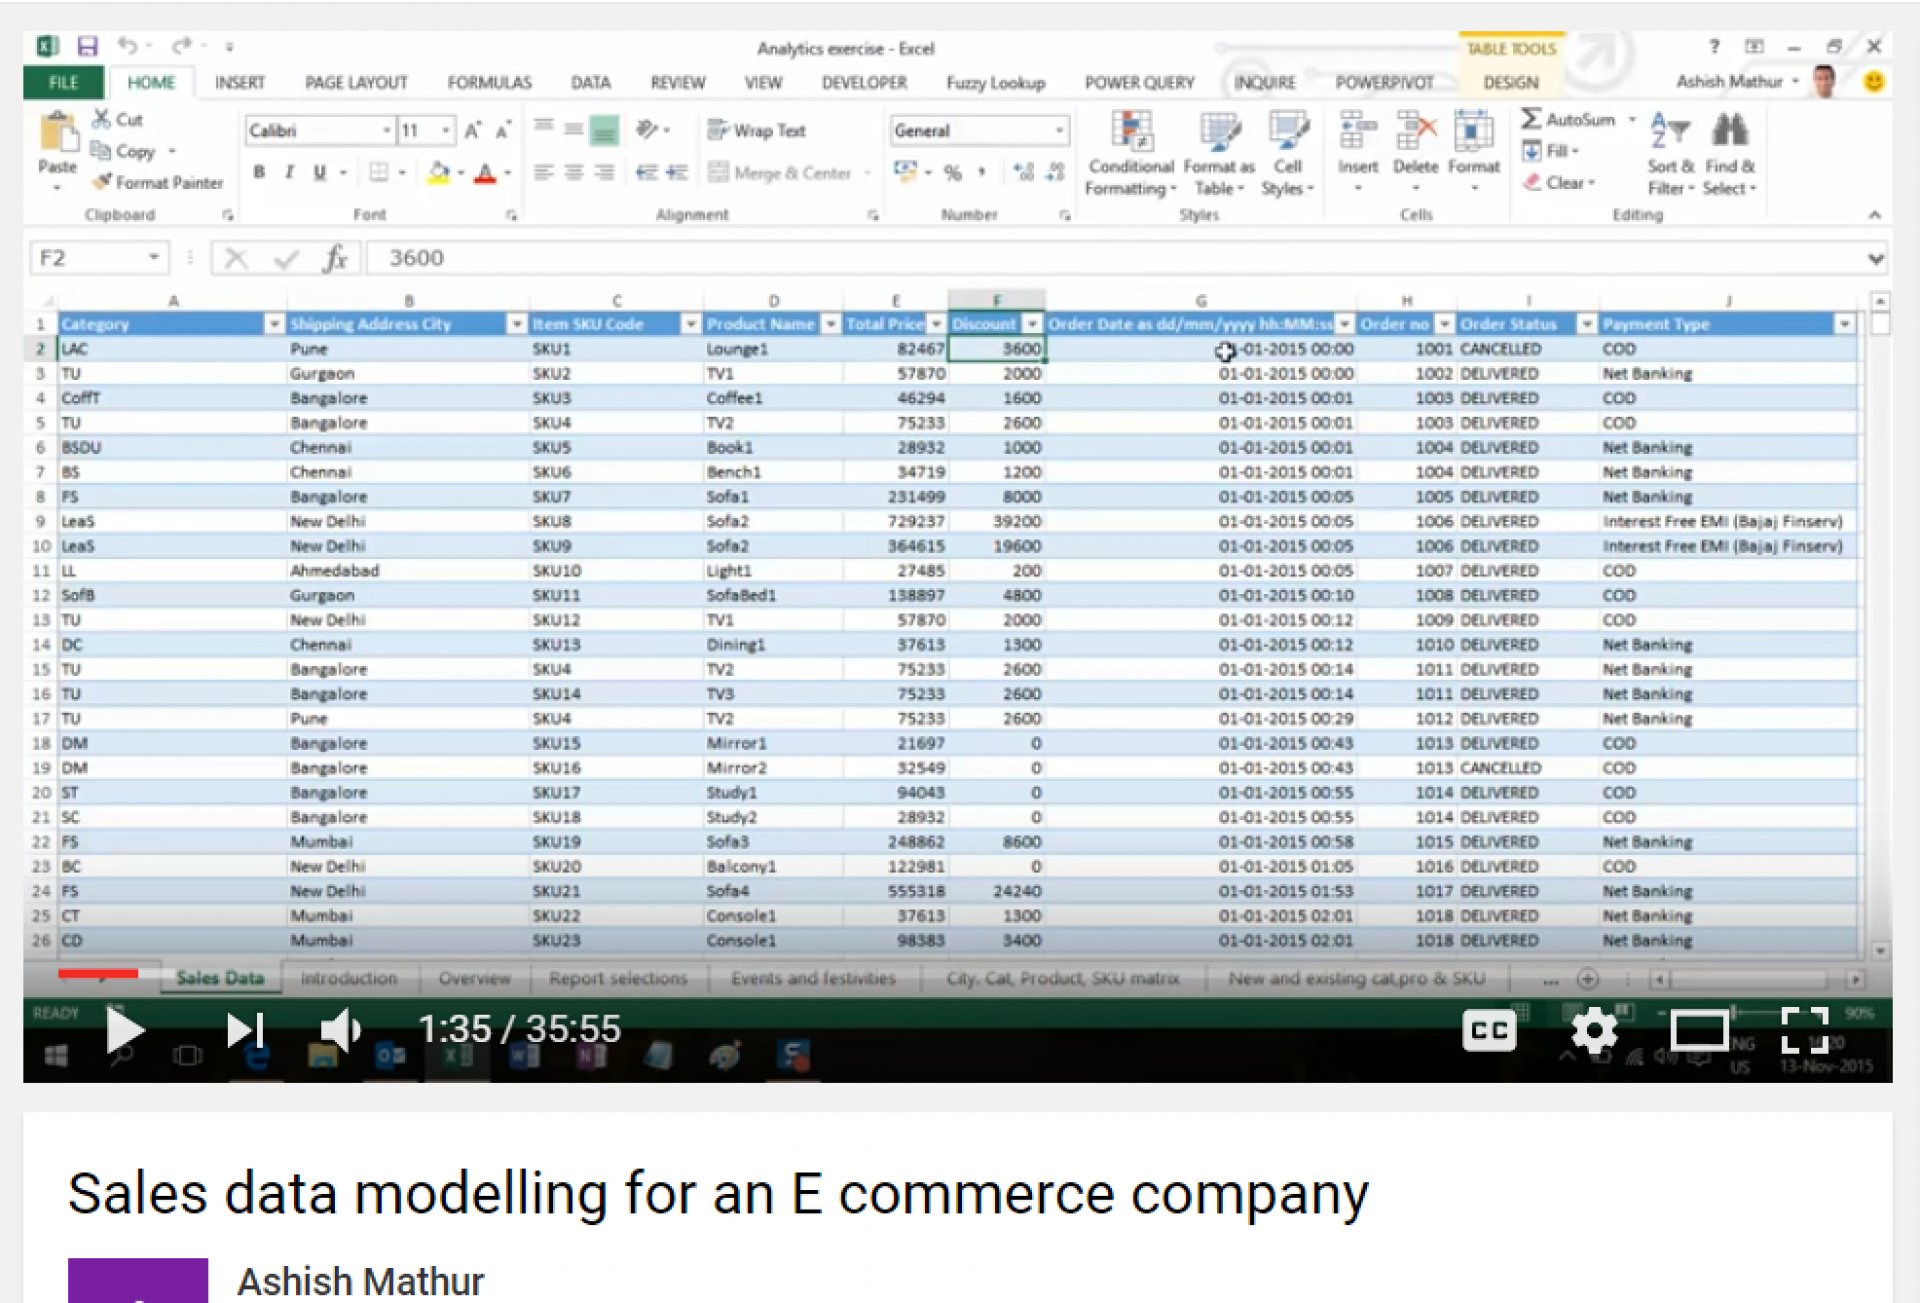
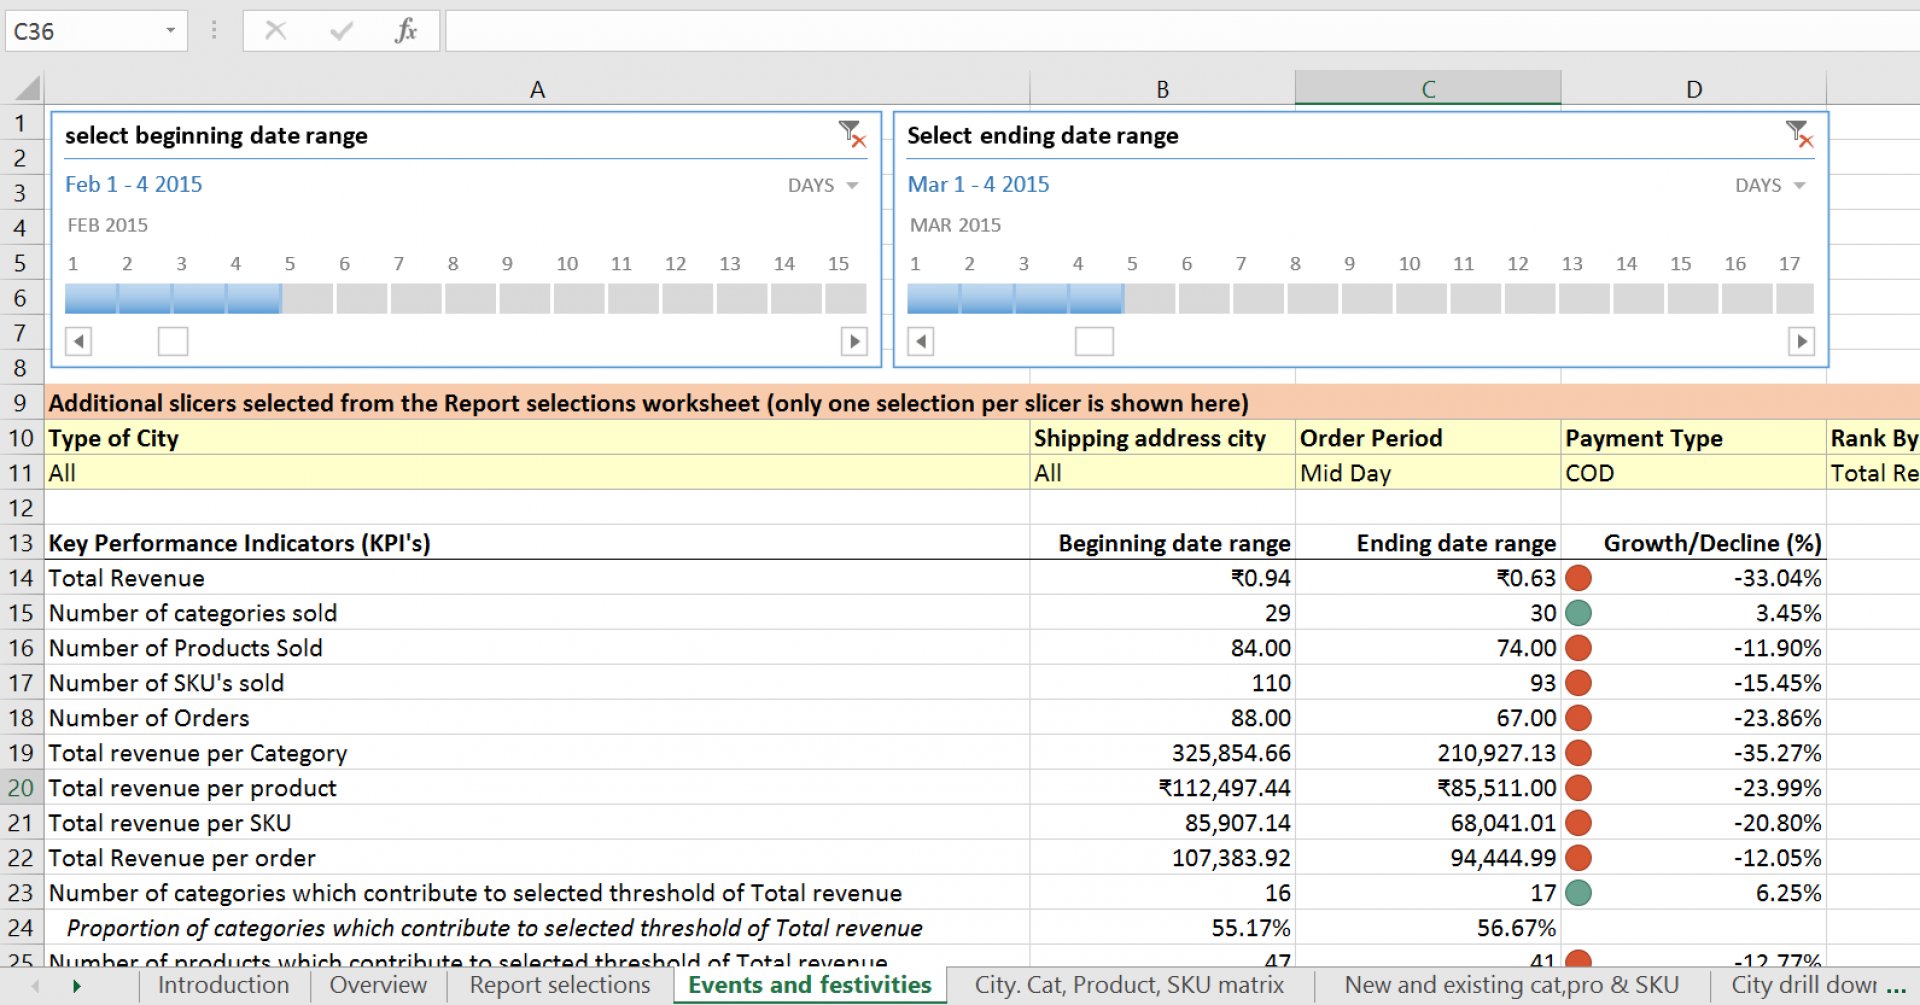
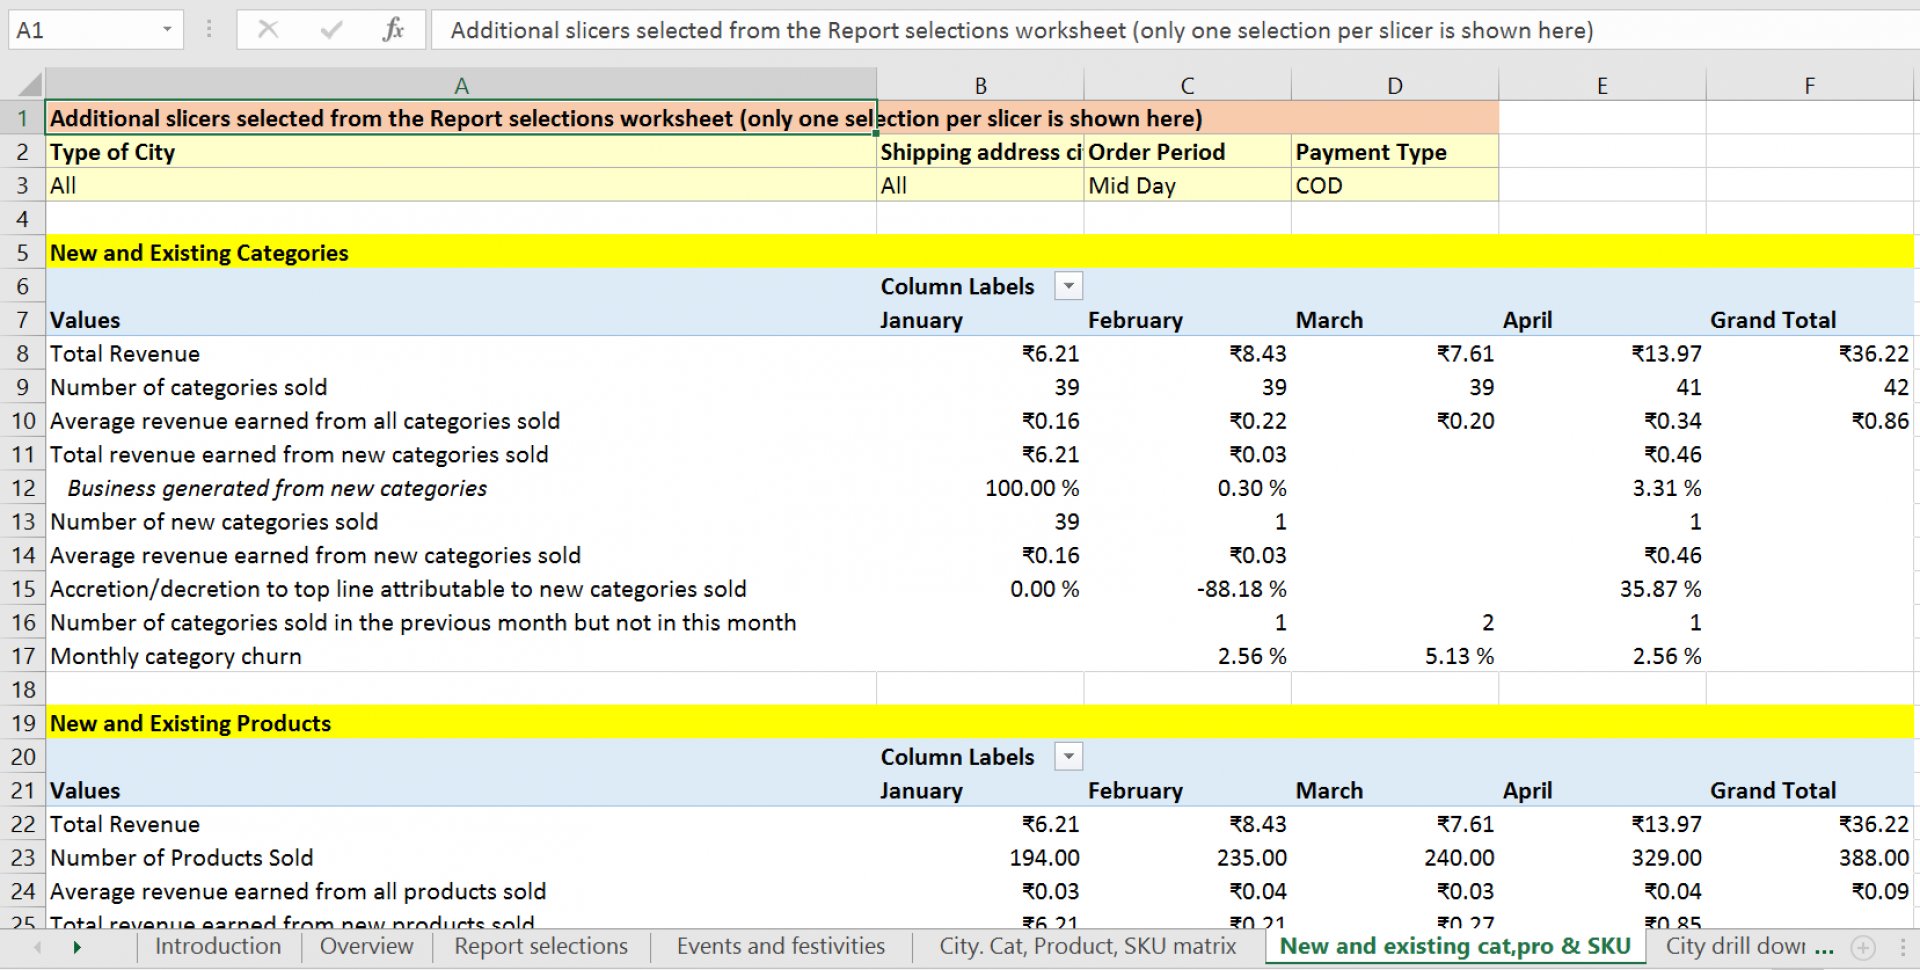
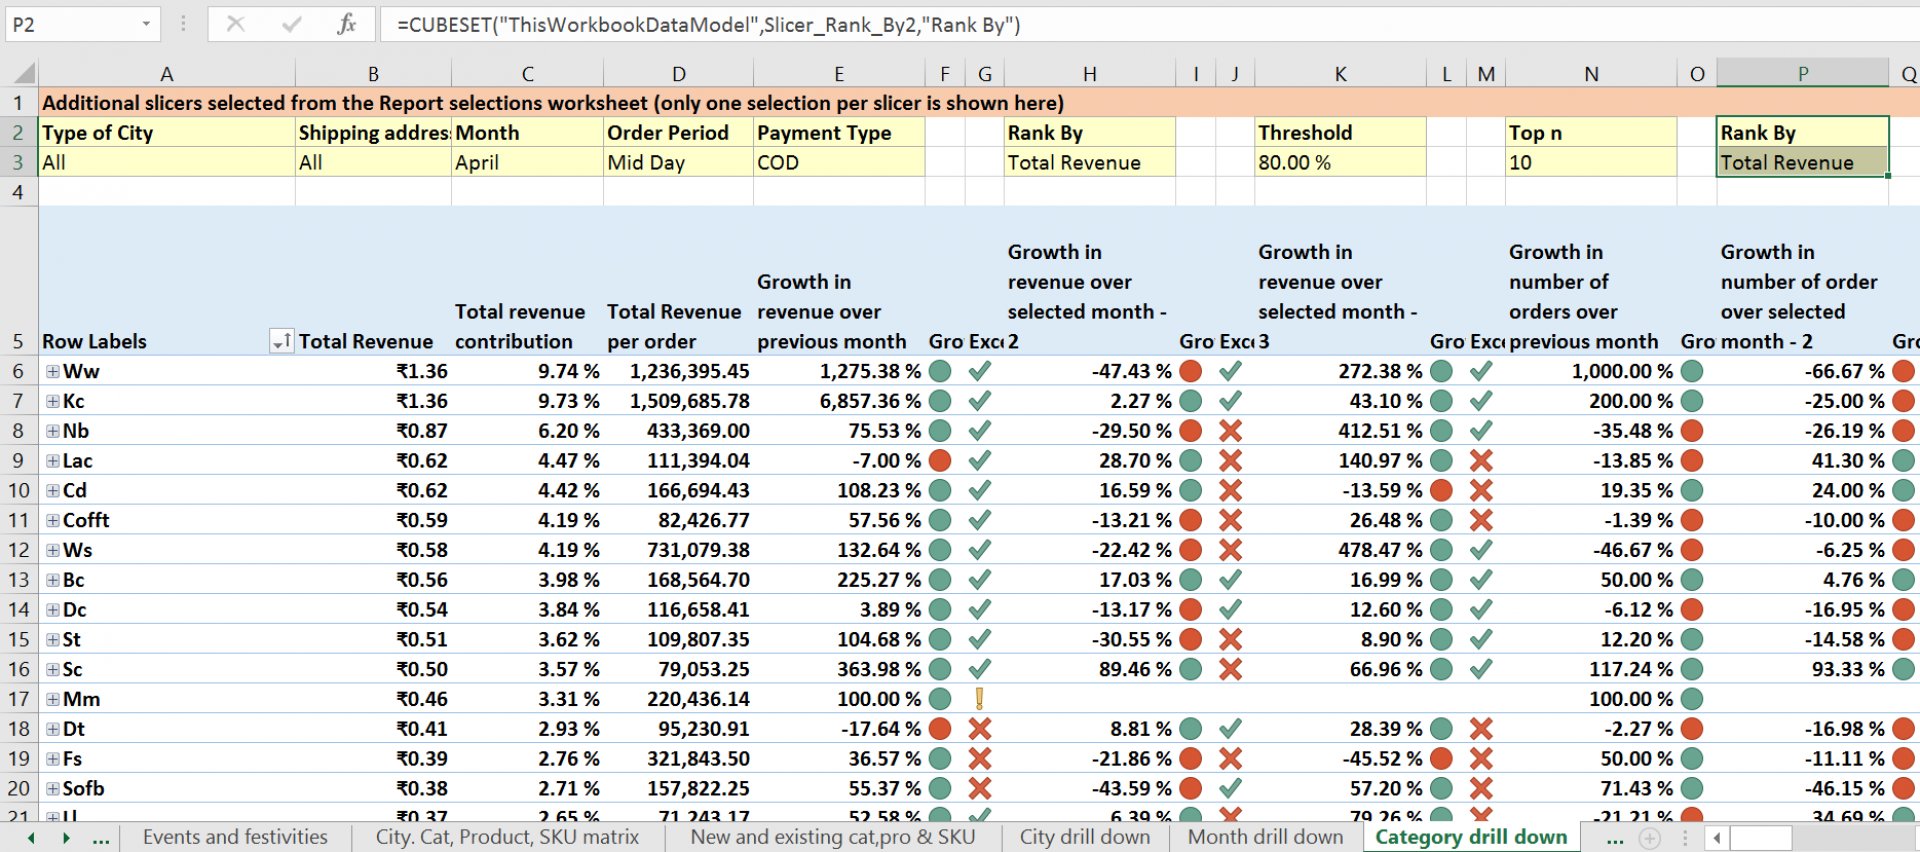
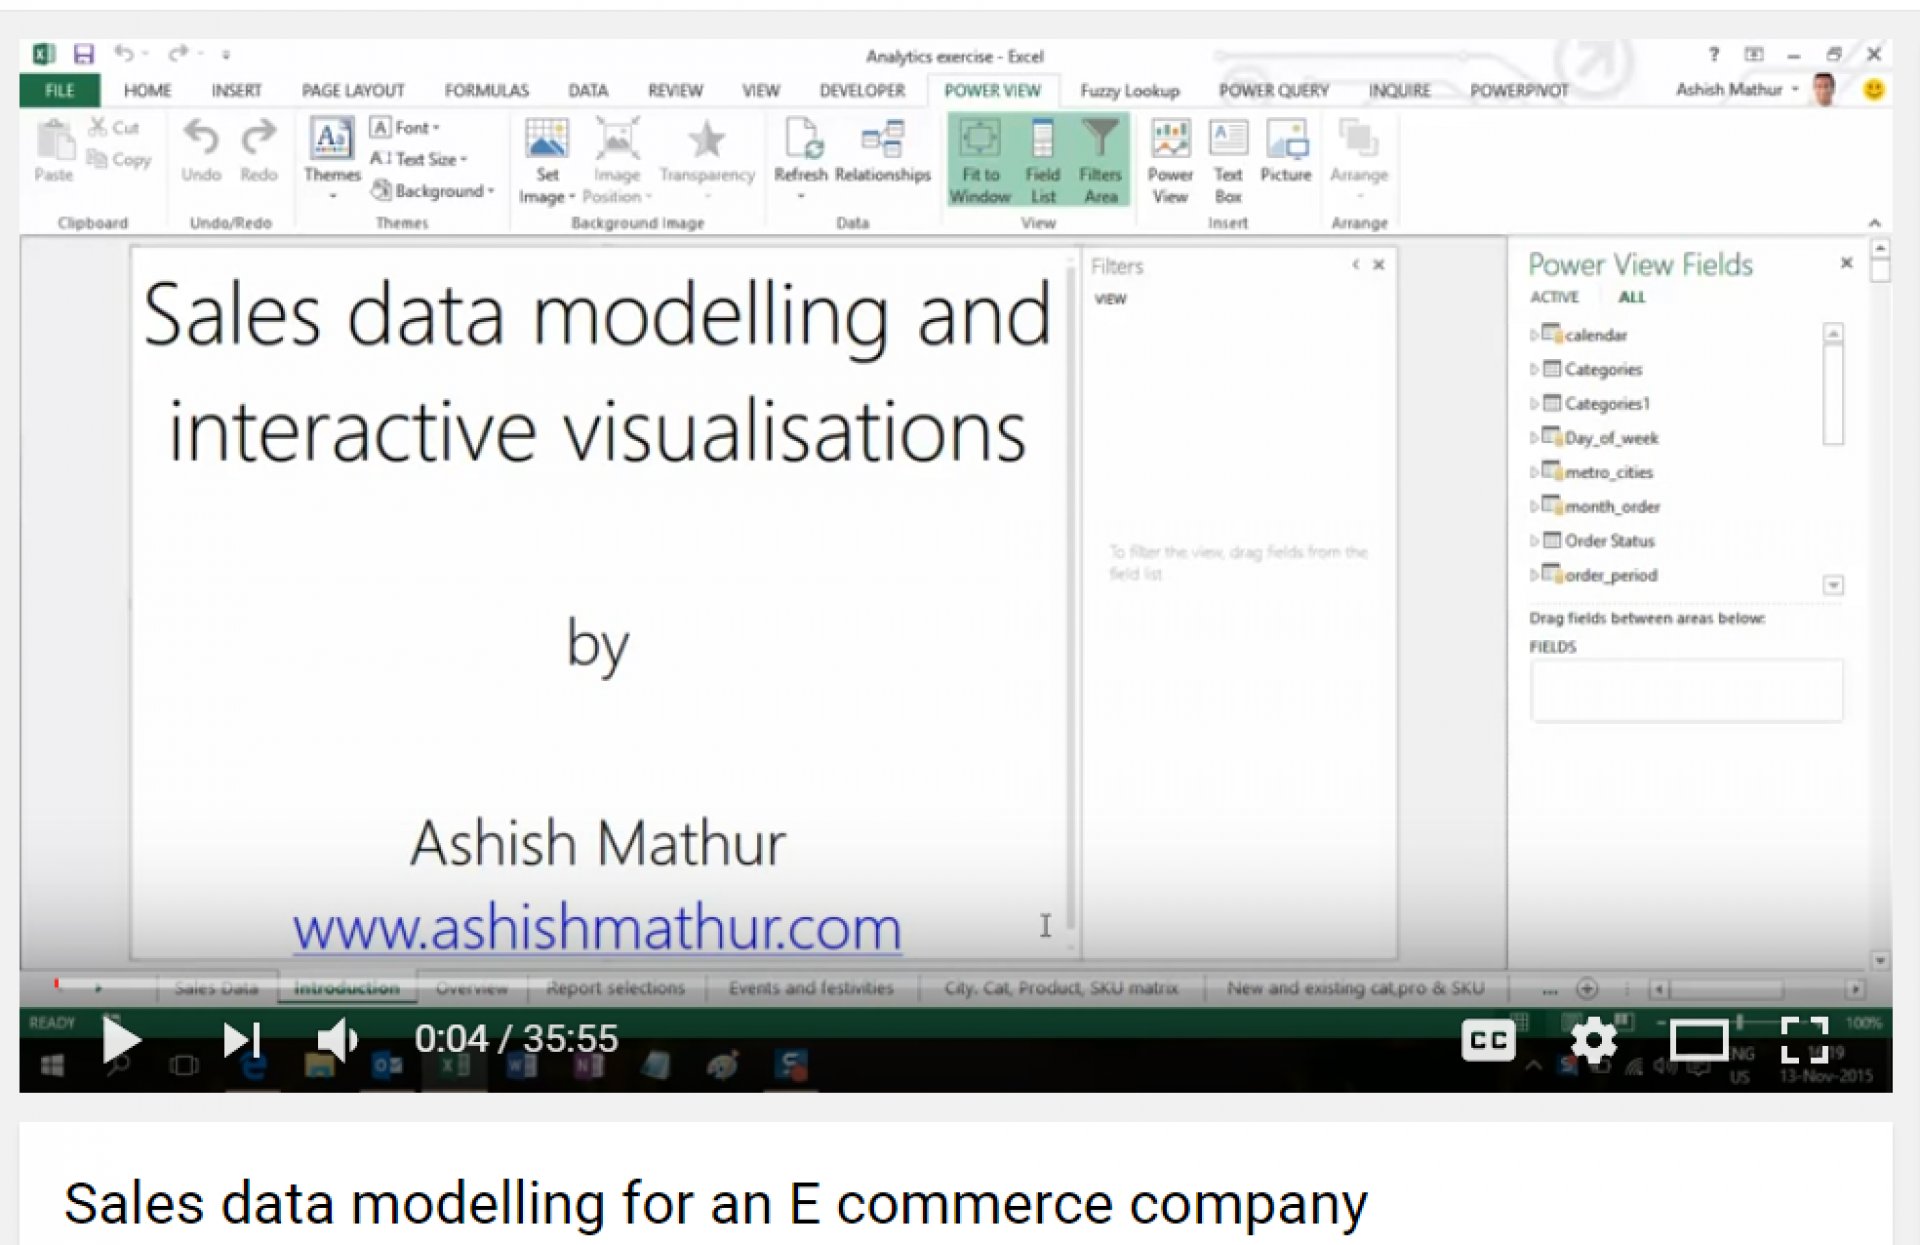
Modeling Sales Data for E-commerce businesses
Using MS Excel's Business Intelligence features to analyse sales data.
