
Equity Investment Thesis Builder — Stock Intrinsic Value & DCF Model | Reverse DCF · Margin of Safety · WACC · Sensitivi
Originally published: 26/07/2026 19:38
Publication number: ELQ-97058-1
View all versions & Certificate
certified

Equity Investment Thesis Builder — Stock Intrinsic Value & DCF Model | Reverse DCF · Margin of Safety · WACC · Sensitivi

A 12-tab Excel equity-valuation model: 10-year mid-year DCF, CAPM WACC builder with sanity checks, reverse DCF, margin-of-safety entry prices, two sensitivity g

Description

Here’s your text formatted for clarity and readability, preserving all the original wording:


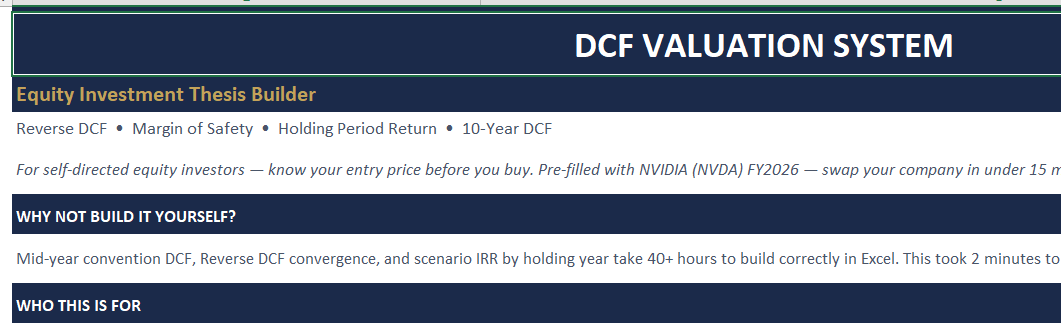
Equity Investment Thesis Builder

The Equity Investment Thesis Builder is a self-contained Excel valuation model for investors, analysts, and finance students who want to produce a defensible fair value — and a complete buy/hold/avoid thesis — without a Bloomberg terminal.

Enter a company's historicals, forward assumptions, and market data once, and the DCF fair value, the market-implied growth rate, the margin-of-safety entry prices, the sensitivity grids, and the investment verdict all populate automatically.

The workbook ships pre-filled with a fully worked NVIDIA (NVDA) FY2026 example sourced from the 10-K. This is not a single-output template — it is a valuation system built around skepticism. A competent generalist can wire up a DCF that returns a number in an afternoon; the practitioner-level part is knowing when that number is unreliable.

This model makes that explicit: a CAPM WACC builder with four sanity checks, a terminal-value-share warning, a Gordon-Growth-versus-exit-multiple cross-check, and a reverse DCF that tests your growth assumption against the price the market is already paying.


What you get

  • A 10-year DCF engine (FCFF, mid-year convention, Gordon Growth terminal value)

  • A CAPM WACC builder with four live red/green sanity checks

  • A reverse DCF that solves the market-implied revenue CAGR from today's price

  • A margin-of-safety tab that converts fair value into entry prices at 10 / 20 / 30% discounts, plus a target-IRR max price

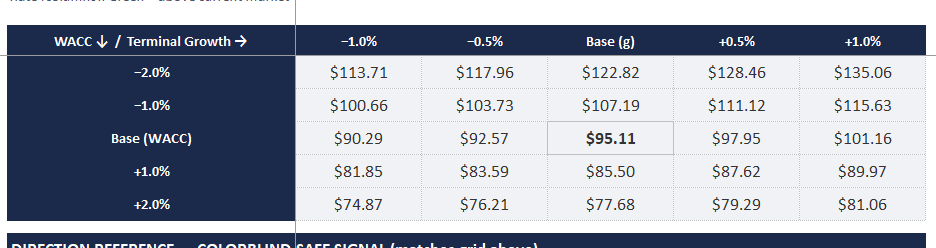
  • Two 5×5 sensitivity grids (WACC × terminal growth; revenue growth × EBIT margin)

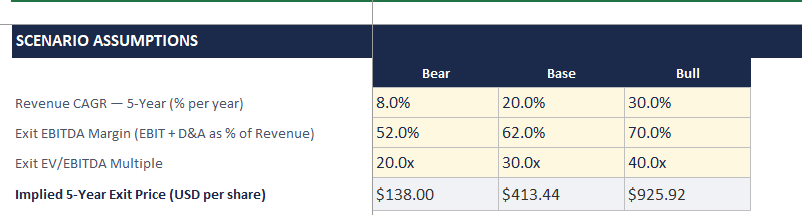
  • A holding-period simulator with bear / base / bull 5-year exit IRR

  • An AI Prompts tab (6 analyst prompts + 4 that auto-populate with your figures)

  • A fully auto-populated dashboard: verdict, fair value, upside/downside, margin of safety, IRRs, and two charts

  • A 20-page Methodology & Data Guide explaining every formula, every assumption, and the exact 10-K line behind each pre-fill figure


Model structure — Excel (12 tabs)

  1. Cover — disclaimer, license, and full workbook map

  2. Dashboard — investment verdict, fair value, upside/downside, margin of safety, IRRs, and two charts; zero input

  3. Quick Start — 15-minute setup guide, FAQ, and company-swap walkthrough

  4. Company Data — all inputs in one place (historical, forward, and market data); protected, with only the amber input cells editable

  5. WACC Builder — CAPM cost of equity and after-tax cost of debt, with four sanity checks

  6. DCF Model — 10-year FCFF, mid-year convention, Gordon Growth terminal value, implied exit EV/EBITDA cross-check

  7. Sensitivity Analysis — WACC × terminal-growth grid and revenue-growth × EBIT-margin grid

  8. Reverse DCF — market-implied revenue CAGR solver (Goal-Seek ready)

  9. Margin of Safety — entry prices at 10 / 20 / 30% discount, plus target-IRR max price

  10. Holding Period Simulator — bear / base / bull 5-year exit IRR

  11. AI Prompts — 6 analyst prompts + 4 dynamic builders that pull in the user's figures

  12. Rates — risk-free rate, equity risk premium, beta, cost of debt; feeds the WACC builder


Key methodological features

  • Forward and reverse valuation in one file — fair value plus the growth rate the market is already paying for, so mispricing is explicit

  • Mid-year discounting and a tapering forecast (growth, margin, capex %, and working-capital % all decline across the horizon) rather than flat-line assumptions

  • Gordon Growth terminal value cross-checked against an EV/EBITDA exit multiple, with a divergence flag

  • WACC built from CAPM with four sanity checks resolving to a visible status

  • Margin of safety expressed as concrete entry prices, not a single point estimate

  • Built for backward compatibility: no XLOOKUP, LET, LAMBDA, or dynamic-array functions, so the model runs unchanged on Excel 2019

  • No macros, no VBA, no Power Query, no add-ins


See it working

Pre-loaded with NVIDIA (NVDA) FY2026 (fiscal year ended January 25, 2026): on a conservative DCF the model returns a fair value of roughly $95 against a ~$205 market price (June 2026) — a deliberate AVOID that shows the framework separating a great company from a great price. Replace the inputs with your own and every output re-prices.


Technical specifications

  • Format: .xlsx (single workbook) + 20-page Methodology & Data Guide (PDF) + 2-page Stock Analysis Checklist (PDF)

  • Compatibility: Excel 2019, 2021, Microsoft 365 (Windows and Mac)

  • Not compatible with Google Sheets (Excel-native by design)

  • No macros, no VBA, no add-ins

  • NVIDIA FY2026 worked example pre-loaded; replace with your own

  • 12 tabs · 400 live formulas · 2 sensitivity grids · reverse DCF · holding-period IRR

  • Delivery: instant digital download · single-user license

This Best Practice includes
- Format: .xlsx (single workbook) + 20-page Methodology & Data Guide (PDF) + 2-page Stock Analysis Checklist (PDF) - Com

Acquire business license for $97.00

Add to cart

Add to bookmarks

Discuss

Further information

• Produce a defensible intrinsic fair value for any public company from a single set of inputs — a complete buy/hold/avoid thesis, not a single output cell
• Run both a forward DCF (fair value) and a reverse DCF (the growth rate the market is already pricing) so mispricing is explicit
• Build a CAPM cost of capital with four sanity checks that flag a broken WACC before it corrupts the valuation
• Translate fair value into concrete entry prices via a margin-of-safety tab (10 / 20 / 30% discounts and a target-IRR max price)
• Stress-test the valuation with two 5×5 sensitivity grids and a bear/base/bull holding-period IRR
• Draft the written investment thesis fast using an AI Prompts tab that auto-fills with the user's own numbers

• Single-entity public companies with positive, forecastable operating cash flow
• Self-directed investors, value investors, and analysts building a buy/hold/avoid thesis
• Finance and MBA students learning DCF, WACC, and reverse-DCF mechanics
• Equity-research and investment-banking candidates preparing for valuation interviews
• Users on Microsoft Excel 2019, 2021, or 365 (Windows or Mac)

• Pre-revenue or early-stage companies with no forecastable free cash flow
• Banks, insurers, and other financials where a DCF is not the appropriate framework (dividend-discount / excess-return models suit better)
• Multi-segment sum-of-the-parts valuations requiring separate divisional builds
• Google Sheets users — the workbook is Excel-native and uses Excel-specific features
• Buyers seeking live data feeds — all inputs are entered manually by design (no API, no Power Query)


0.0 / 5 (0 votes)

please wait...