
Publication number: ELQ-12124-1
View all versions & Certificate

SaaS Financial Model: MRR, Churn, LTV & CAC Dashboard
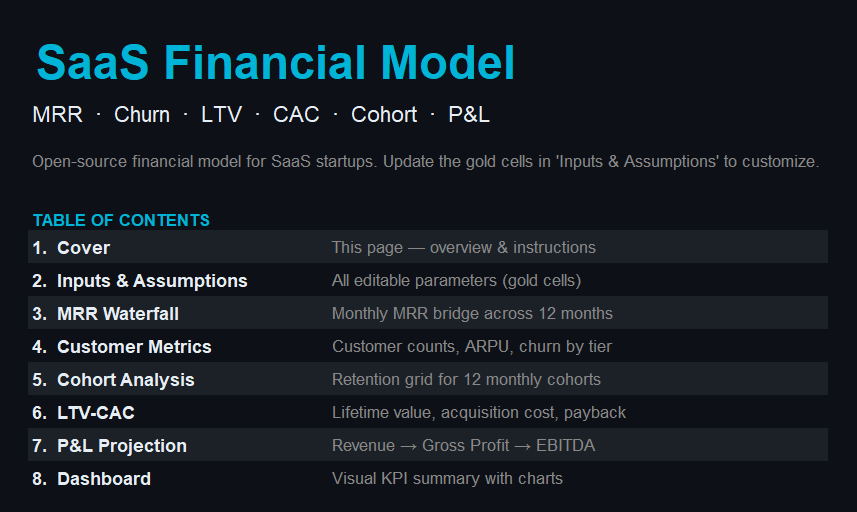
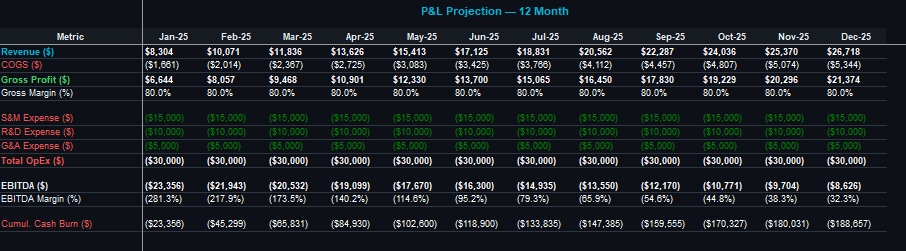
Open-source Excel template for 12-month SaaS projections with cohort analysis and unit economics.
Further information
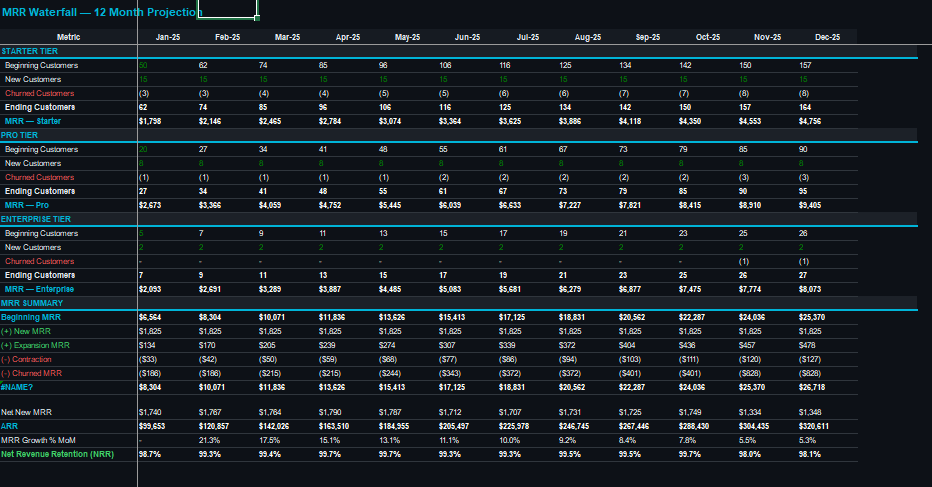
Plan 12-month cash flow with revenue projections by customer tier
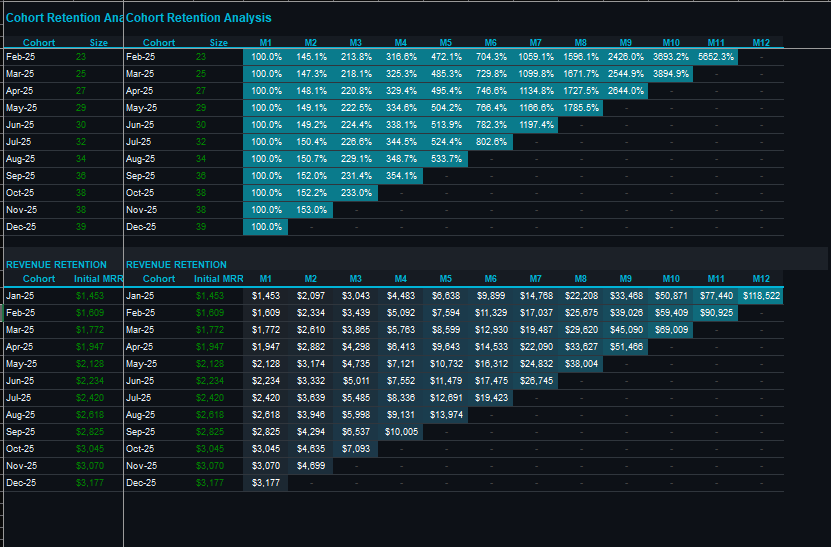
Track customer health via cohort retention and net revenue retention (NRR)
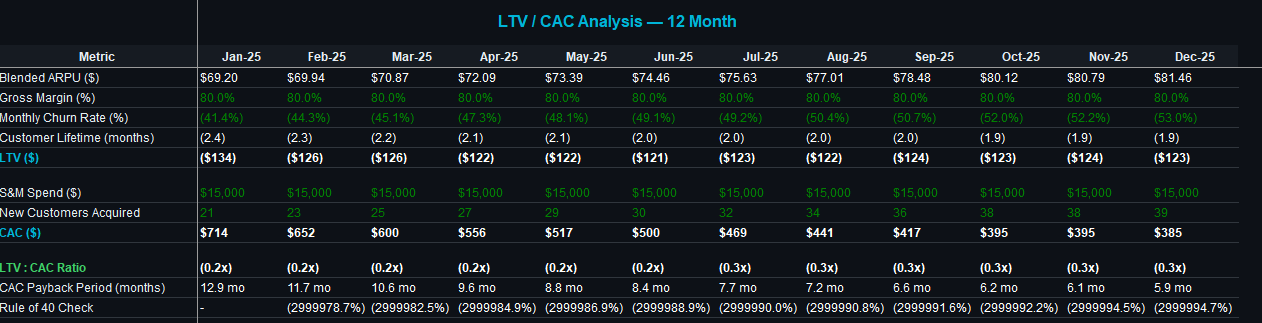
Measure unit economics (LTV:CAC ratio, payback period, gross margin)
Run scenario analysis by adjusting pricing, churn, or S&M spend
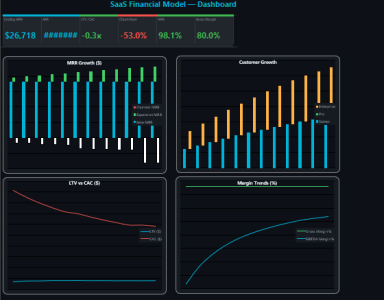
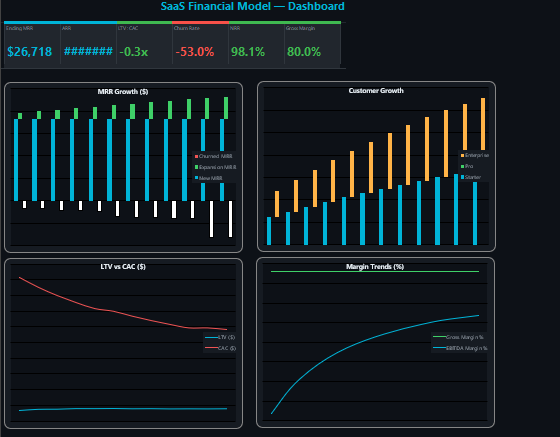
Visualize trends with automated charts showing growth, margins, and profitability
Early-stage SaaS companies (pre-IPO) seeking fundraising readiness
Companies with 3 or fewer pricing tiers and monthly billing cycles
Businesses with relatively uniform churn rates across customer segments
Teams needing simple, audit-ready models without complex dependencies
Scenarios where monthly projections are sufficient (vs. weekly/daily granularity)
Organizations comfortable with Excel as the modeling platform
Annual billing or multi-year contracts (model assumes MRR only)
Highly complex pricing (e.g., usage-based, tiered discounts, bundles)
Significant expansion/contraction MRR differences between cohorts
Long sales cycles (requires adjusting CAC payback for 6+ month deals)
Enterprise customers with bespoke contracts or non-standard terms
Multi-product lines with separate P&Ls
Organizations requiring real-time dashboards or live API integrations
