
Originally published: 31/10/2024 23:21
Publication number: ELQ-95302-1
View all versions & Certificate
Publication number: ELQ-95302-1
View all versions & Certificate

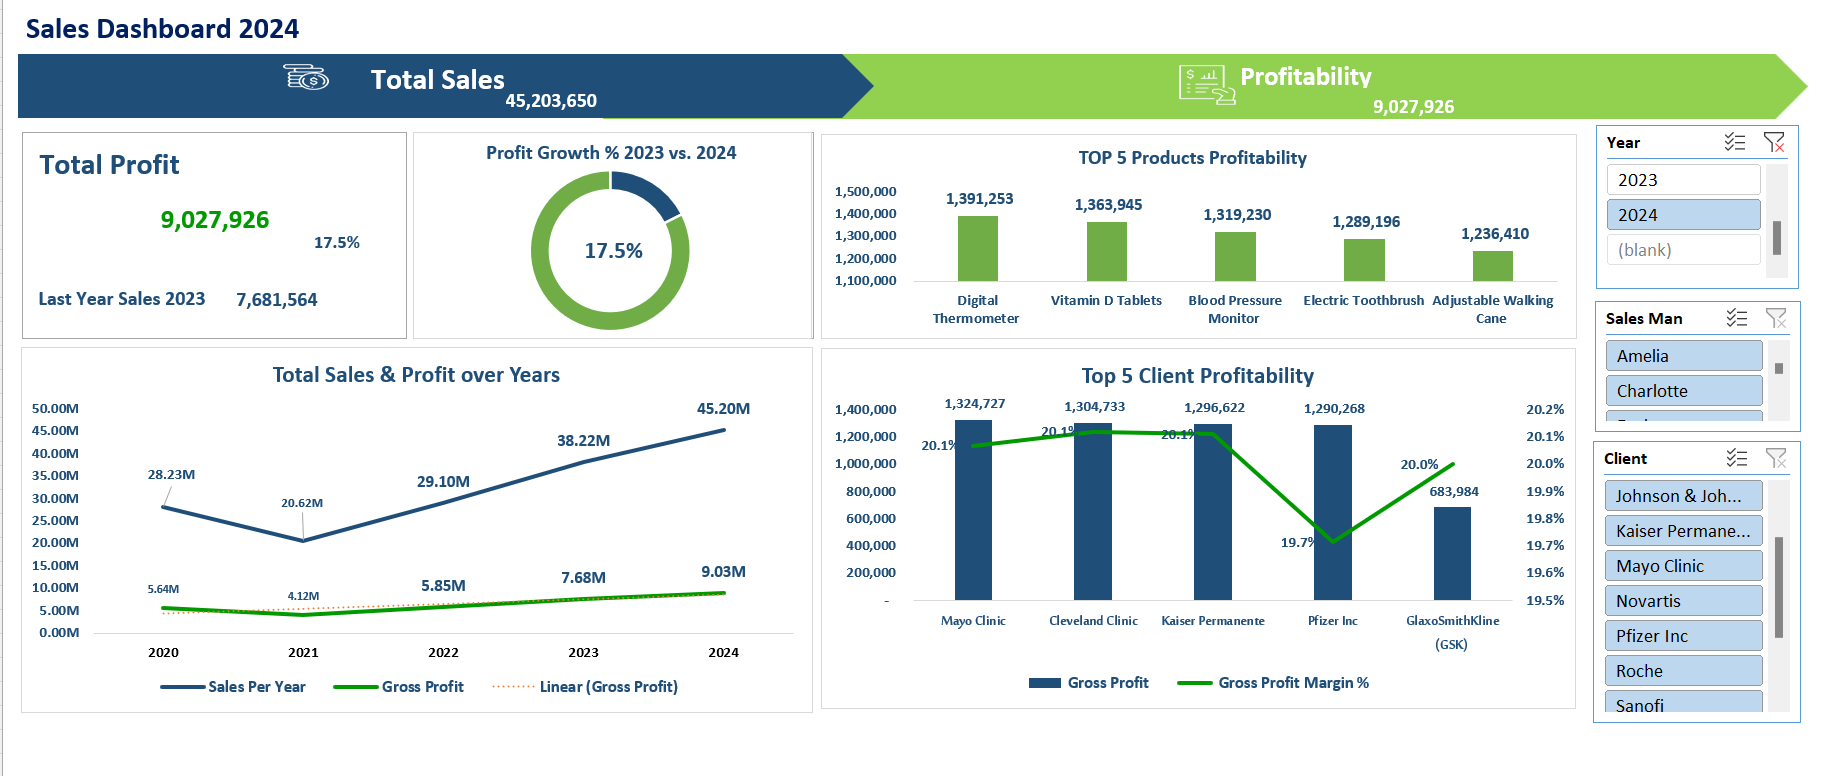
Sales & Profitability Dashboard
Sales Dashboard: Input, Analyze, Refresh, Export.

Founder of Ze-accountant - Cost & Budgeting Section Head - Instructor- business consultant for tech startups and SMEsFollow 19
Description
Instructions for Using the Sales & Profit Dashboard Template
Fill in the columns under Sales Man, Client, Year, Item Group, Product, Sales Amount, Gross Profit, and Profit Margin%.
Make sure to use consistent data formats (e.g., for Years and currency) for accurate calculations and visualizations.
Enter data for all mandatory fields to avoid gaps in insights. Missing data in Sales Amount or Gross Profit will affect the accuracy of profit calculations and dashboard summaries.
The Profit Margin% should reflect the profitability for each sale. Formula is ready: Profit Margin% = (Gross Profit / Sales Amount) * 100 if needed.
Verify that all numbers are correct before viewing dashboard insights.
After updating data, ensure the dashboard visuals refresh automatically. If not, go to Data > Refresh All to update charts and pivot tables.
Use the dashboard to view trends in sales performance, top-performing salesmen, high-profit products, and year-over-year changes.
Explore the filters (if available) to drill down by Client, Year, or Product for more specific insights.
Review high and low Profit Margins across products and clients to find potential areas for improvement or growth.
If needed, export charts or tables by right-clicking on visuals and selecting Copy to paste into presentations or reports.
Following these steps will help you maximize the benefits of the dashboard, revealing actionable insights on sales and profitability.
Locate the chart that includes Year data in the dashboard.
Open the data source for this chart, and add new rows for the upcoming years, such as 2025, 2026, 2027, etc., to ensure projections are visible in the chart.
This Best Practice includes
Excel Dashboard