


Originally published: 29/06/2023 12:19
Publication number: ELQ-61489-1
View all versions & Certificate
Publication number: ELQ-61489-1
View all versions & Certificate

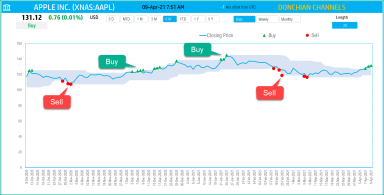
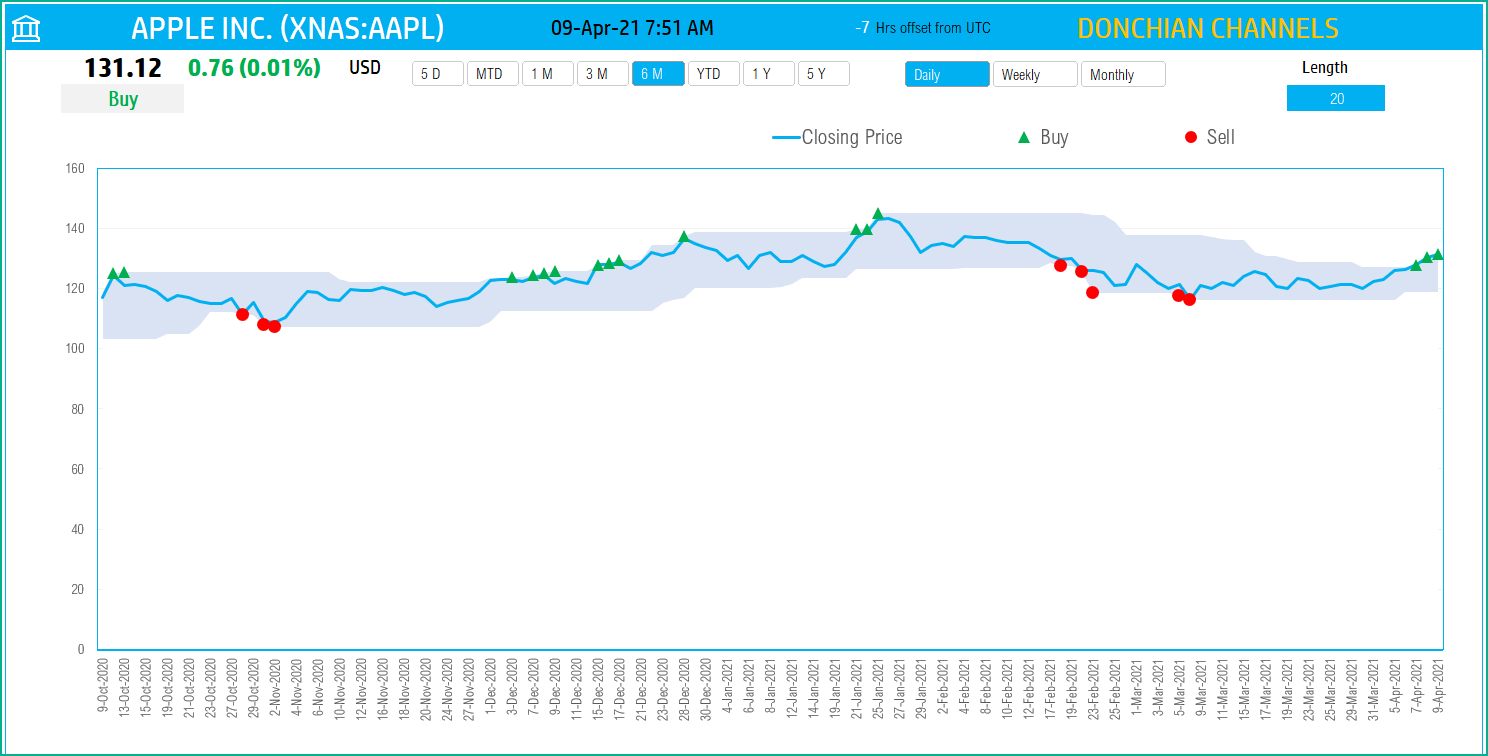
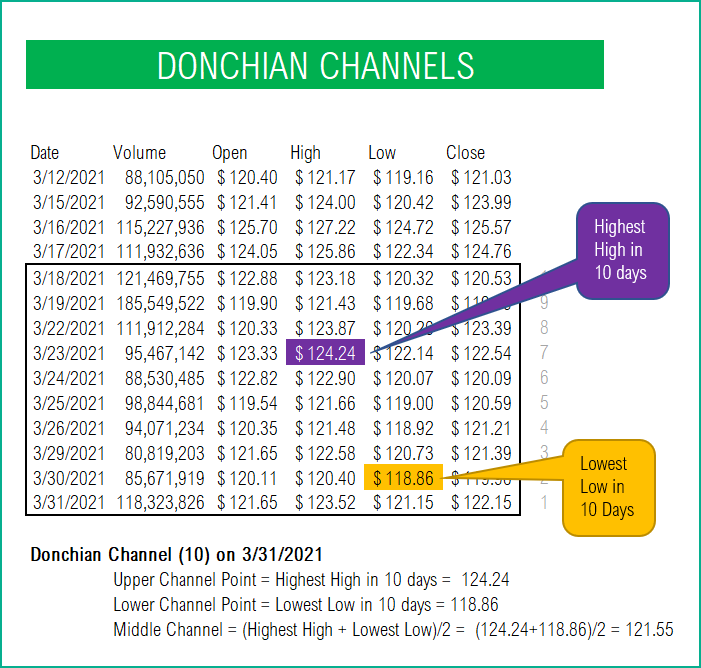
Donchian Channels Indicator – Technical Analysis – Stocks
This amazing free Microsoft Excel template is used to create the Donchian Channels indicator which is a banded technical indicator like Bollinger Bands.
