

Originally published: 05/05/2023 09:19
Last version published: 09/05/2023 08:06
Publication number: ELQ-49924-2
View all versions & Certificate
Last version published: 09/05/2023 08:06
Publication number: ELQ-49924-2
View all versions & Certificate

CBD Products Excel Financial Model
The model comprises a 5-year financial projection plan to monitor steady growth and profitability.
Our mission is to be the industrial leader and pioneer in our business domainFollow 17
Description
New businesses have the opportunity to sell a variety of CBD products, as the industry continues to introduce new options. However, starting or expanding a CBD business requires hard work and effort, and navigating changing regulations adds to the uncertainty. Oak Business Consultant offers expert help in growing and selling CBD products, including a CBD Products Excel Financial Model that can aid in business planning.
The CBD Products Financial Model Template includes financial statements and relevant metrics such as Sensitivity Analysis, Break-even Analysis, Diagnostic Tools, Project evaluation, and Charts. By examining the structure of the model and clicking on specific input sheets, users can access relevant worksheets.
Input tab of CBD Products Excel Financial Model
The model requires financial information, such as sales price, cost, and expenses, to be inputted. Inputs are indicated by a Peach fill and grey letters, calls up (direct links from other cells) are filled in grey with black letters, while calculations are indicated by white and black. The sensitivity analysis tab displays a high-level report of the business's profitability in various scenarios of uncertainty, such as a 10% increase in costs or expenses.
The break-even analysis tab shows the amount of items to sell and their currency value required to break even. Revenues are calculated based on factors such as sales, pricing, marketing, and costs, with working capital assumptions factored in to measure the impact on business cycles. The PnL Monthly tab aggregates statements such as profit and loss, balance sheet, and cash flow on a monthly basis.
The Dashboard tab presents various graphs relating to revenues, cash analysis, break-even analysis, sensitivity, assets vs. liabilities, and startup summary.
Salient Features of this CBD Products Excel Financial Model
All at One Place:
The entrepreneurs will get the idea about business input assumptions bought together to visualize the complete picture.
One Row & One Formula:
Calculations in this Business Financial Model Template are dynamic, based on one formula per row. Therefore, users look at the first row vertically downward the model.
No Hard-Coded numbers
There are no Hardcoded numbers imbibed within the formula. However, the numbers in the input tab are appropriately referred to within each procedure used in this CBD Products Financial Model.
No Complex Calculations
We have organized all sheets of the Financial Model transparently. Hence inputs are referenced from their singular points of origin throughout the origin.
Formatting and Colors
Here, we will explain how the template works in different color ranges and what they represent. Then, you can feed the financial information for the model, such as sales price, cost, expenses, etc.
Key Inputs of CBD Products Excel Financial Model
The growth rate, Price, and Expense.
Prices and segmentation of revenue.
Marketing Budget Sheet
Revenue Assumptions
Average Payable & Receivable days your business is following.
Cost of Goods.
Fixed Asset and Capital Expenditure.
Tax Rate
Investment table
Loan table
Key Features of CBD Products Excel Financial Model
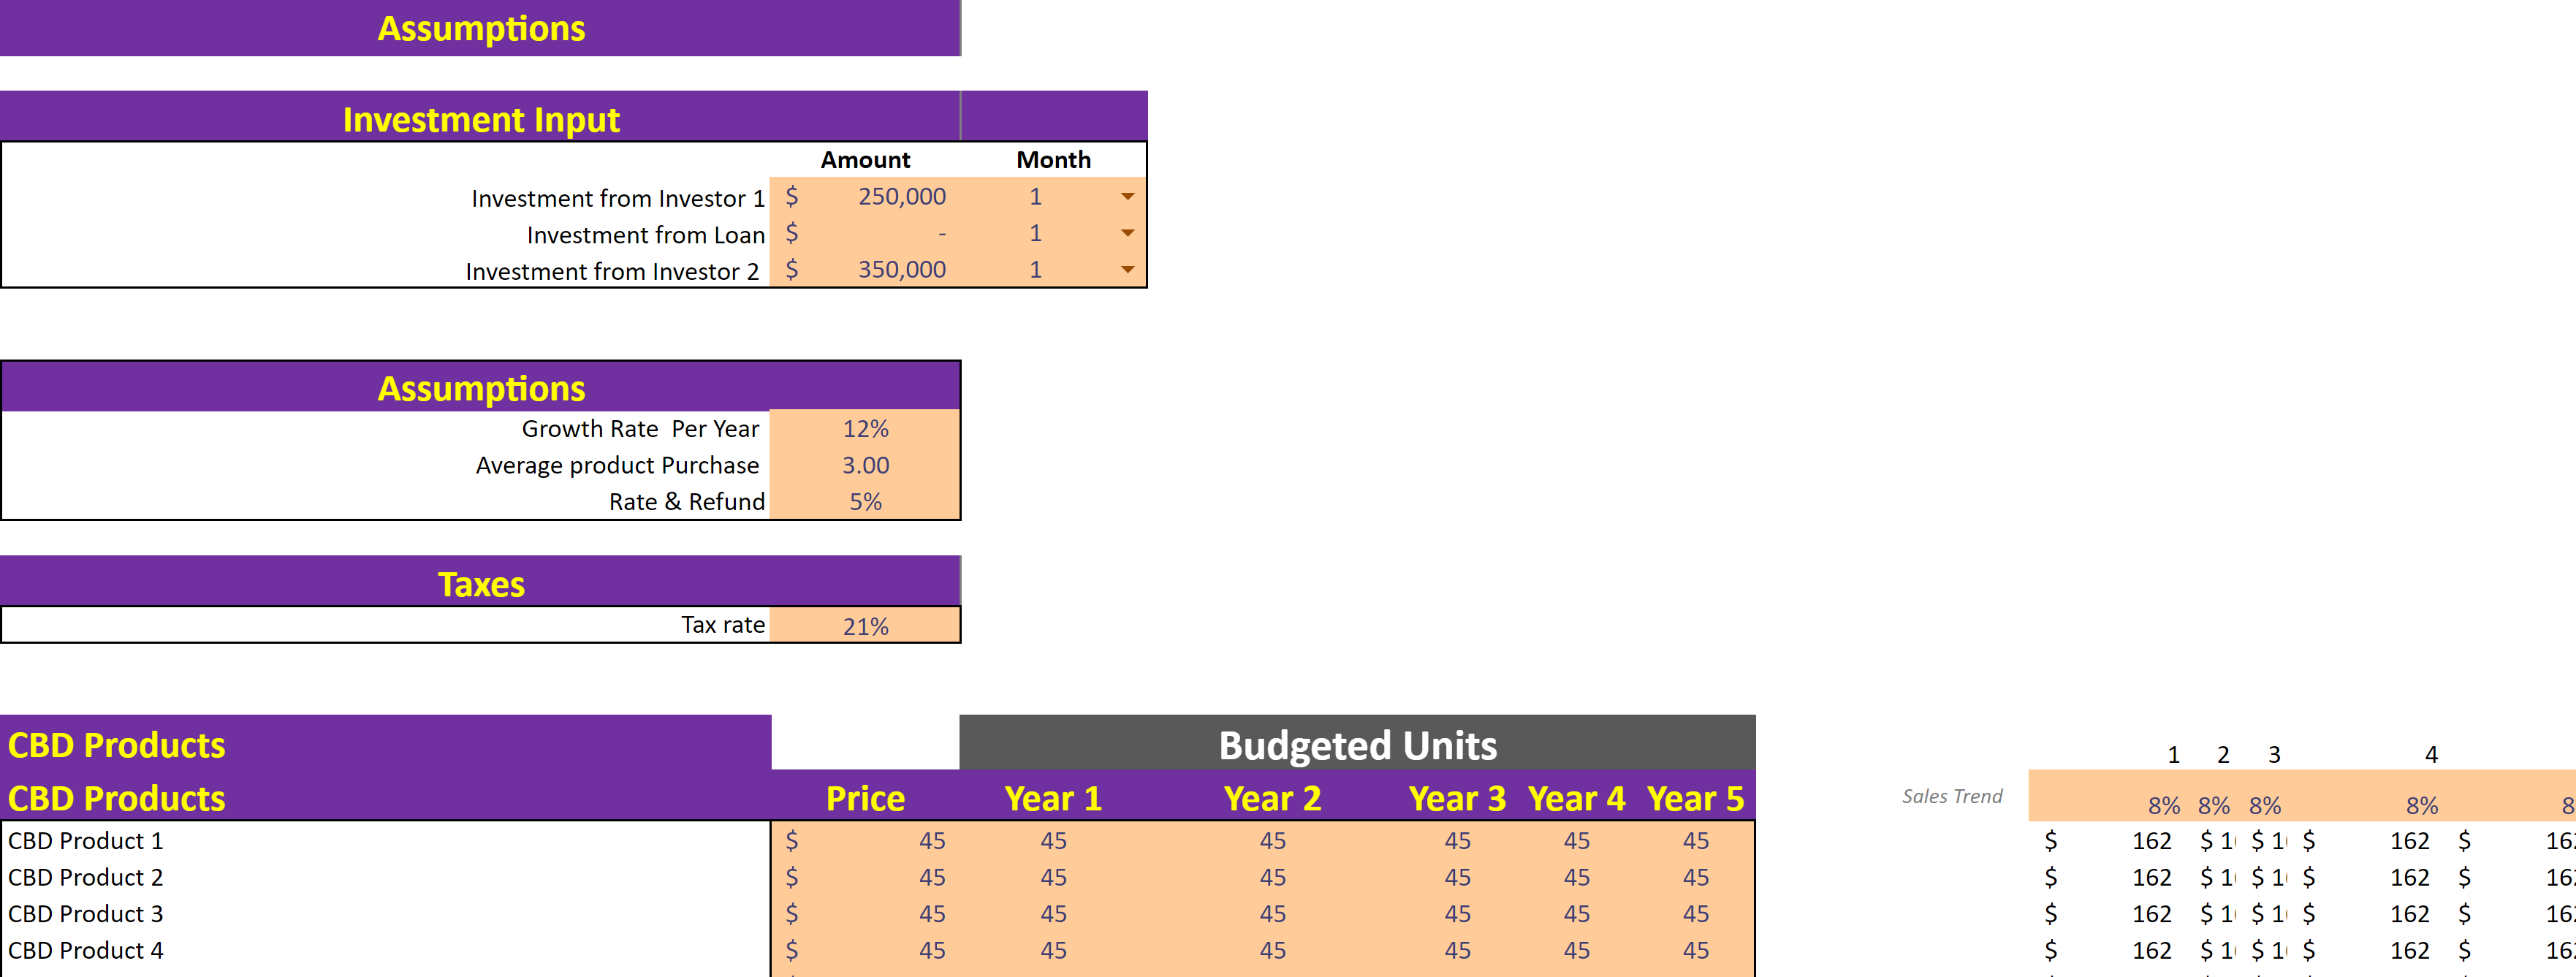
Input Sheet
The financial model template is designed with inputs that have a direct impact on the calculations across all sheets. As a result, any changes made to these inputs will be reflected in the final calculations, providing built-in flexibility for different outcomes. This feature is especially useful for financial projections.
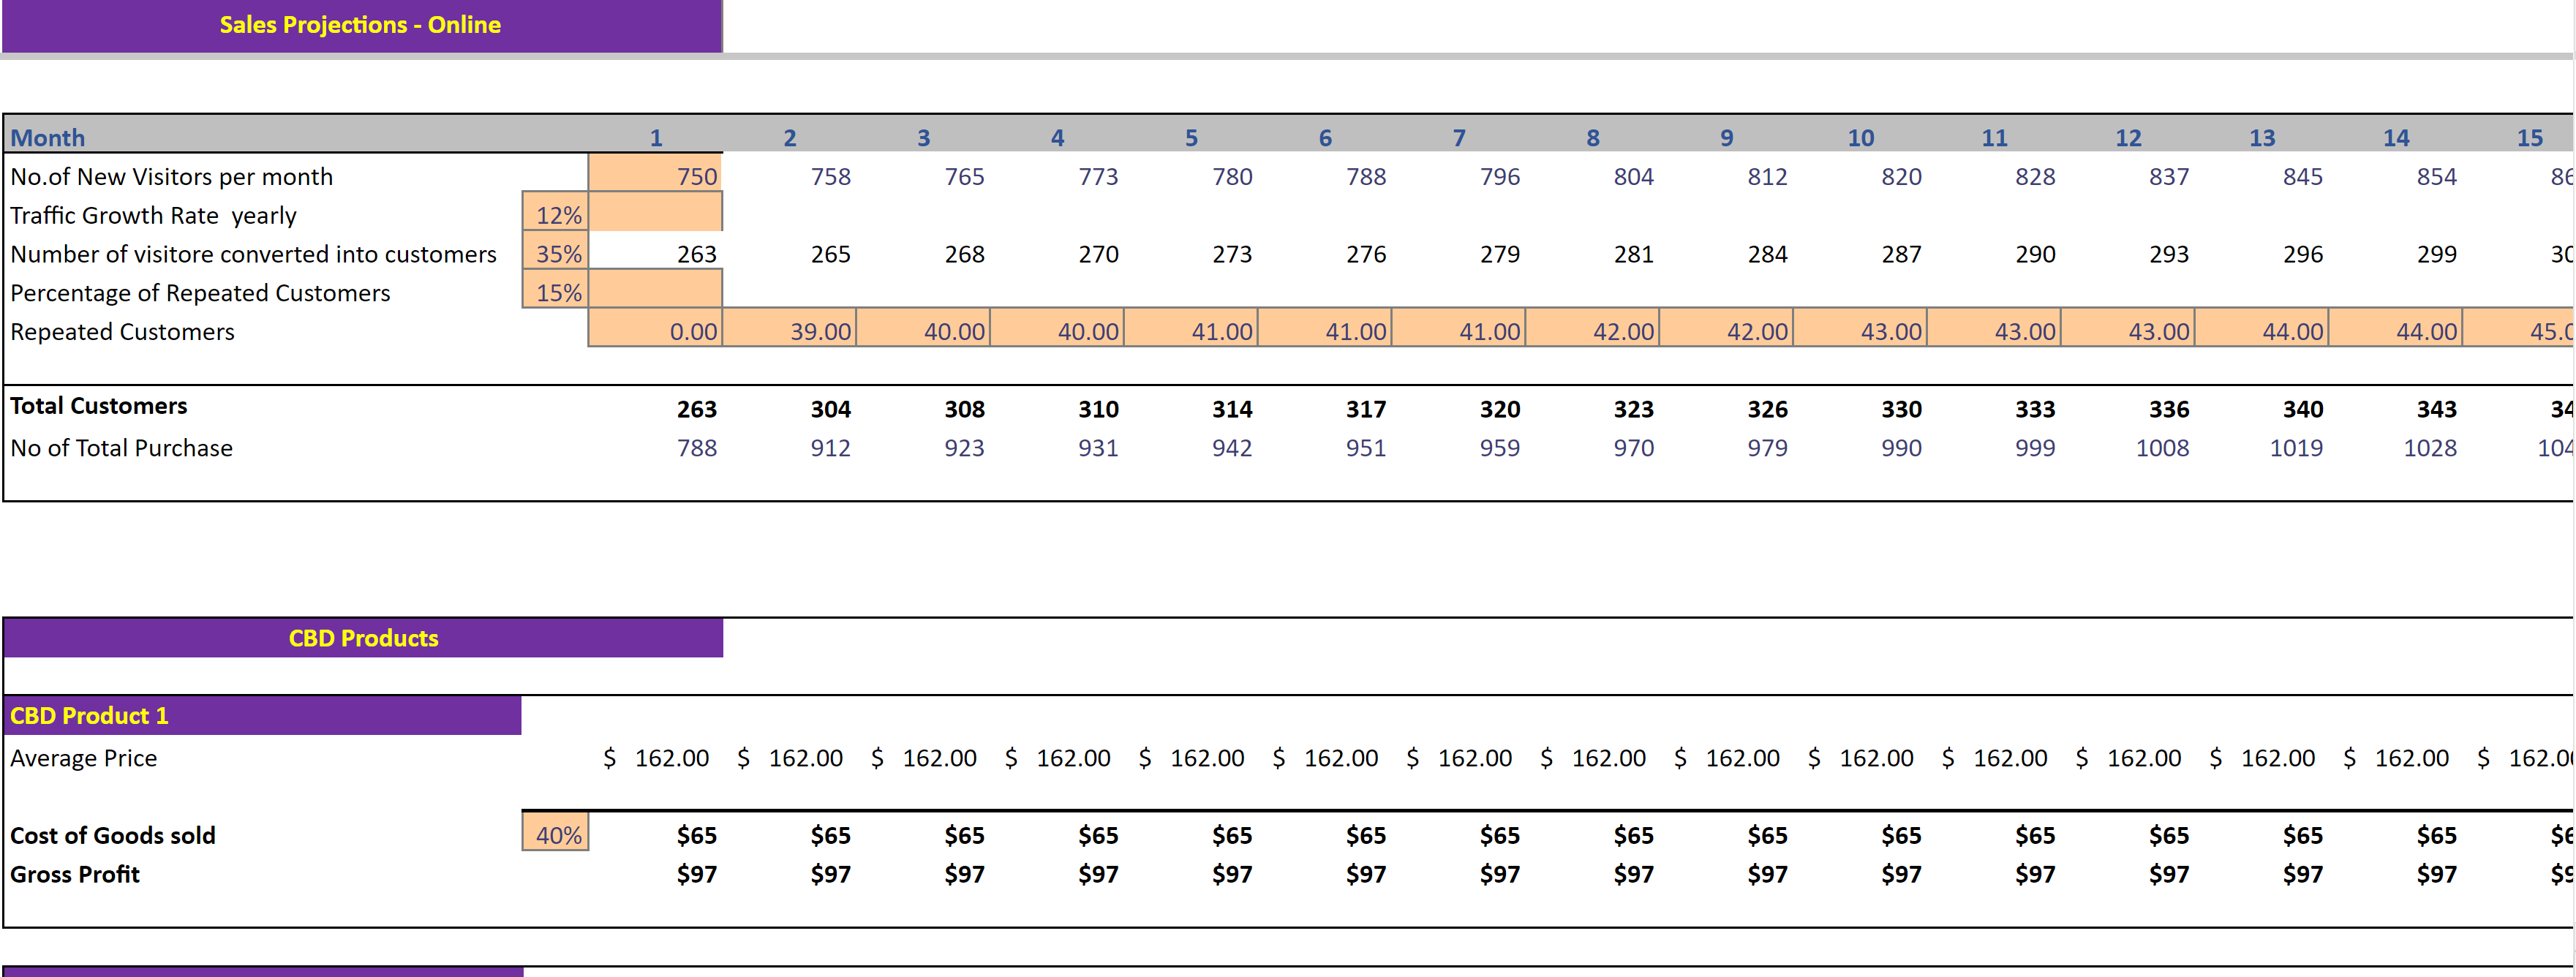
Revenue Stream
This sheet contains products categorized by their prices and sales allocation. After allocating these products according to your business needs and sales, the entire model will automatically perform all the necessary calculations.
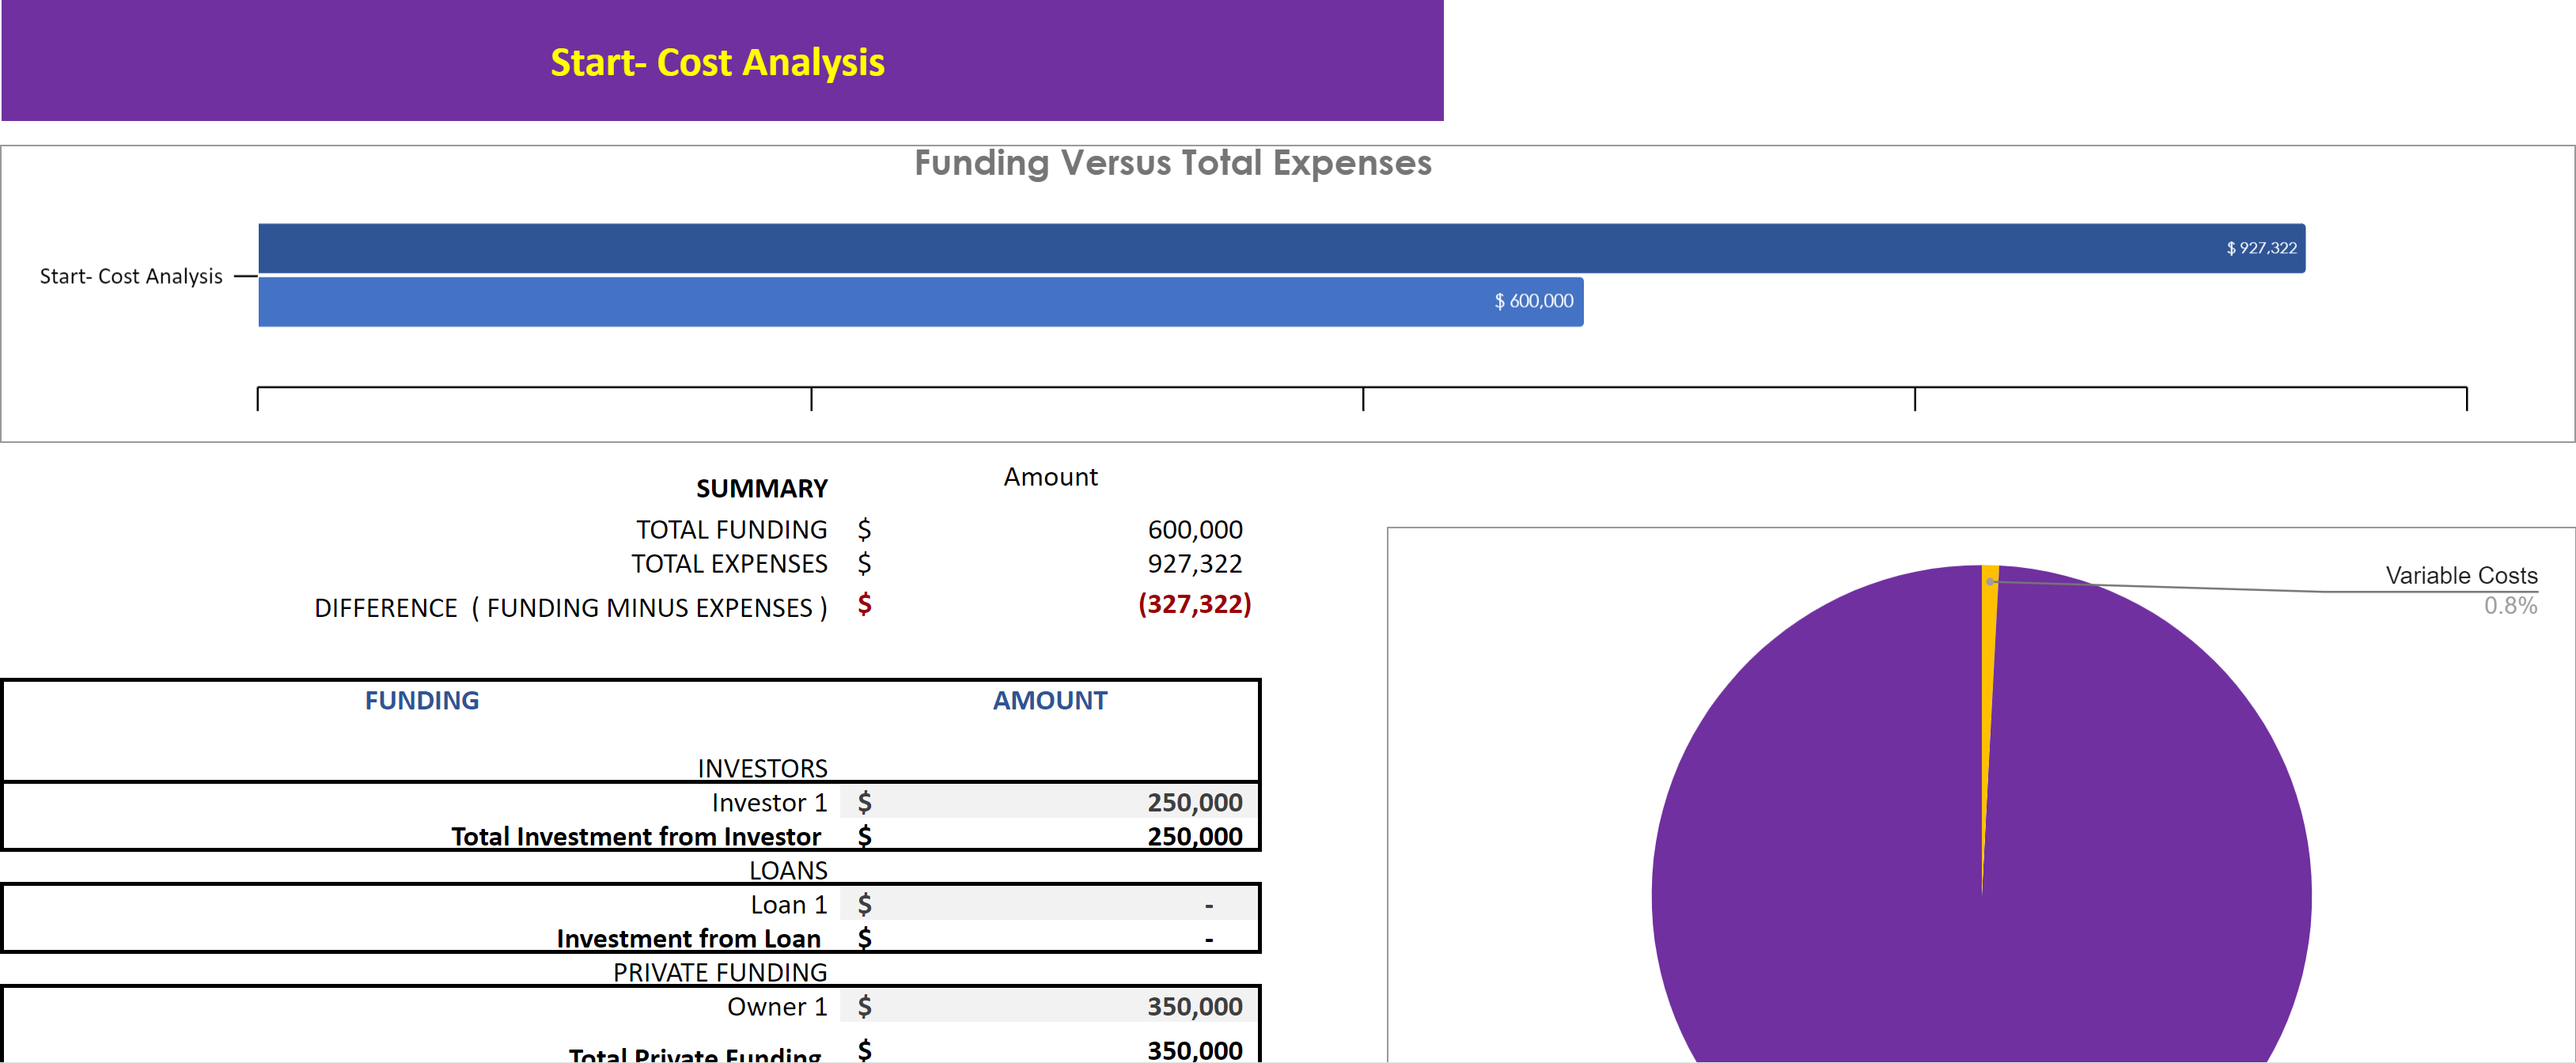
Startup Summary
The startup summary tab provides an overview of the total costs incurred at the start of the business, including capital expenditures, as well as the amount of cash that has been invested by the company to date. The tab also calculates the amount of investment required based on the number of months. The startup summary is a useful tool for evaluating the feasibility of your business idea and determining whether there are enough funds to support operations.
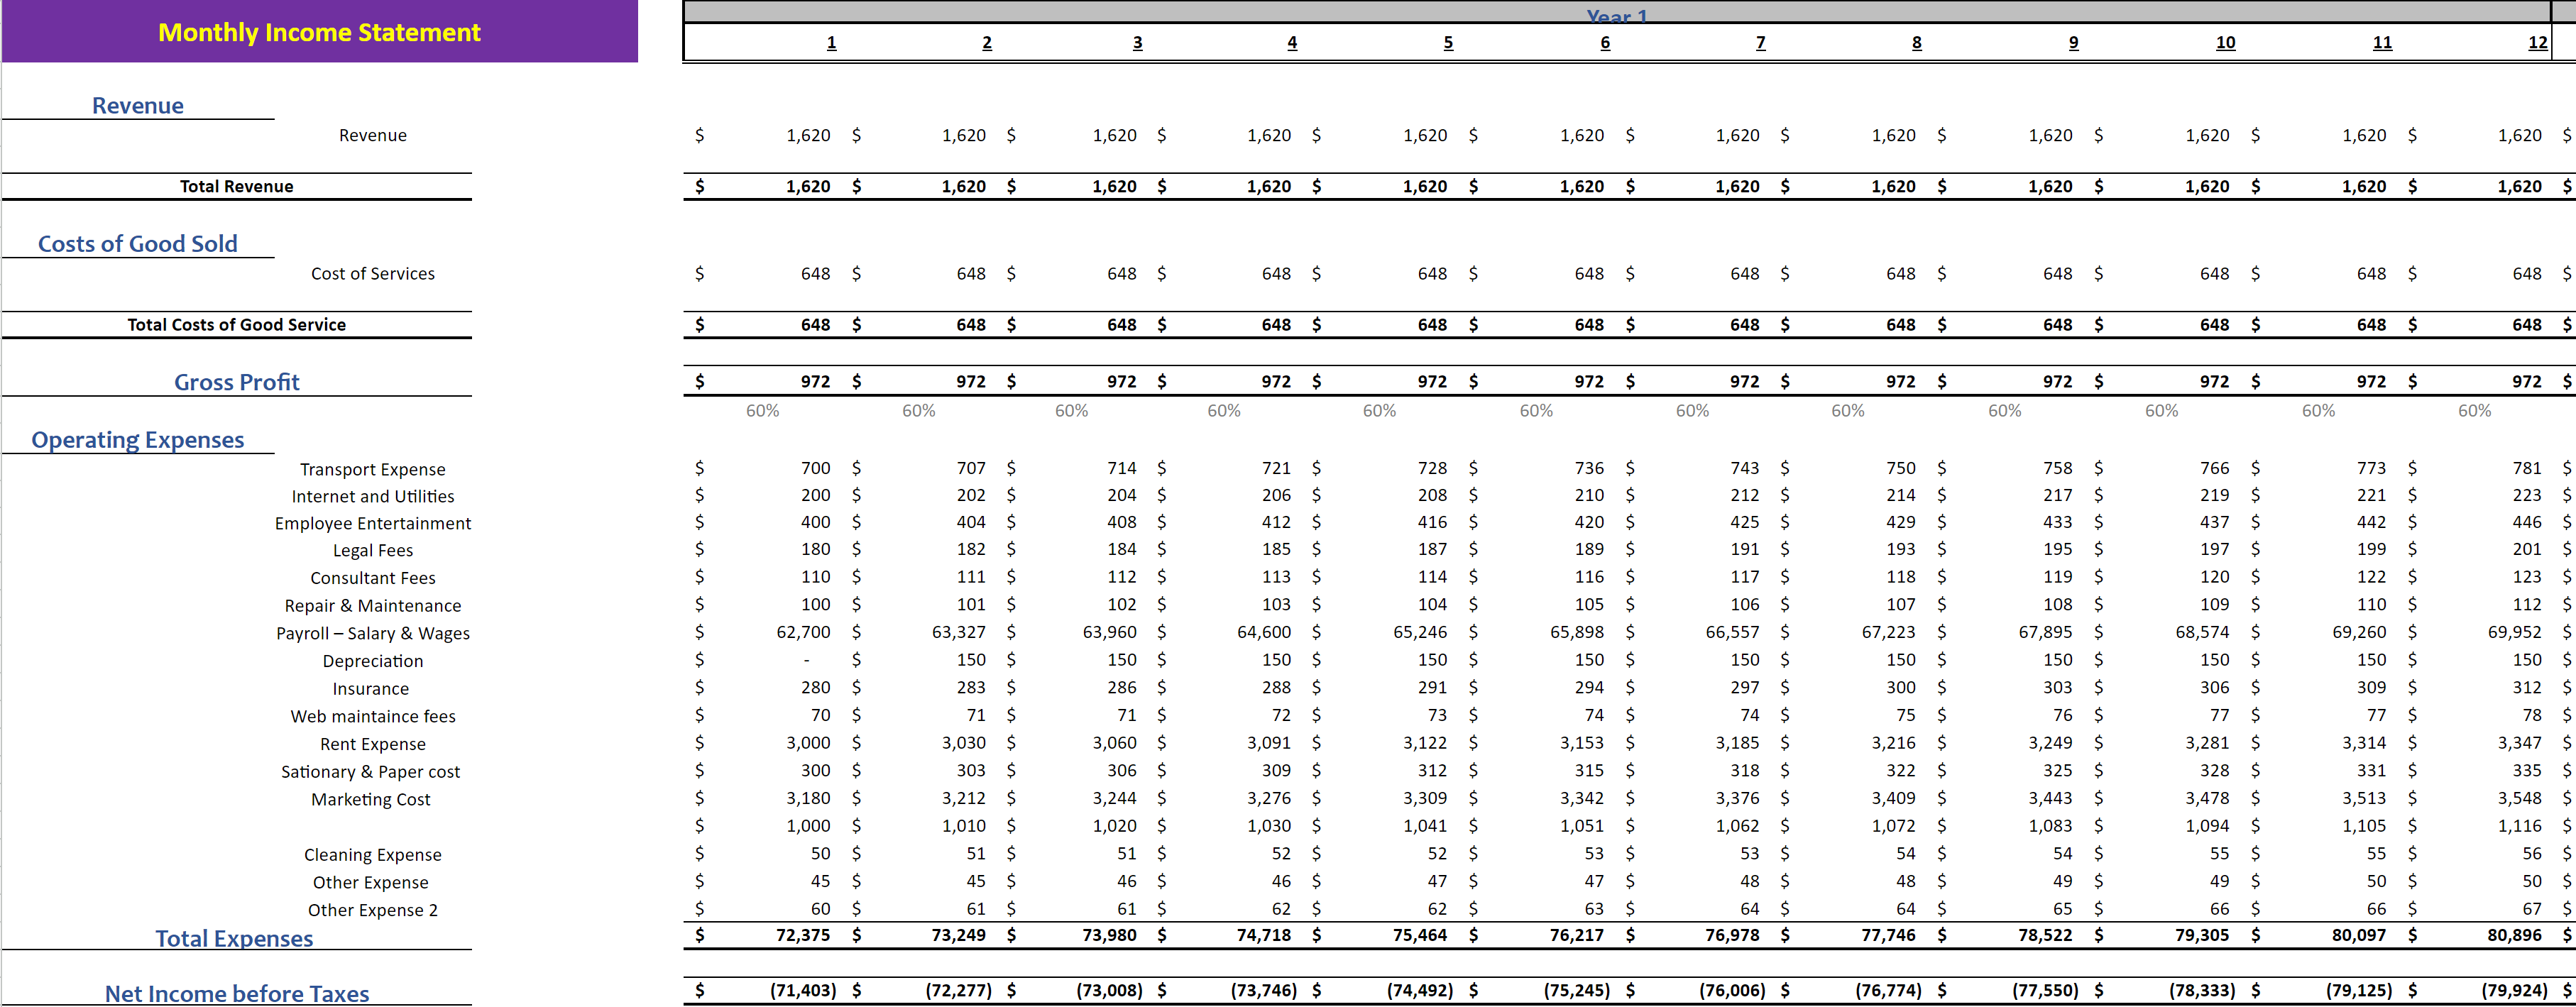
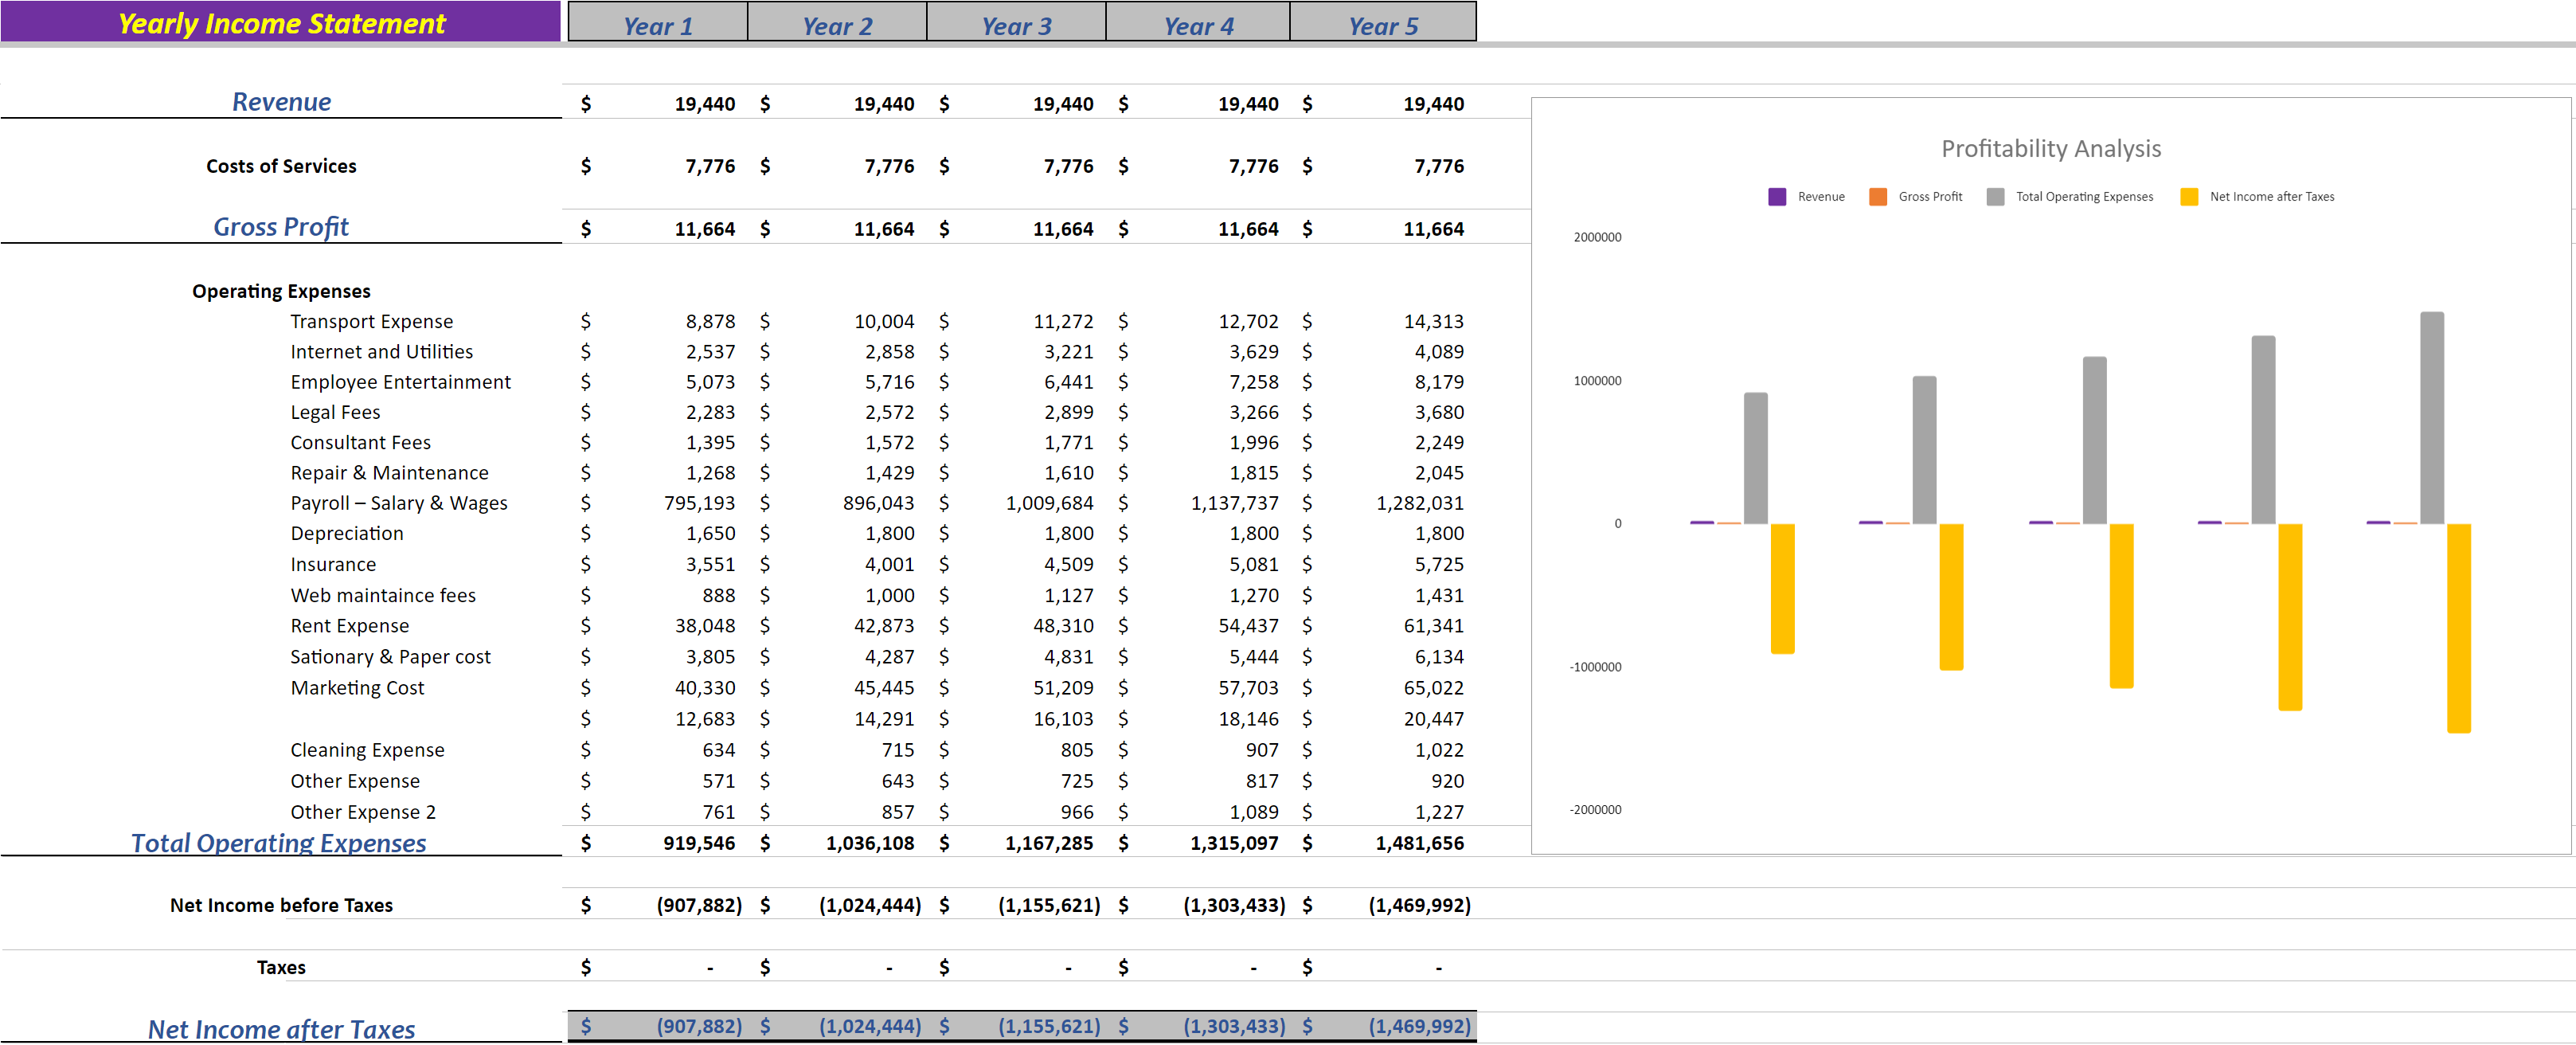
Monthly & Yearly Income Statement of CBD Products Excel Financial Model
The CBD Products Excel Financial Model is a valuable tool that provides a structured monthly and yearly income statement framework, which can be customized to fit your business's needs. The model is designed to provide an integrated financial overview that allows users to adjust any assumption in one part of the statement and see how it impacts all other parts of the statement accurately and consistently.
The monthly income statement sheet is particularly useful for those who require regular and detailed reporting. Gross and net earnings are linked to a revenue analysis sheet to ensure accurate reporting, and all revenue streams are included in the income statement. Oak Business Consultants understands the goals of every CBD Products business and has developed a mechanism to help business owners determine whether they are making profits. Furthermore, the Yearly Income Statement gives you complete insights into revenue and general & administrative expenses. The Yearly Income Statement also contains several graphs, assumptions, ratios, margins, net profit, earnings, cost of services, and profit after tax.
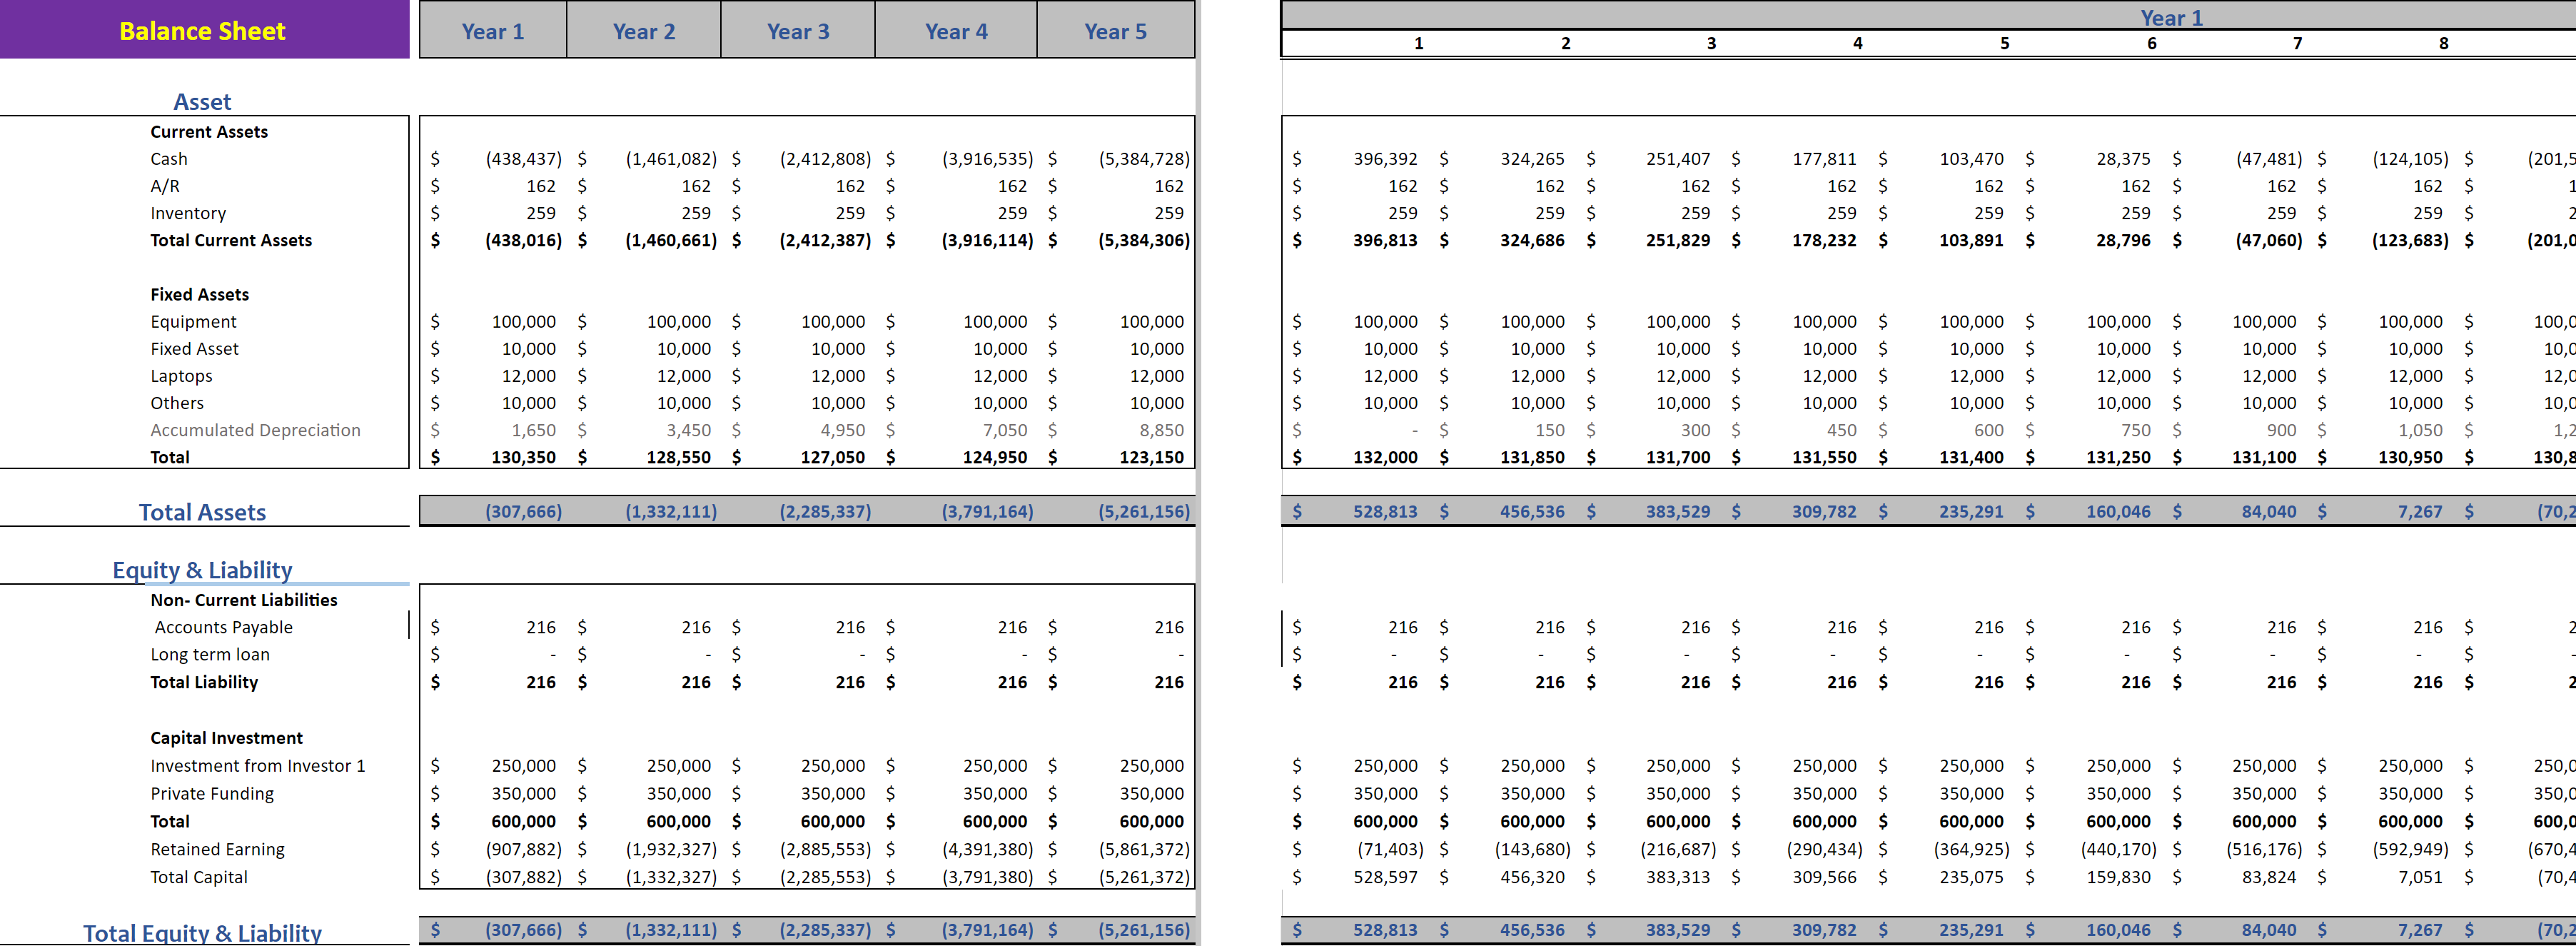
Balance Sheet
The presented financial statement offers the opportunity to assess the status of your current and fixed assets, liabilities, and equity. In addition, it facilitates the monitoring of accounts receivable, accounts payable, and accrued expenses. As a result, this particular financial tool provides an ideal platform for analyzing your essential balance sheet accounts.
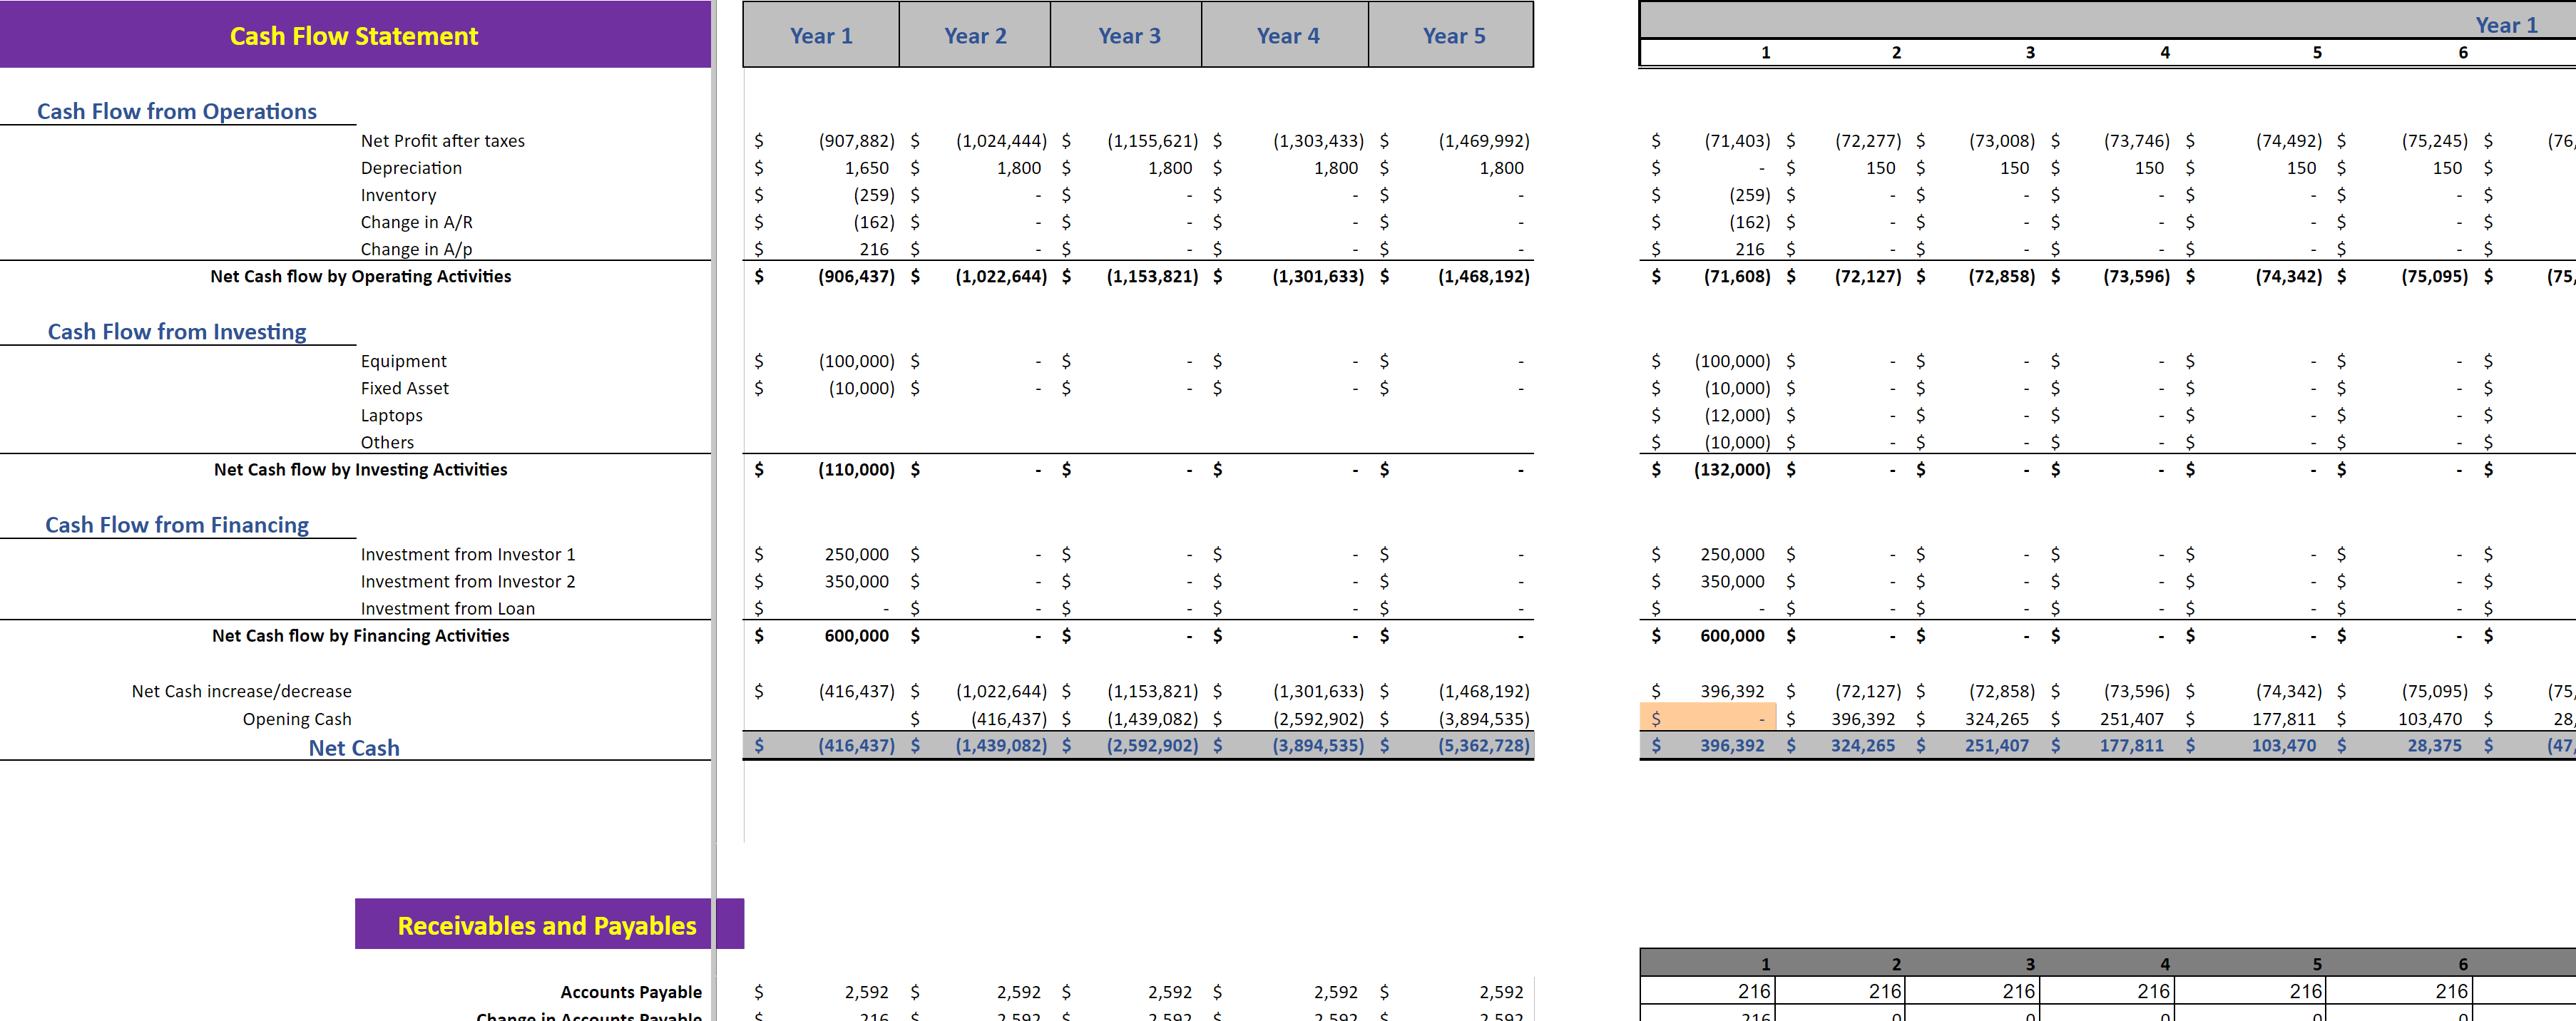
Cash Flow
The Cash Flow Statement is a crucial component of the trio of financial statements that disclose the cash inflows and outflows within a particular timeframe. Serving as a link between the income statement and the balance sheet, this statement illustrates how cash has been utilized and generated in the business.
Three main sections of the Cash flow Statement:
Operating Activities: We have included all cash in and out related to the operations of the business
Investing Activities: Any cash from the disposal of an asset and acquisition and investments has been included in this section connected to the inputs and asset tab.
Financing Activities: We have separately made a loan-related tab where you can enter all loan-related information. The bill has a link to the Financing Activities of Cash Flow Statement.
The Cashflow Statement in our Model contains a dedicated sheet to monitor and analyze your Company’s cash-ins and out. The cash flow statement is based on several key inputs: Payable and Receivable Days, yearly income, working capital, long-term debt, net cash, etc.
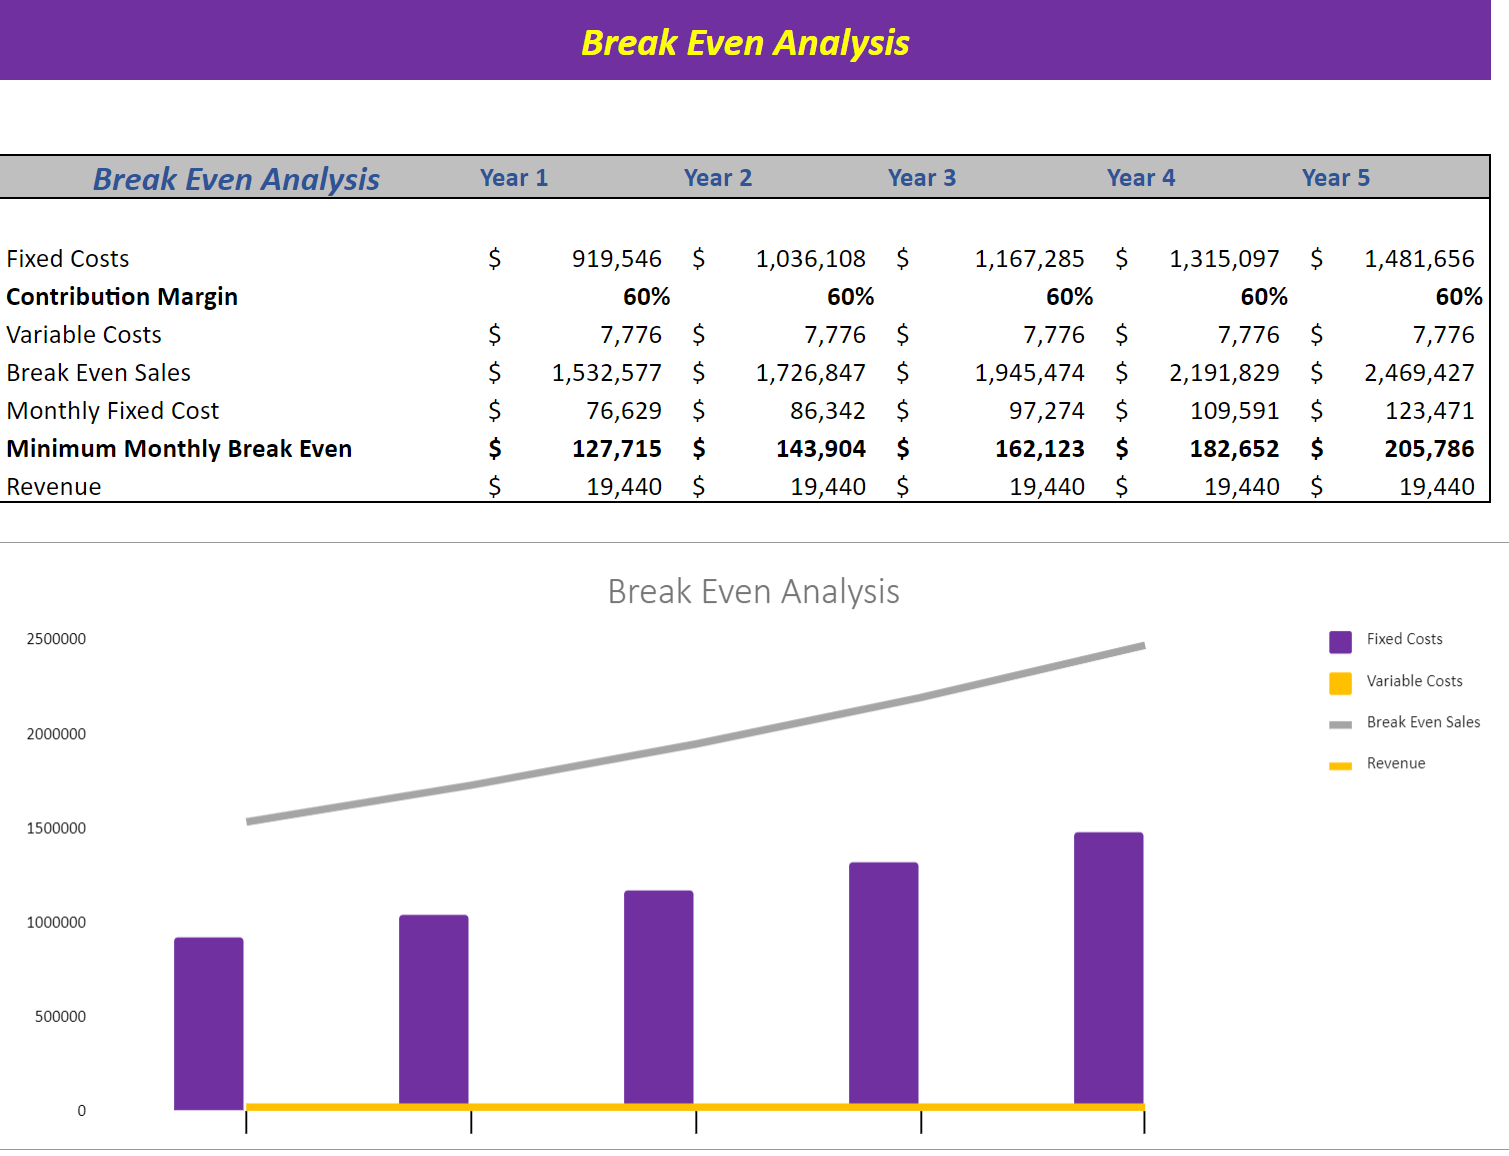
Break-Even Analysis
The Break-even analysis incorporated into our Financial Model allows for assessing the financial impact of various scenarios. For instance, if the marketing budget is increased or a new employee is added to the payroll, the Break-even analysis can help determine the additional sales required to offset the expense. Essentially, this analysis calculates the point at which the total sales revenue equals the fixed cost, resulting in neither profit nor loss. The Break-even analysis relies on marginal costing, which fluctuates depending on the level of output activity. By using this analysis, one can quickly identify the profits generated at different sales levels.
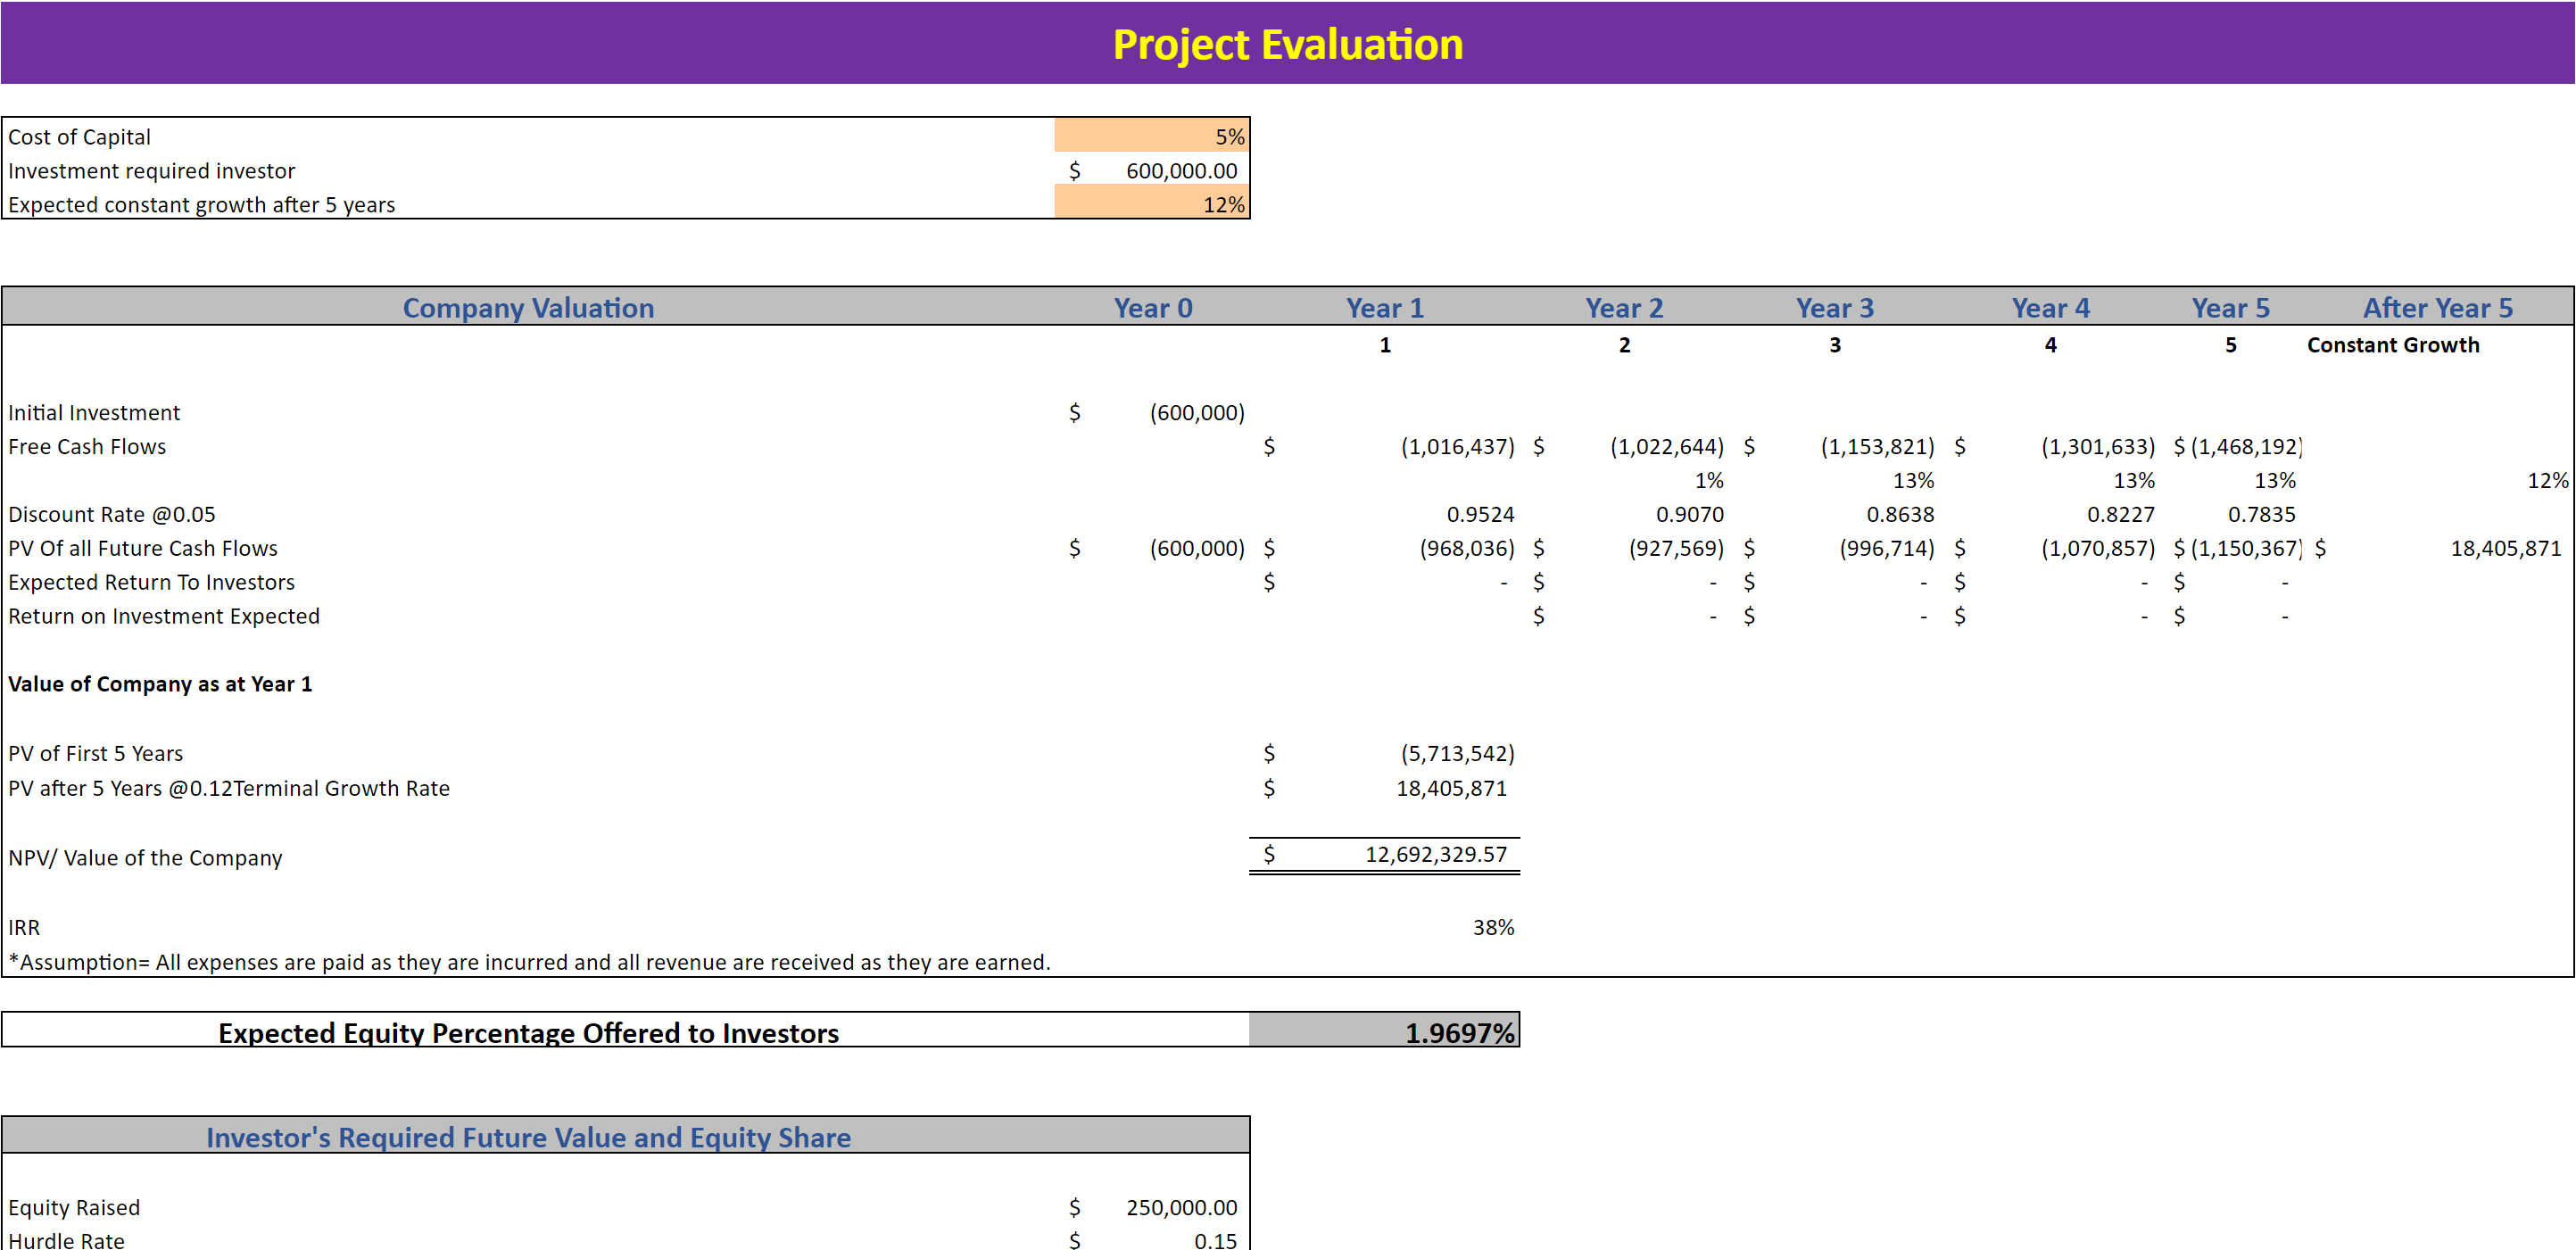
Project Evaluation
The table provided facilitates the evaluation of the company's performance by presenting important metrics such as Return on Investment, Investor's Future Equity Share, and Cash Burn Rate Analysis. This makes it easier for potential investors to analyze the company's potential.
The template also includes a marketing budget sheet that outlines various marketing channels and their corresponding costs. The sheet provides an estimate of the number of customers that can be expected from each channel. For instance, spending $2000 on Facebook marketing is projected to result in 1,000 active customers. Moreover, conversion rates from online sources can also be entered into the sheet.
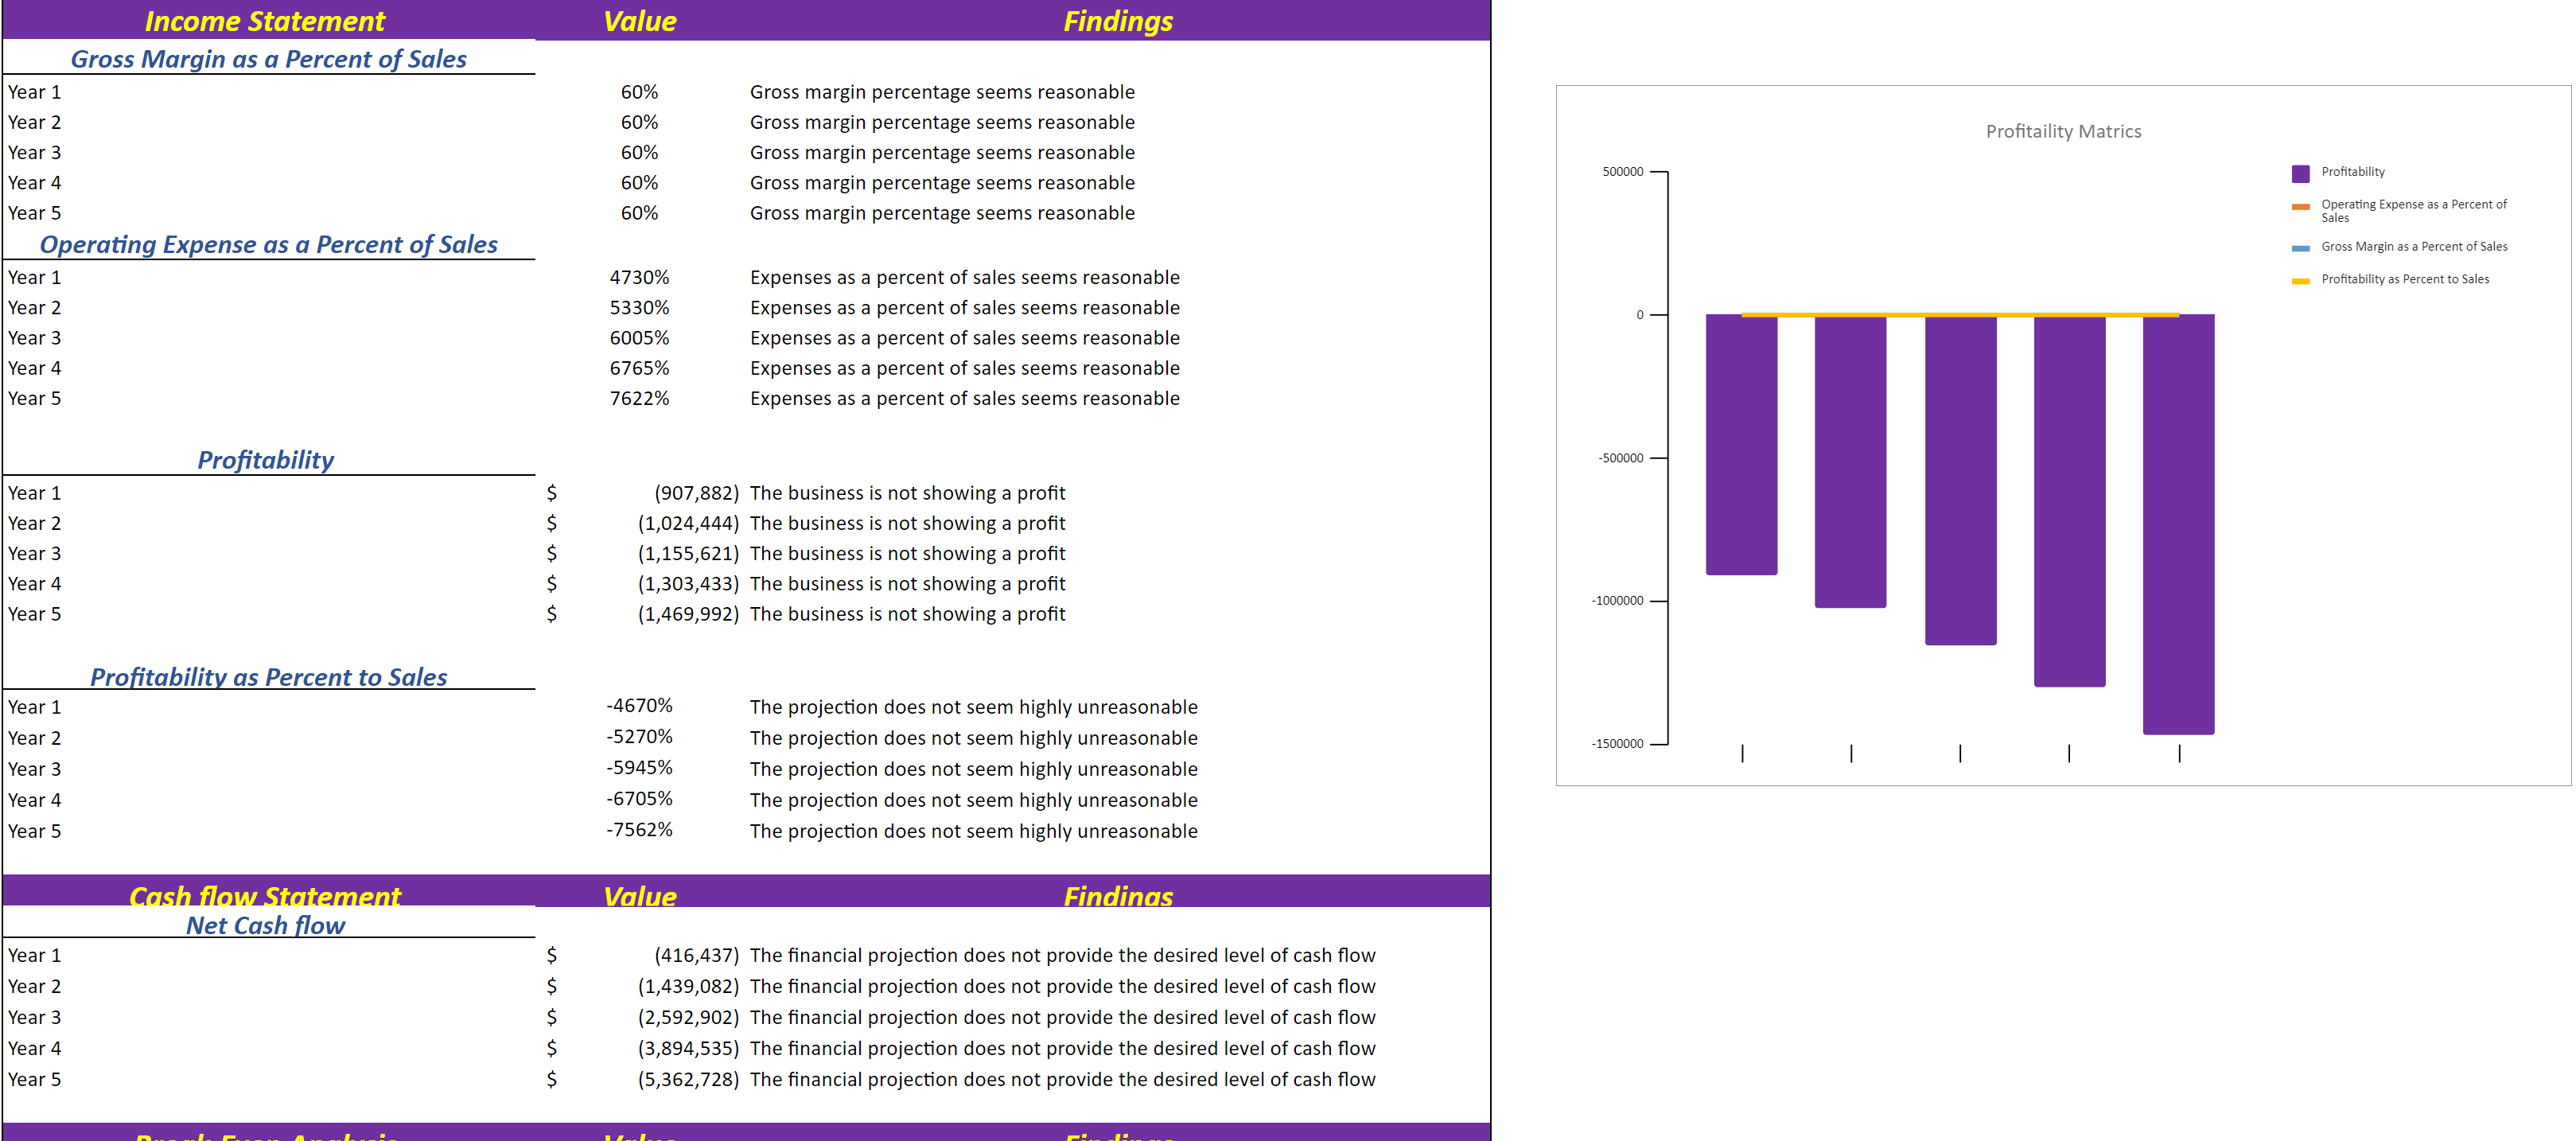
Diagnostic Sheet
This Diagnostic Sheet is a new inclusion in our financial model. This automatically explains the condition of the business. For example, if your Company’s profit is 30% of the total sales, the Sheet will include favorable comments. The Diagnostic Sheet is beneficial to give the Company’s insights in just one line.
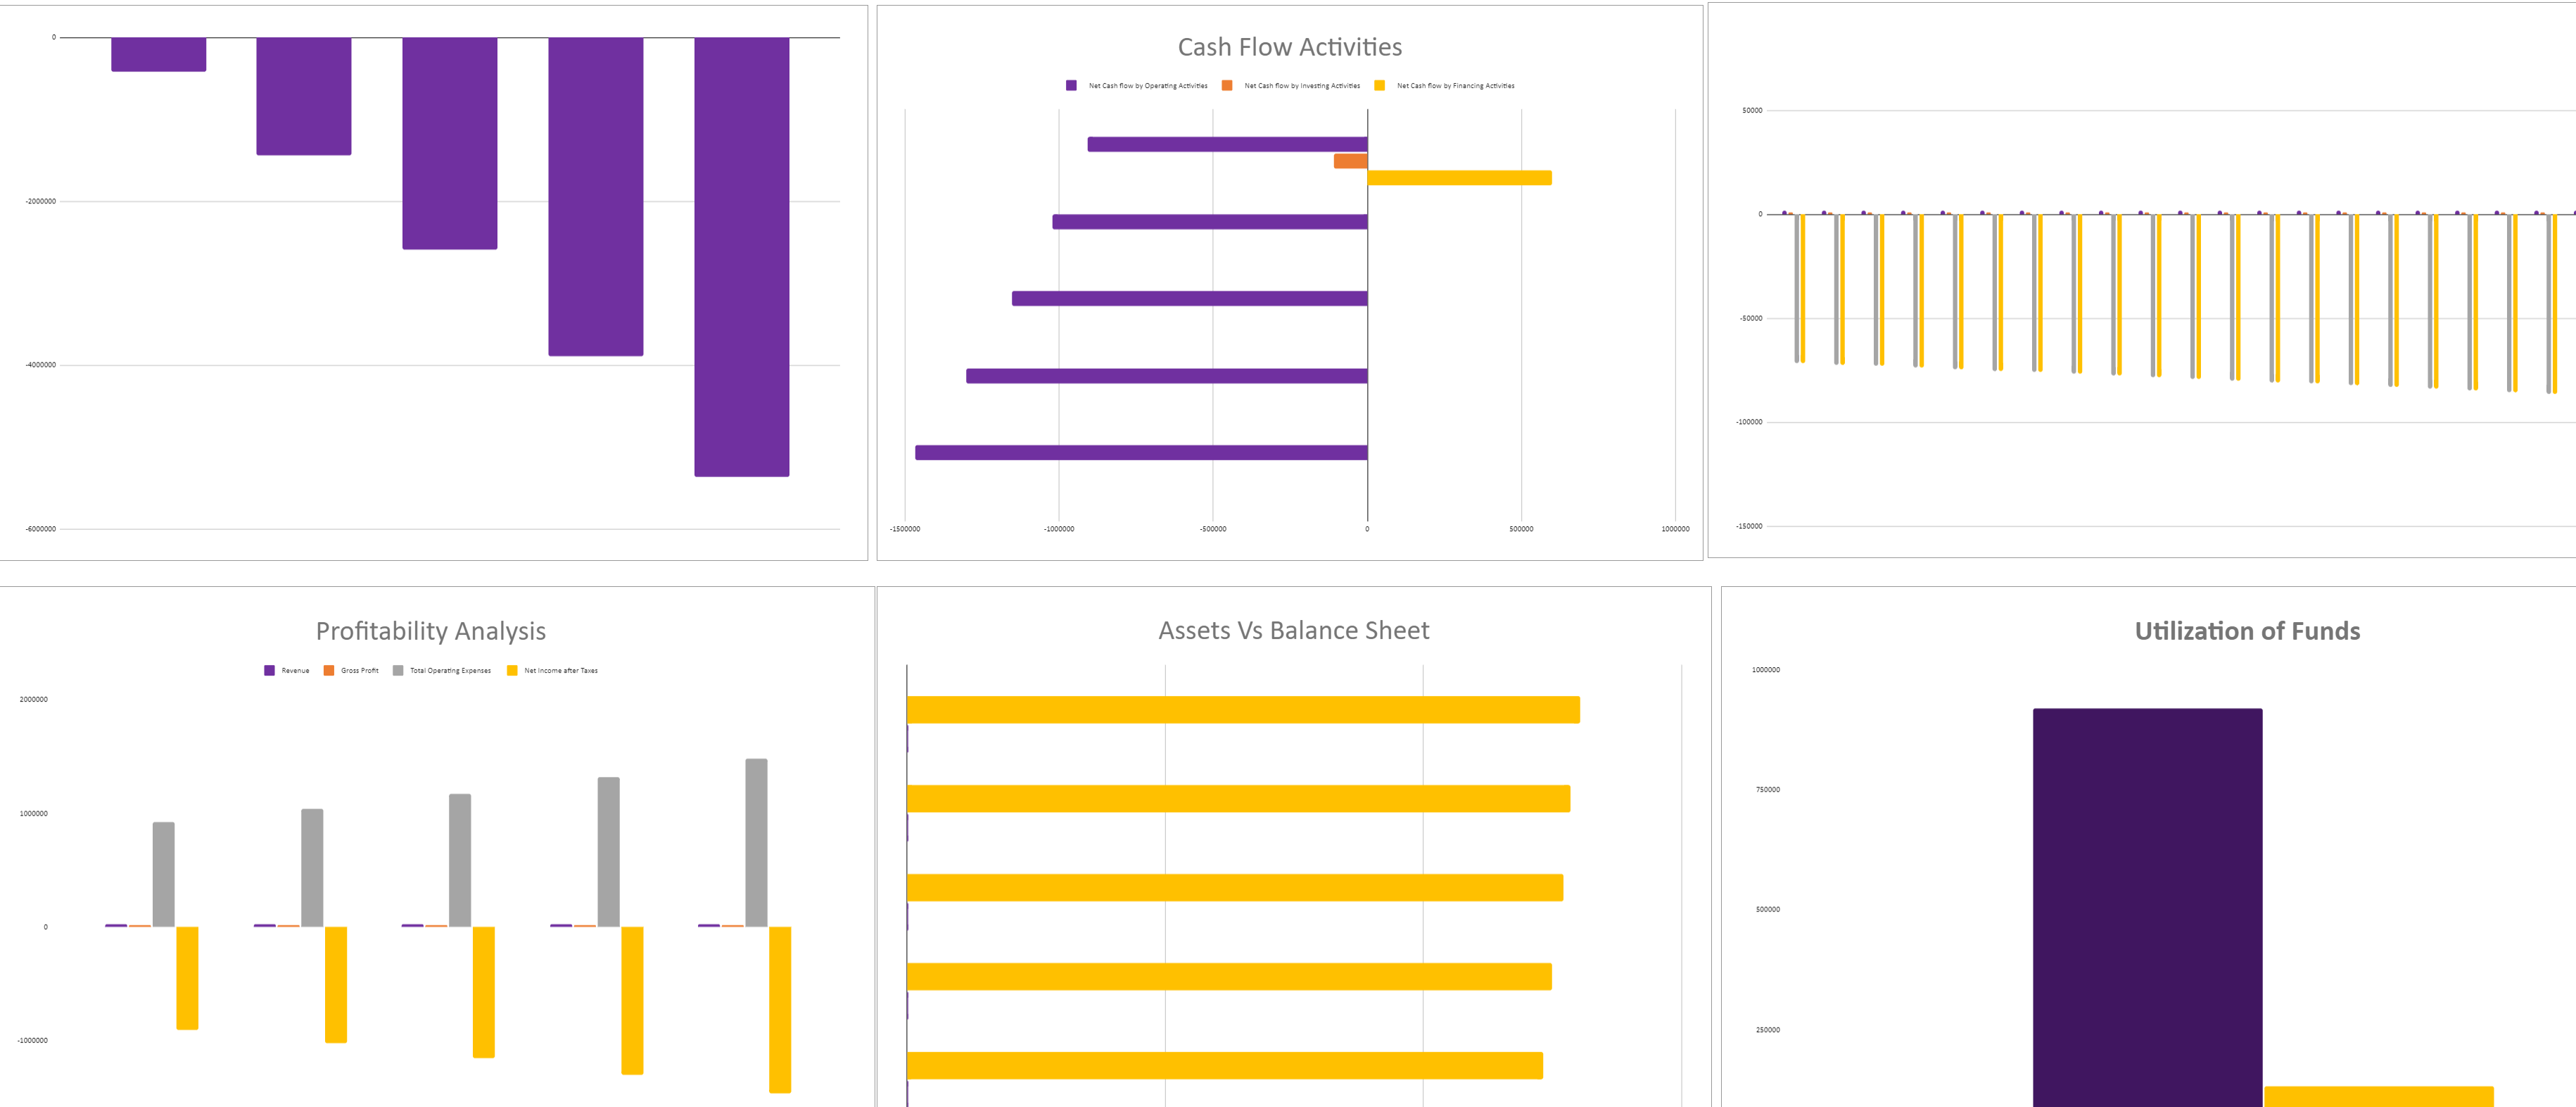
Dashboard
Users respond and process visual graphs better than data. Furthermore, this dashboard provides a graphical management tool that enables you to measure all your relevant financial KPIs, manage cash flow management, and track expenses, sales, and net revenue in detail to meet and outperform the objectives of your business.
Benefits of CBD Products Excel Financial Model
Encapsulate Company Performance- The CBD Products Financial Model analysis simplifies a company’s financial statements. It enables the user to express critical profitability and financial position information in just a few numbers. For example, the Company’s net profit margin encapsulates the net effect of a company’s revenues and all expenses. It will enable the user to conclude a company’s profitability without going through lengthy accounts statements.
Bottom Line – A CBD Products Financial Model can be the key to your Company’s better and informed future. Succeeding in planning your Company’s finances well will mean overall success in making wise investment decisions, purchasing the right operating assets, controlling costs, and determining company valuation.
Accommodates Investors – This model provides valuation and performance analysis charts. It enables the investors and banks to determine the Company’s worth considering lending funds to your Company.
Based on Financial Principles – We researched a CBD Products business model in-depth. So this financial model has logically correct financial and economic principles and assumptions.
Properly Integrated – The model assumptions and calculation have proper integration. So the change in the main Sheet will automatically lead to the change in all related sheets.
Visualization Tool – This will help you visualize the Financial Projections. This Financial model also prepares a clear communication of the quantitative outcomes. As obtained by calculations via various graphs and charts, the user does not need to pay much attention to the financial model’s inner workings.
New businesses have the opportunity to sell a variety of CBD products, as the industry continues to introduce new options. However, starting or expanding a CBD business requires hard work and effort, and navigating changing regulations adds to the uncertainty. Oak Business Consultant offers expert help in growing and selling CBD products, including a CBD Products Excel Financial Model that can aid in business planning.
The CBD Products Financial Model Template includes financial statements and relevant metrics such as Sensitivity Analysis, Break-even Analysis, Diagnostic Tools, Project evaluation, and Charts. By examining the structure of the model and clicking on specific input sheets, users can access relevant worksheets.
Input tab of CBD Products Excel Financial Model
The model requires financial information, such as sales price, cost, and expenses, to be inputted. Inputs are indicated by a Peach fill and grey letters, calls up (direct links from other cells) are filled in grey with black letters, while calculations are indicated by white and black. The sensitivity analysis tab displays a high-level report of the business's profitability in various scenarios of uncertainty, such as a 10% increase in costs or expenses.
The break-even analysis tab shows the amount of items to sell and their currency value required to break even. Revenues are calculated based on factors such as sales, pricing, marketing, and costs, with working capital assumptions factored in to measure the impact on business cycles. The PnL Monthly tab aggregates statements such as profit and loss, balance sheet, and cash flow on a monthly basis.
The Dashboard tab presents various graphs relating to revenues, cash analysis, break-even analysis, sensitivity, assets vs. liabilities, and startup summary.
Salient Features of this CBD Products Excel Financial Model
All at One Place:
The entrepreneurs will get the idea about business input assumptions bought together to visualize the complete picture.
One Row & One Formula:
Calculations in this Business Financial Model Template are dynamic, based on one formula per row. Therefore, users look at the first row vertically downward the model.
No Hard-Coded numbers
There are no Hardcoded numbers imbibed within the formula. However, the numbers in the input tab are appropriately referred to within each procedure used in this CBD Products Financial Model.
No Complex Calculations
We have organized all sheets of the Financial Model transparently. Hence inputs are referenced from their singular points of origin throughout the origin.
Formatting and Colors
Here, we will explain how the template works in different color ranges and what they represent. Then, you can feed the financial information for the model, such as sales price, cost, expenses, etc.
Key Inputs of CBD Products Excel Financial Model
The growth rate, Price, and Expense.
Prices and segmentation of revenue.
Marketing Budget Sheet
Revenue Assumptions
Average Payable & Receivable days your business is following.
Cost of Goods.
Fixed Asset and Capital Expenditure.
Tax Rate
Investment table
Loan table
Key Features of CBD Products Excel Financial Model
Input Sheet
The financial model template is designed with inputs that have a direct impact on the calculations across all sheets. As a result, any changes made to these inputs will be reflected in the final calculations, providing built-in flexibility for different outcomes. This feature is especially useful for financial projections.
Revenue Stream
This sheet contains products categorized by their prices and sales allocation. After allocating these products according to your business needs and sales, the entire model will automatically perform all the necessary calculations.
Startup Summary
The startup summary tab provides an overview of the total costs incurred at the start of the business, including capital expenditures, as well as the amount of cash that has been invested by the company to date. The tab also calculates the amount of investment required based on the number of months. The startup summary is a useful tool for evaluating the feasibility of your business idea and determining whether there are enough funds to support operations.
Monthly & Yearly Income Statement of CBD Products Excel Financial Model
The CBD Products Excel Financial Model is a valuable tool that provides a structured monthly and yearly income statement framework, which can be customized to fit your business's needs. The model is designed to provide an integrated financial overview that allows users to adjust any assumption in one part of the statement and see how it impacts all other parts of the statement accurately and consistently.
The monthly income statement sheet is particularly useful for those who require regular and detailed reporting. Gross and net earnings are linked to a revenue analysis sheet to ensure accurate reporting, and all revenue streams are included in the income statement. Oak Business Consultants understands the goals of every CBD Products business and has developed a mechanism to help business owners determine whether they are making profits. Furthermore, the Yearly Income Statement gives you complete insights into revenue and general & administrative expenses. The Yearly Income Statement also contains several graphs, assumptions, ratios, margins, net profit, earnings, cost of services, and profit after tax.
Balance Sheet
The presented financial statement offers the opportunity to assess the status of your current and fixed assets, liabilities, and equity. In addition, it facilitates the monitoring of accounts receivable, accounts payable, and accrued expenses. As a result, this particular financial tool provides an ideal platform for analyzing your essential balance sheet accounts.
Cash Flow
The Cash Flow Statement is a crucial component of the trio of financial statements that disclose the cash inflows and outflows within a particular timeframe. Serving as a link between the income statement and the balance sheet, this statement illustrates how cash has been utilized and generated in the business.
Three main sections of the Cash flow Statement:
Operating Activities: We have included all cash in and out related to the operations of the business
Investing Activities: Any cash from the disposal of an asset and acquisition and investments has been included in this section connected to the inputs and asset tab.
Financing Activities: We have separately made a loan-related tab where you can enter all loan-related information. The bill has a link to the Financing Activities of Cash Flow Statement.
The Cashflow Statement in our Model contains a dedicated sheet to monitor and analyze your Company’s cash-ins and out. The cash flow statement is based on several key inputs: Payable and Receivable Days, yearly income, working capital, long-term debt, net cash, etc.
Break-Even Analysis
The Break-even analysis incorporated into our Financial Model allows for assessing the financial impact of various scenarios. For instance, if the marketing budget is increased or a new employee is added to the payroll, the Break-even analysis can help determine the additional sales required to offset the expense. Essentially, this analysis calculates the point at which the total sales revenue equals the fixed cost, resulting in neither profit nor loss. The Break-even analysis relies on marginal costing, which fluctuates depending on the level of output activity. By using this analysis, one can quickly identify the profits generated at different sales levels.
Project Evaluation
The table provided facilitates the evaluation of the company's performance by presenting important metrics such as Return on Investment, Investor's Future Equity Share, and Cash Burn Rate Analysis. This makes it easier for potential investors to analyze the company's potential.
The template also includes a marketing budget sheet that outlines various marketing channels and their corresponding costs. The sheet provides an estimate of the number of customers that can be expected from each channel. For instance, spending $2000 on Facebook marketing is projected to result in 1,000 active customers. Moreover, conversion rates from online sources can also be entered into the sheet.
Diagnostic Sheet
This Diagnostic Sheet is a new inclusion in our financial model. This automatically explains the condition of the business. For example, if your Company’s profit is 30% of the total sales, the Sheet will include favorable comments. The Diagnostic Sheet is beneficial to give the Company’s insights in just one line.
Dashboard
Users respond and process visual graphs better than data. Furthermore, this dashboard provides a graphical management tool that enables you to measure all your relevant financial KPIs, manage cash flow management, and track expenses, sales, and net revenue in detail to meet and outperform the objectives of your business.
Benefits of CBD Products Excel Financial Model
Encapsulate Company Performance- The CBD Products Financial Model analysis simplifies a company’s financial statements. It enables the user to express critical profitability and financial position information in just a few numbers. For example, the Company’s net profit margin encapsulates the net effect of a company’s revenues and all expenses. It will enable the user to conclude a company’s profitability without going through lengthy accounts statements.
Bottom Line – A CBD Products Financial Model can be the key to your Company’s better and informed future. Succeeding in planning your Company’s finances well will mean overall success in making wise investment decisions, purchasing the right operating assets, controlling costs, and determining company valuation.
Accommodates Investors – This model provides valuation and performance analysis charts. It enables the investors and banks to determine the Company’s worth considering lending funds to your Company.
Based on Financial Principles – We researched a CBD Products business model in-depth. So this financial model has logically correct financial and economic principles and assumptions.
Properly Integrated – The model assumptions and calculation have proper integration. So the change in the main Sheet will automatically lead to the change in all related sheets.
Visualization Tool – This will help you visualize the Financial Projections. This Financial model also prepares a clear communication of the quantitative outcomes. As obtained by calculations via various graphs and charts, the user does not need to pay much attention to the financial model’s inner workings.
This Best Practice includes
1 Excel File(11 Tabs)
Further information
The objective of The Oak Business Consultant's CBD Products Excel Financial Model is to provide a comprehensive and adaptable tool for financial planning in the CBD industry.
For CBD products business
