


Originally published: 11/04/2023 13:27
Publication number: ELQ-37452-1
View all versions & Certificate
Publication number: ELQ-37452-1
View all versions & Certificate

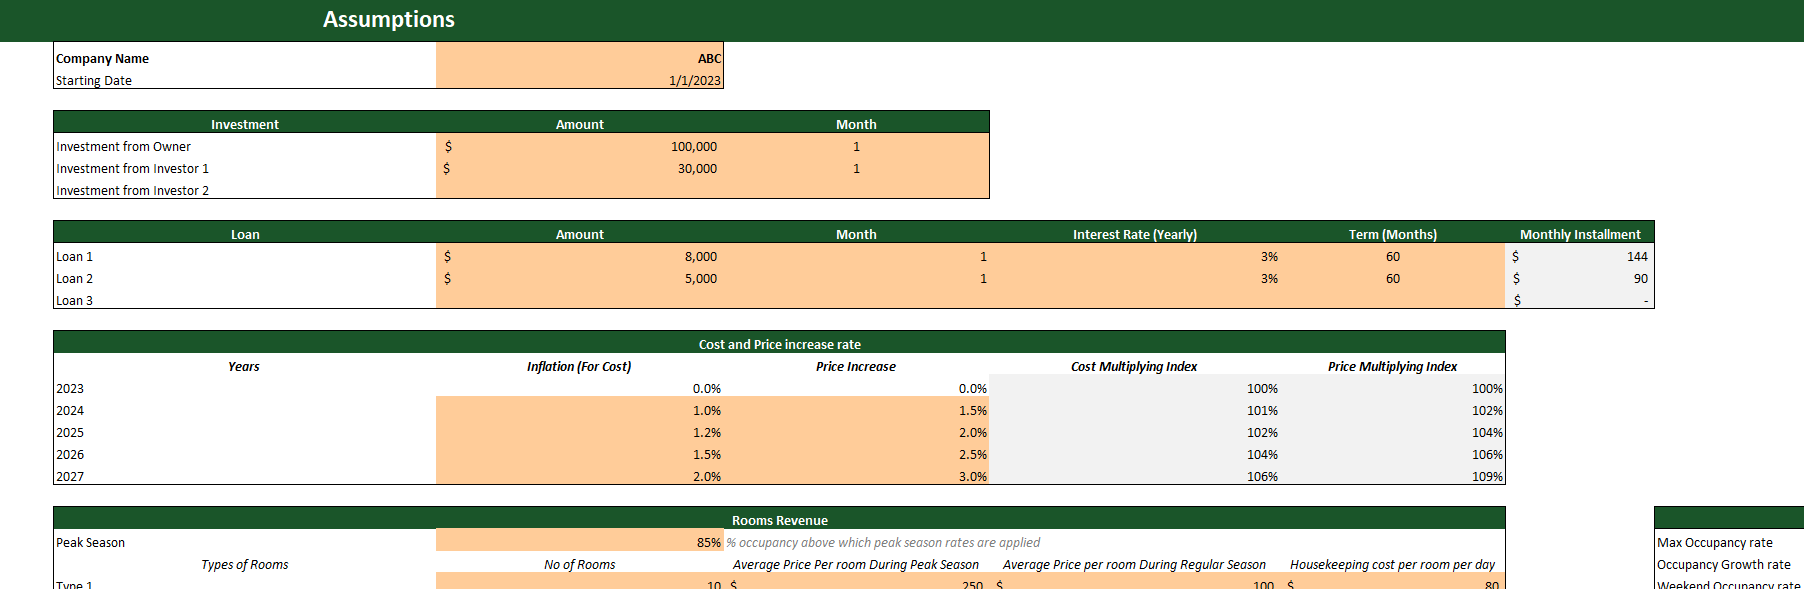
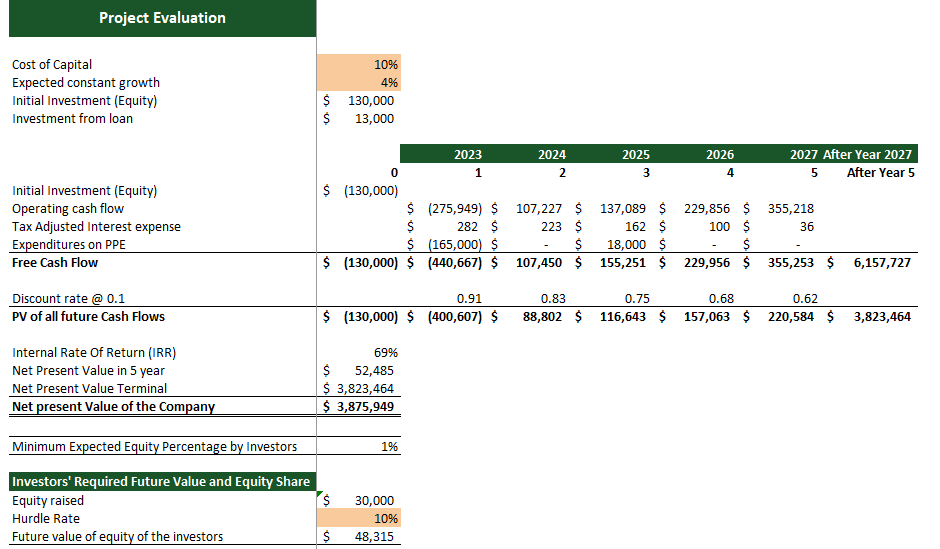
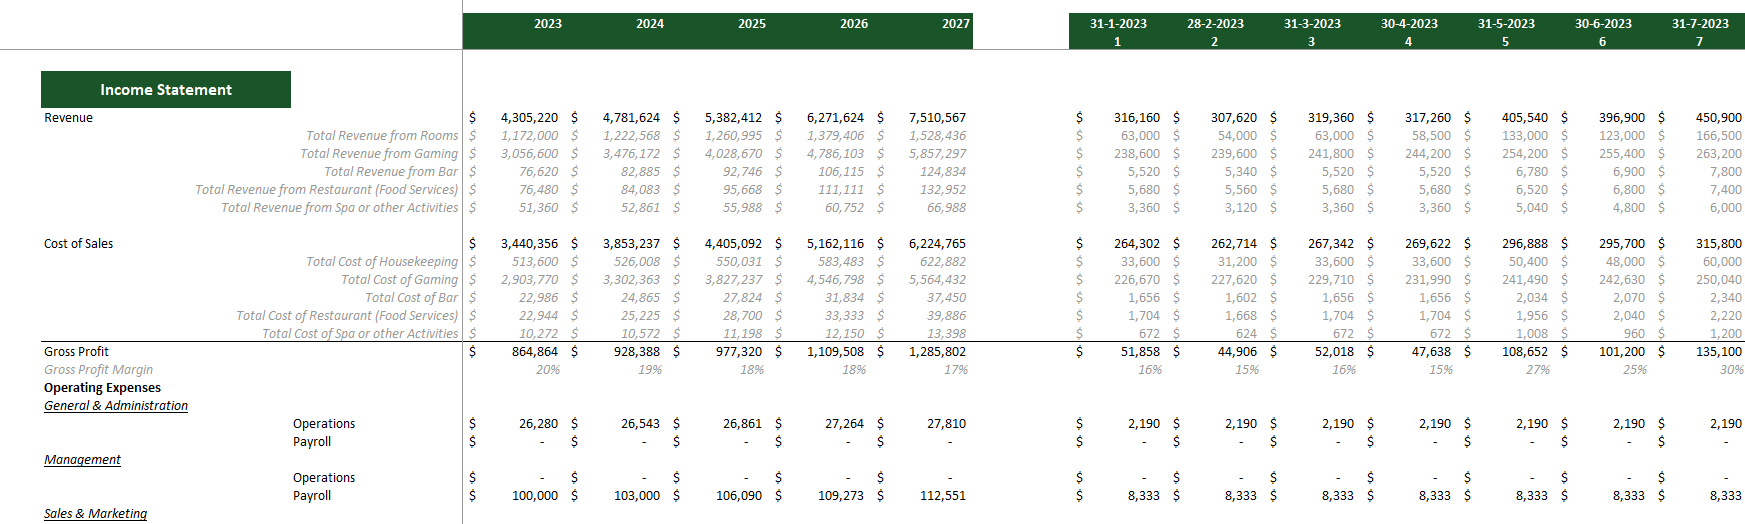
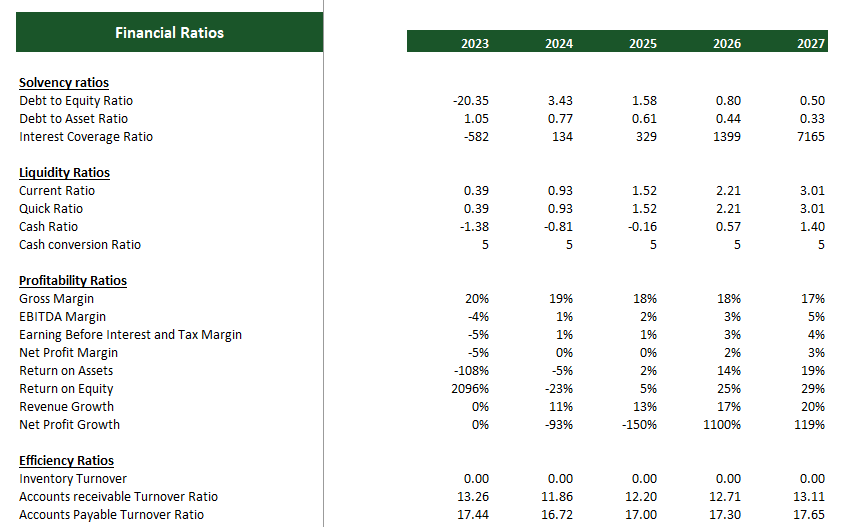
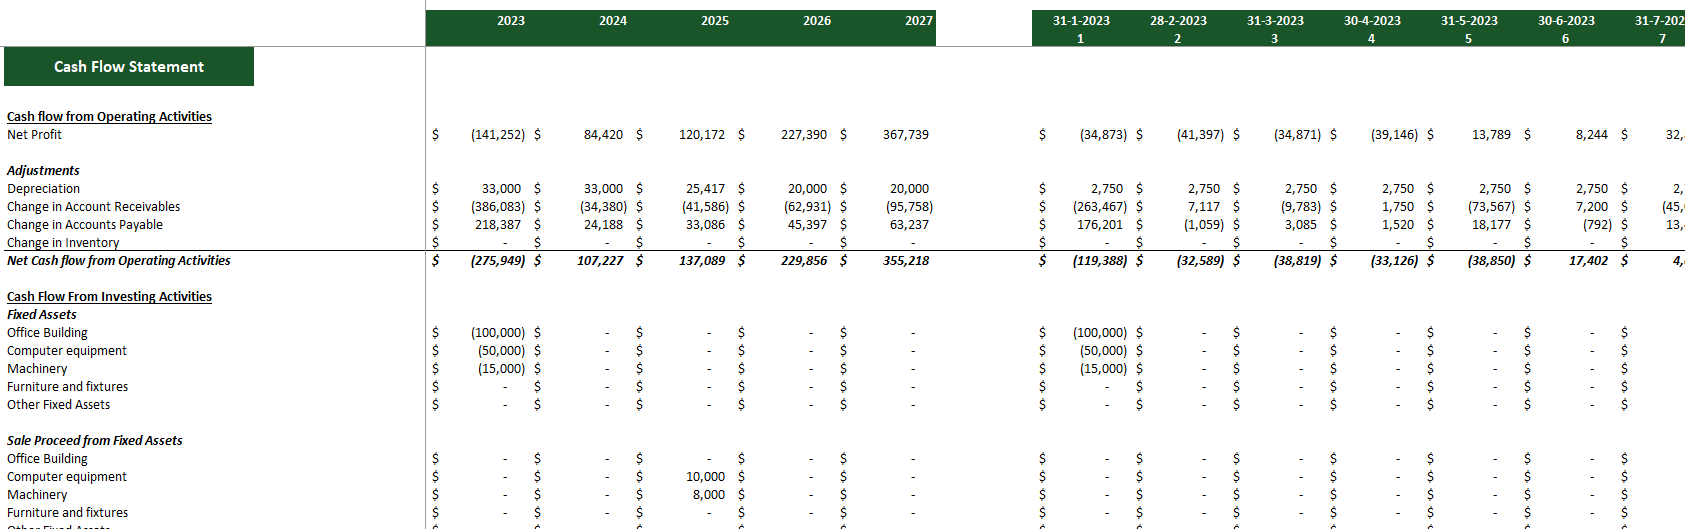
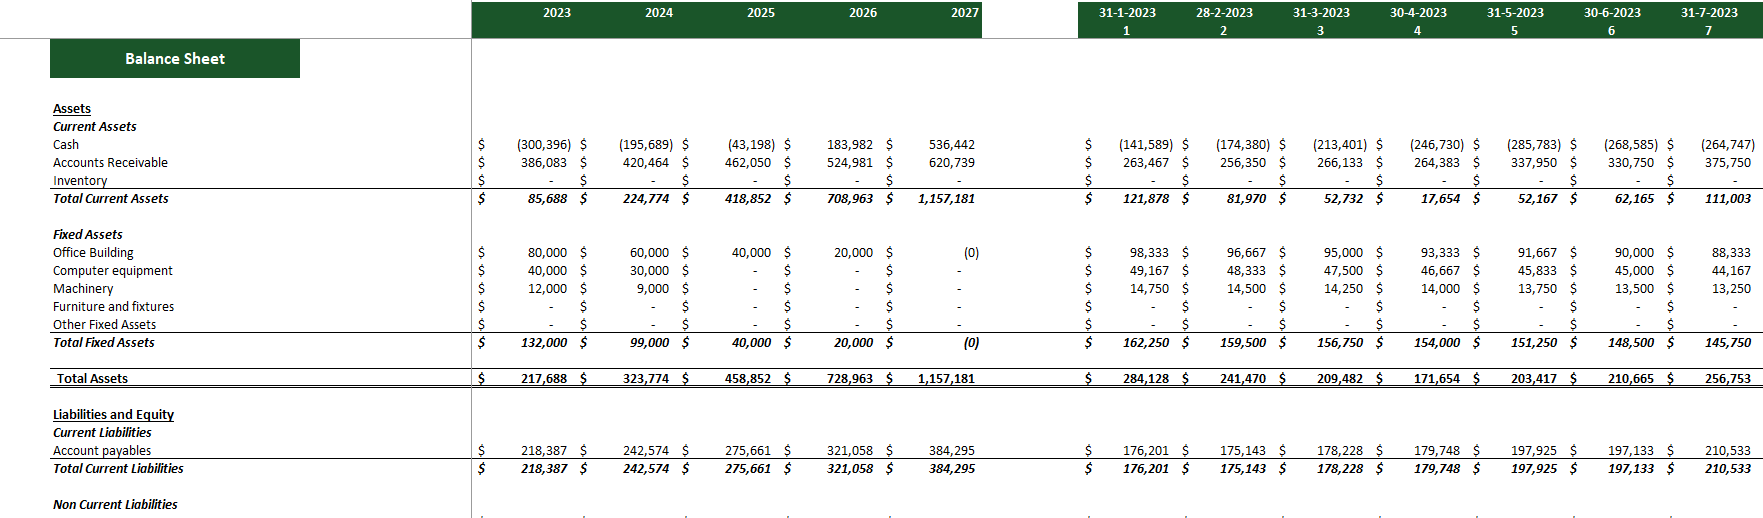
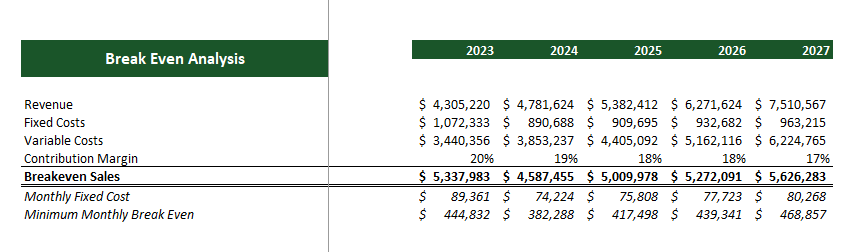
Casino Hotel Excel Financial Model
This model is easy to use, and properly integrated, meaning that the change in the input will result in a change of the other calculations linked with input.
Our mission is to be the industrial leader and pioneer in our business domainFollow 17
Further information
Currently, the revenue market size of casino hotels is more than 80 billion. The market size of casino hotels is projected to increase in the future. There is an excellent opportunity to start a casino hotel and get a few shares in the market size. Therefore, our experts have designed this Casino Hotel Excel Financial Model to help you seize this opportunity and grow in this expanding market.
