


Originally published: 18/10/2022 08:38
Publication number: ELQ-21821-1
View all versions & Certificate
Publication number: ELQ-21821-1
View all versions & Certificate

Real Estate Acquisition Portfolio Model (Buy - Upgrade - Rent - Exit)
Real Estate Acquisition Portfolio Model consists of a financial model in excel and an investment proposal in PowerPoint for the acquisition of properties.
Description
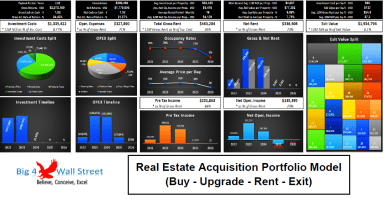
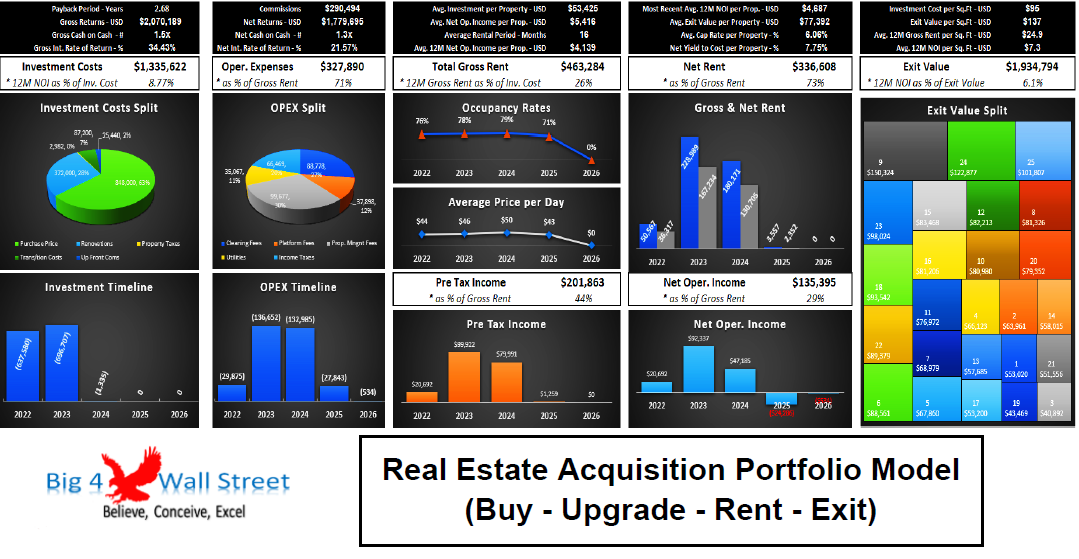
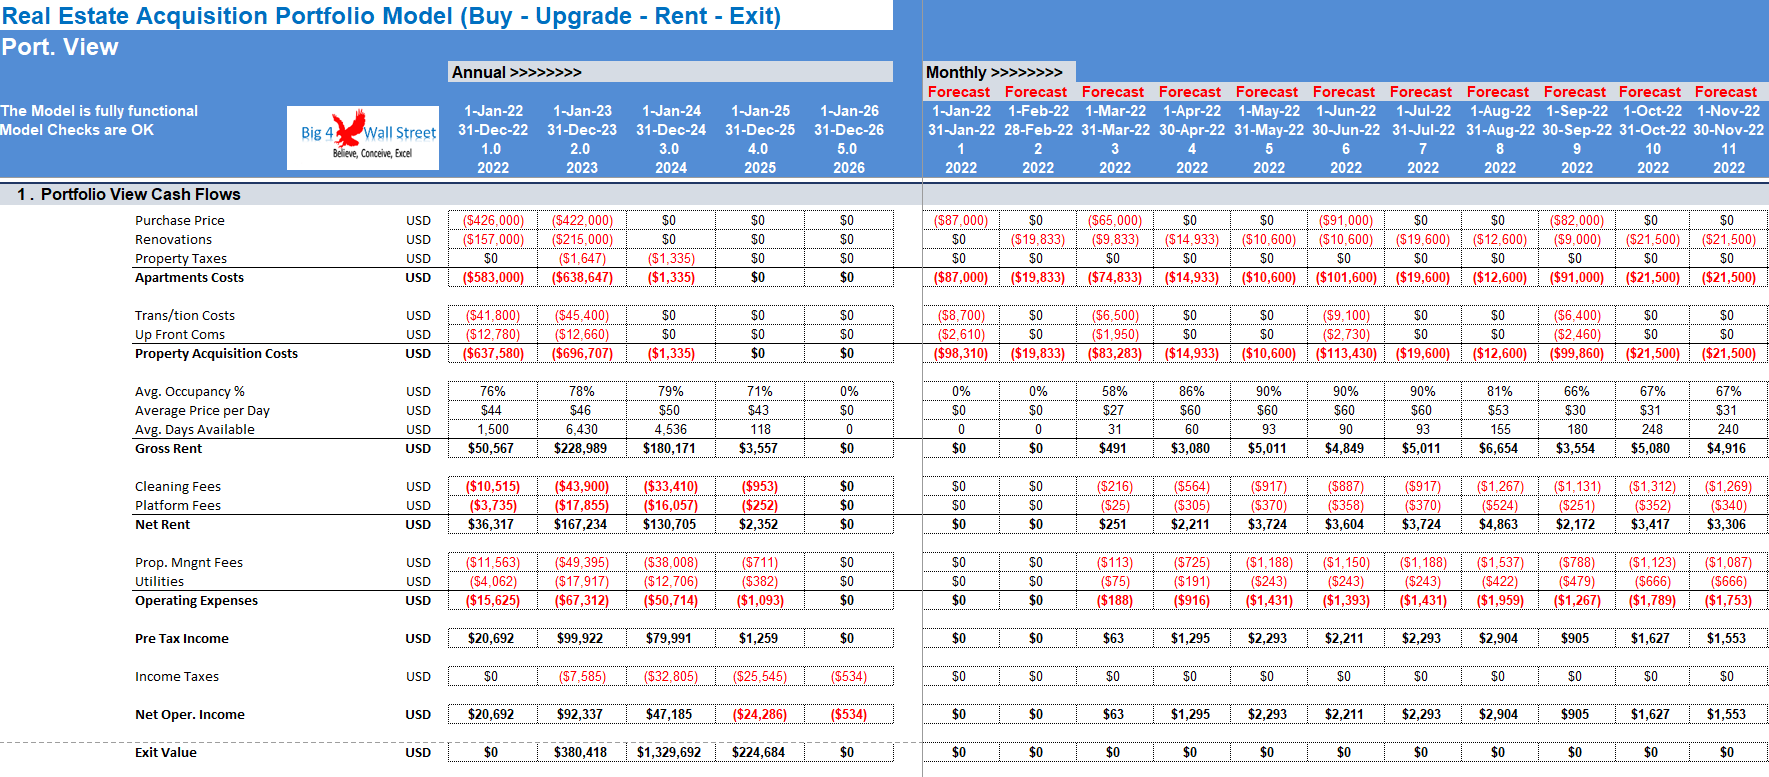
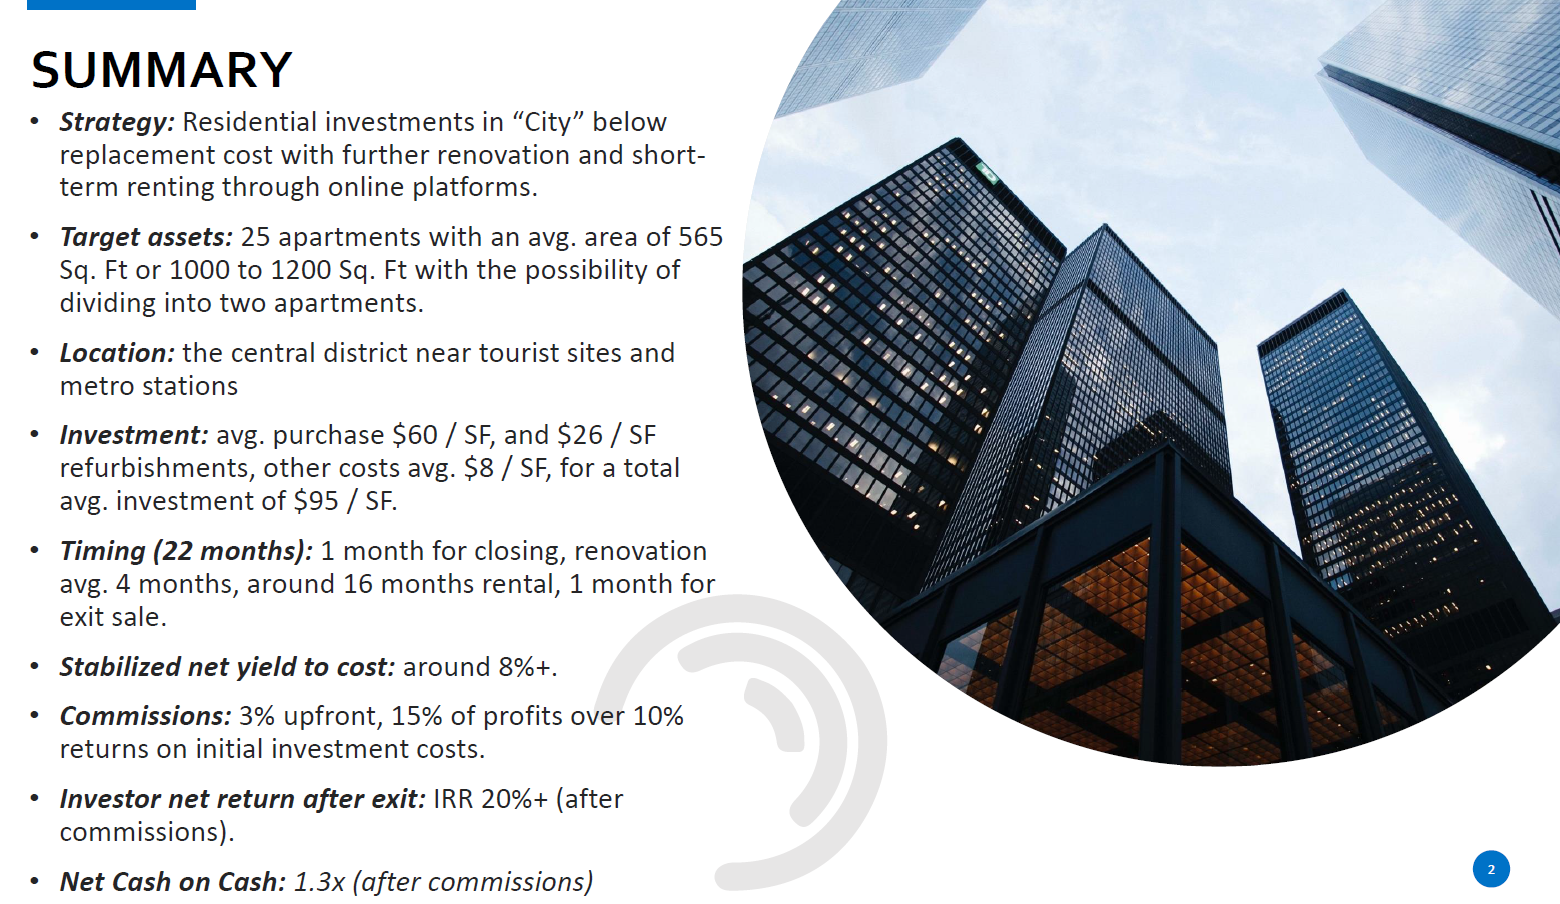
Real Estate Acquisition Portfolio Model consists of a financial model in excel and an investment proposal in PowerPoint for the acquisition of a real estate residential apartments portfolio at below replacement cost, with further renovation and short-term renting through online platforms, and exiting the investment as soon as the rental income has stabilized.
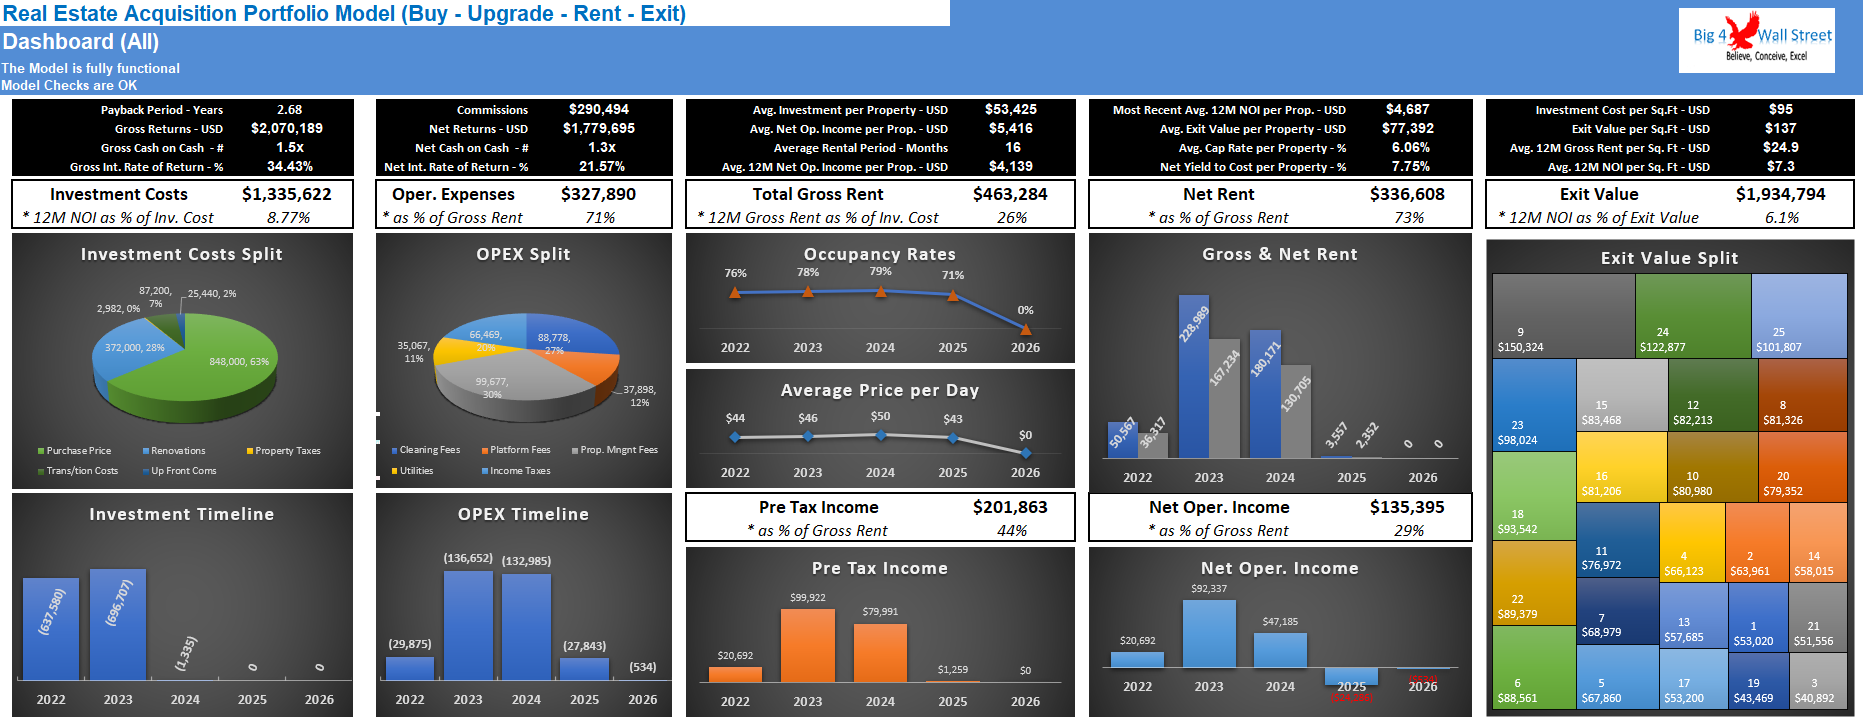
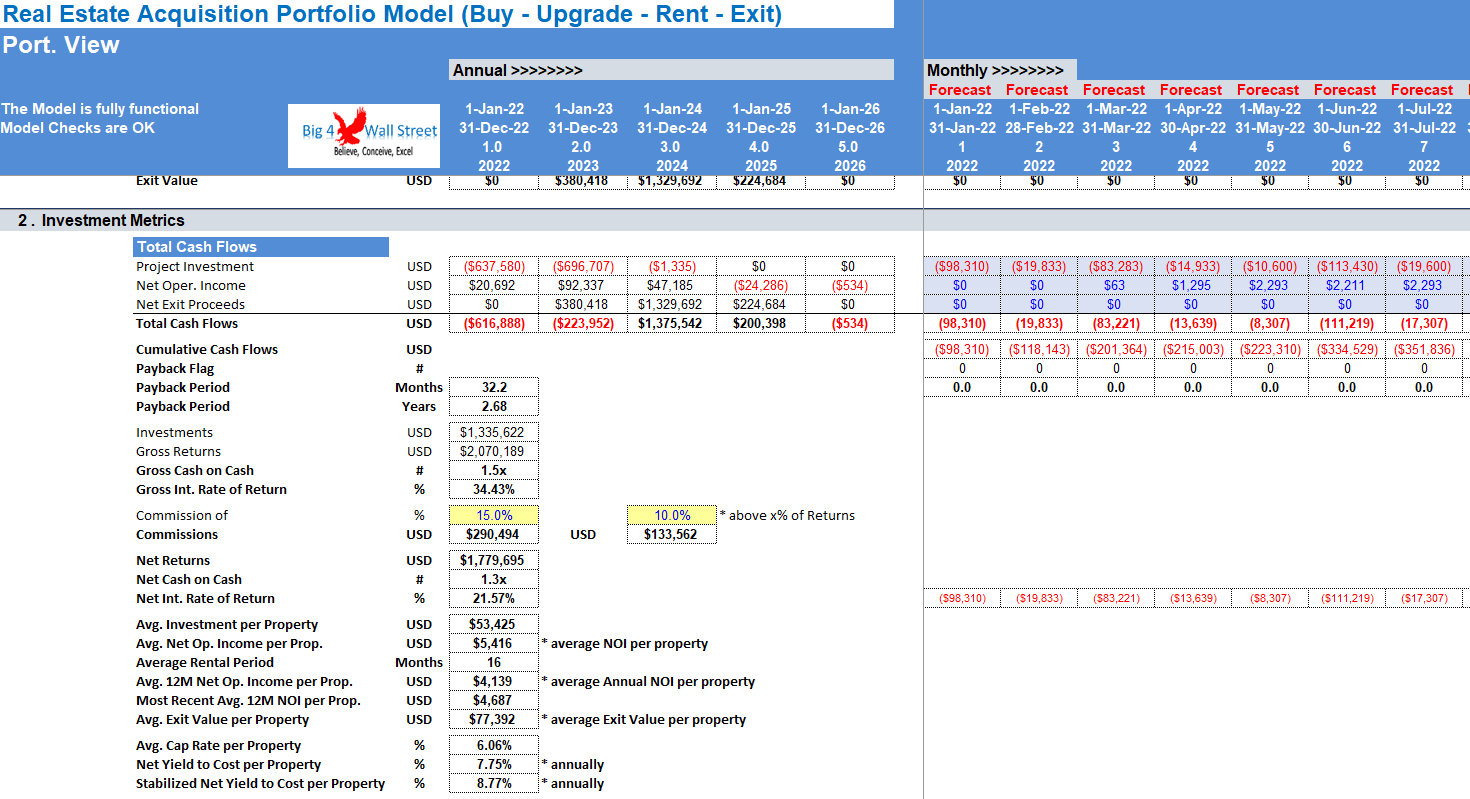
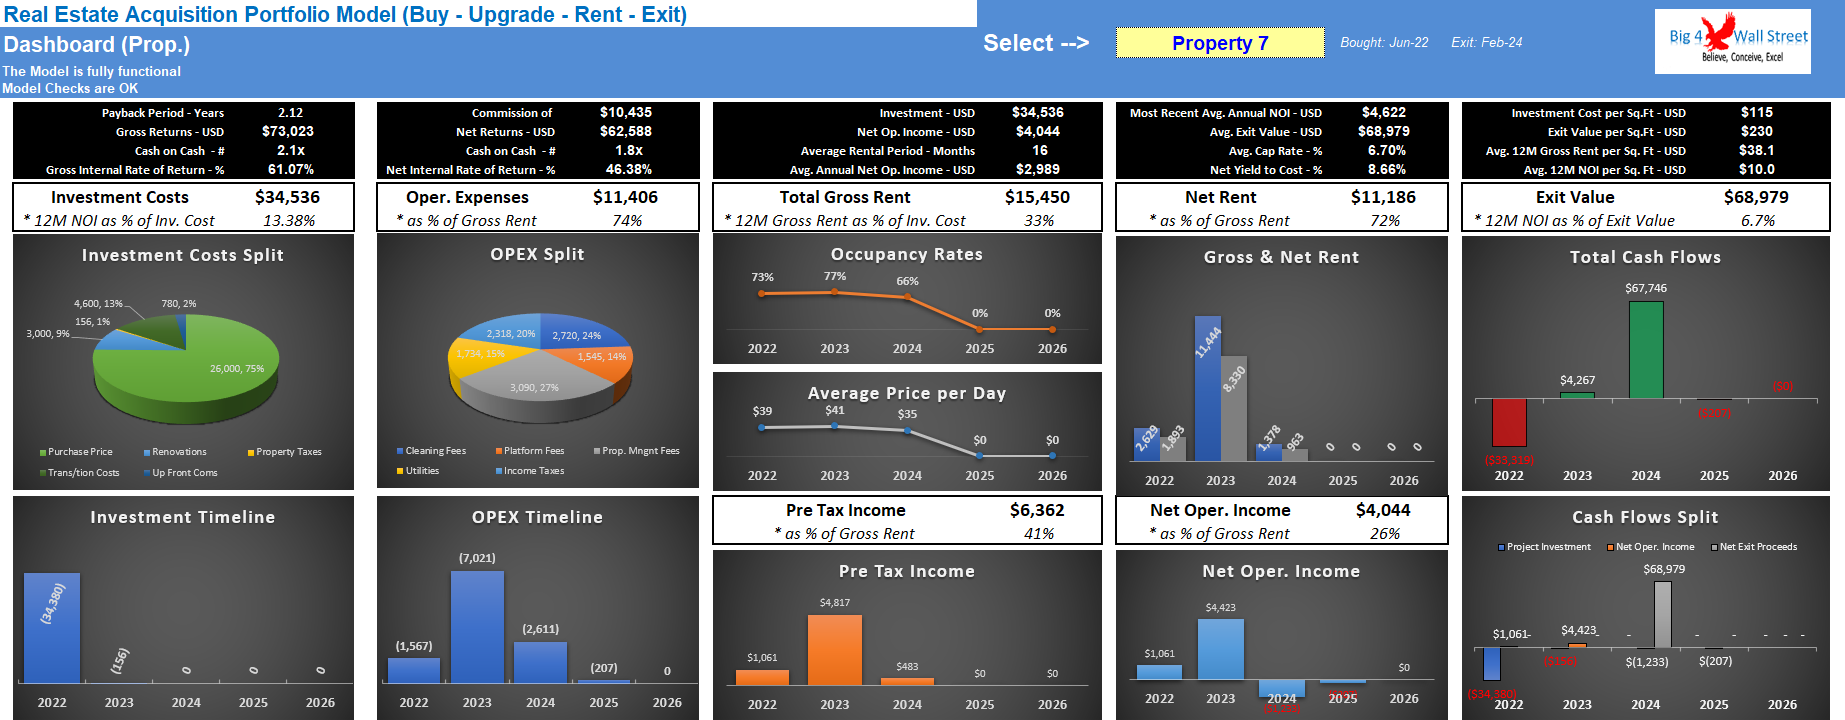
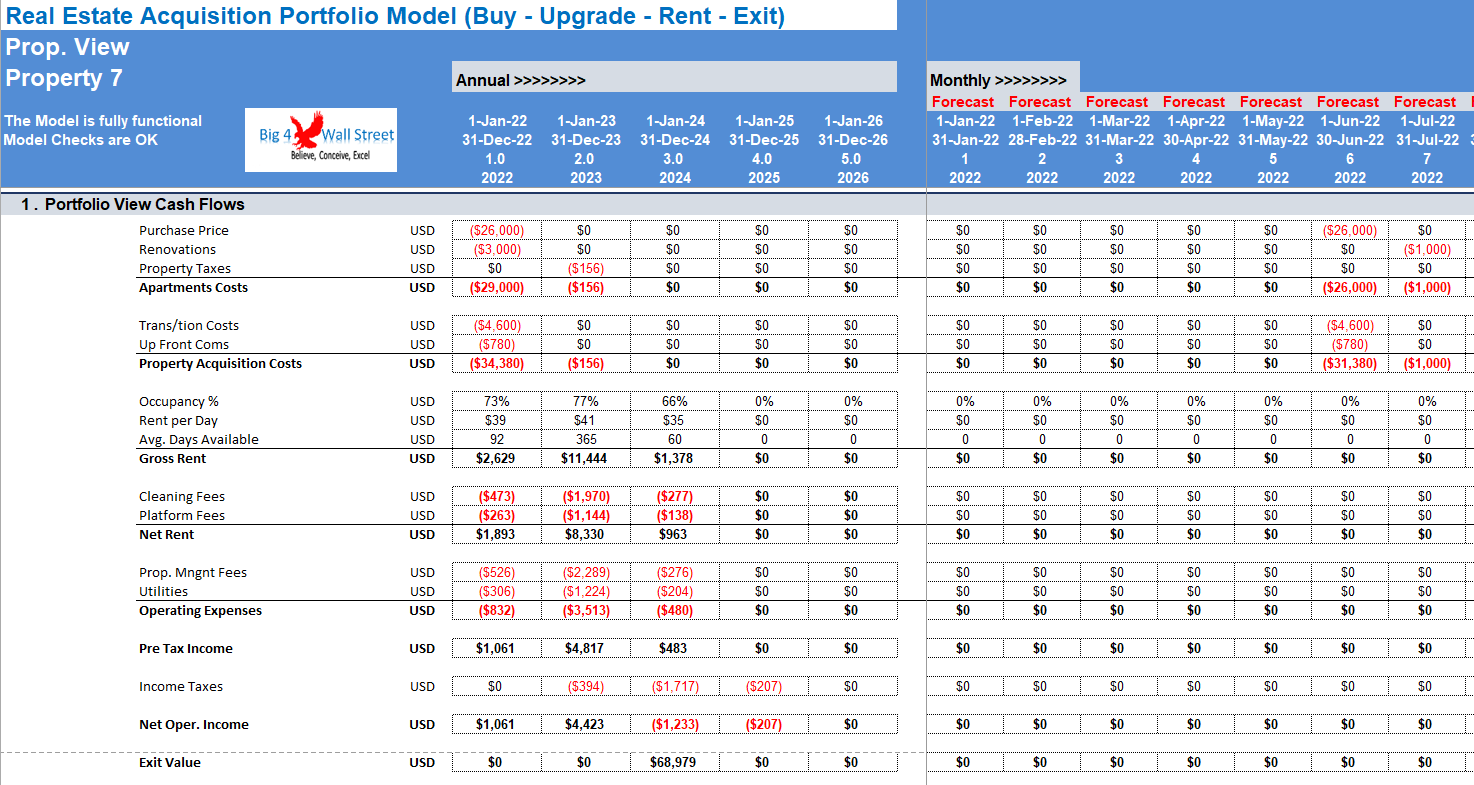
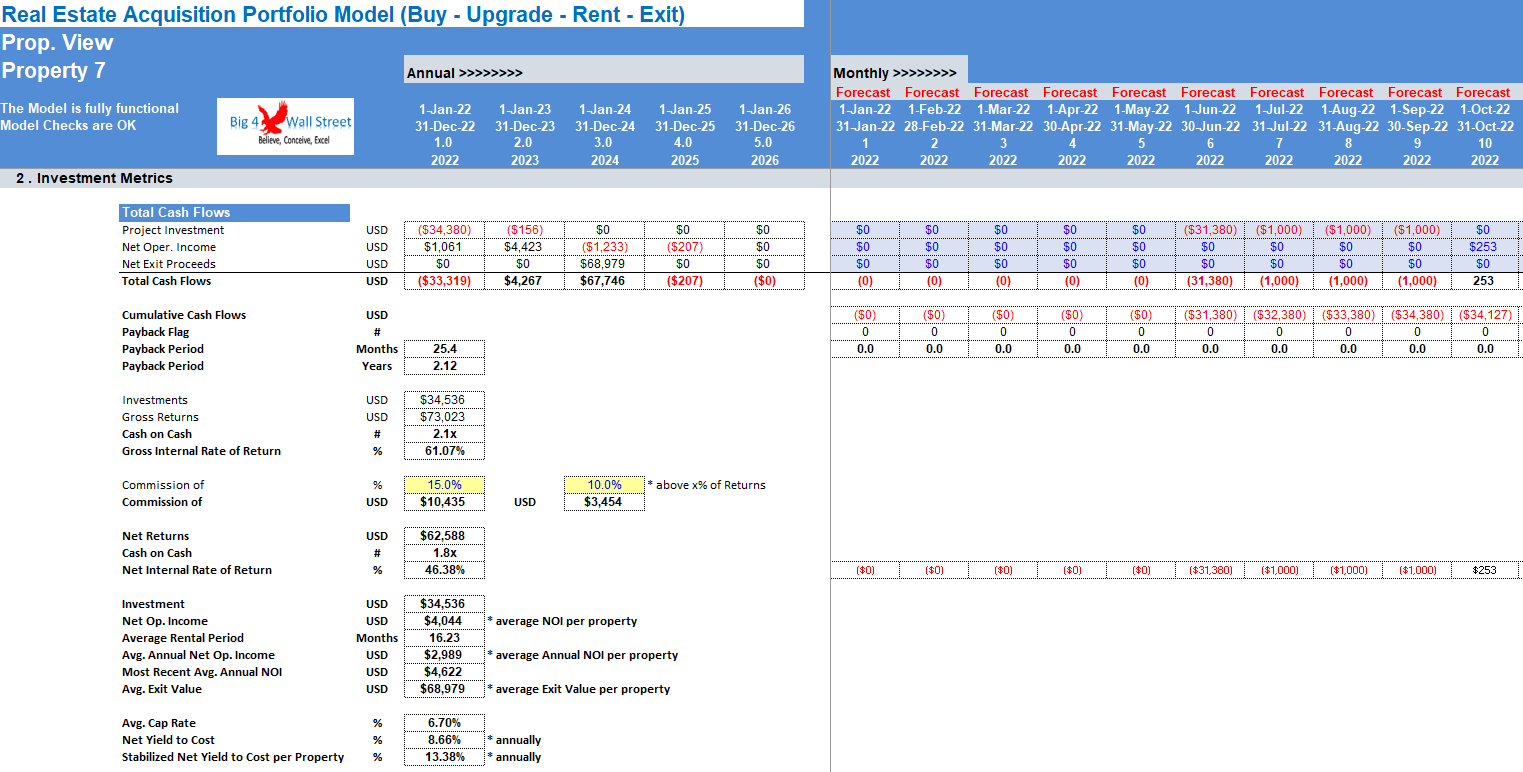
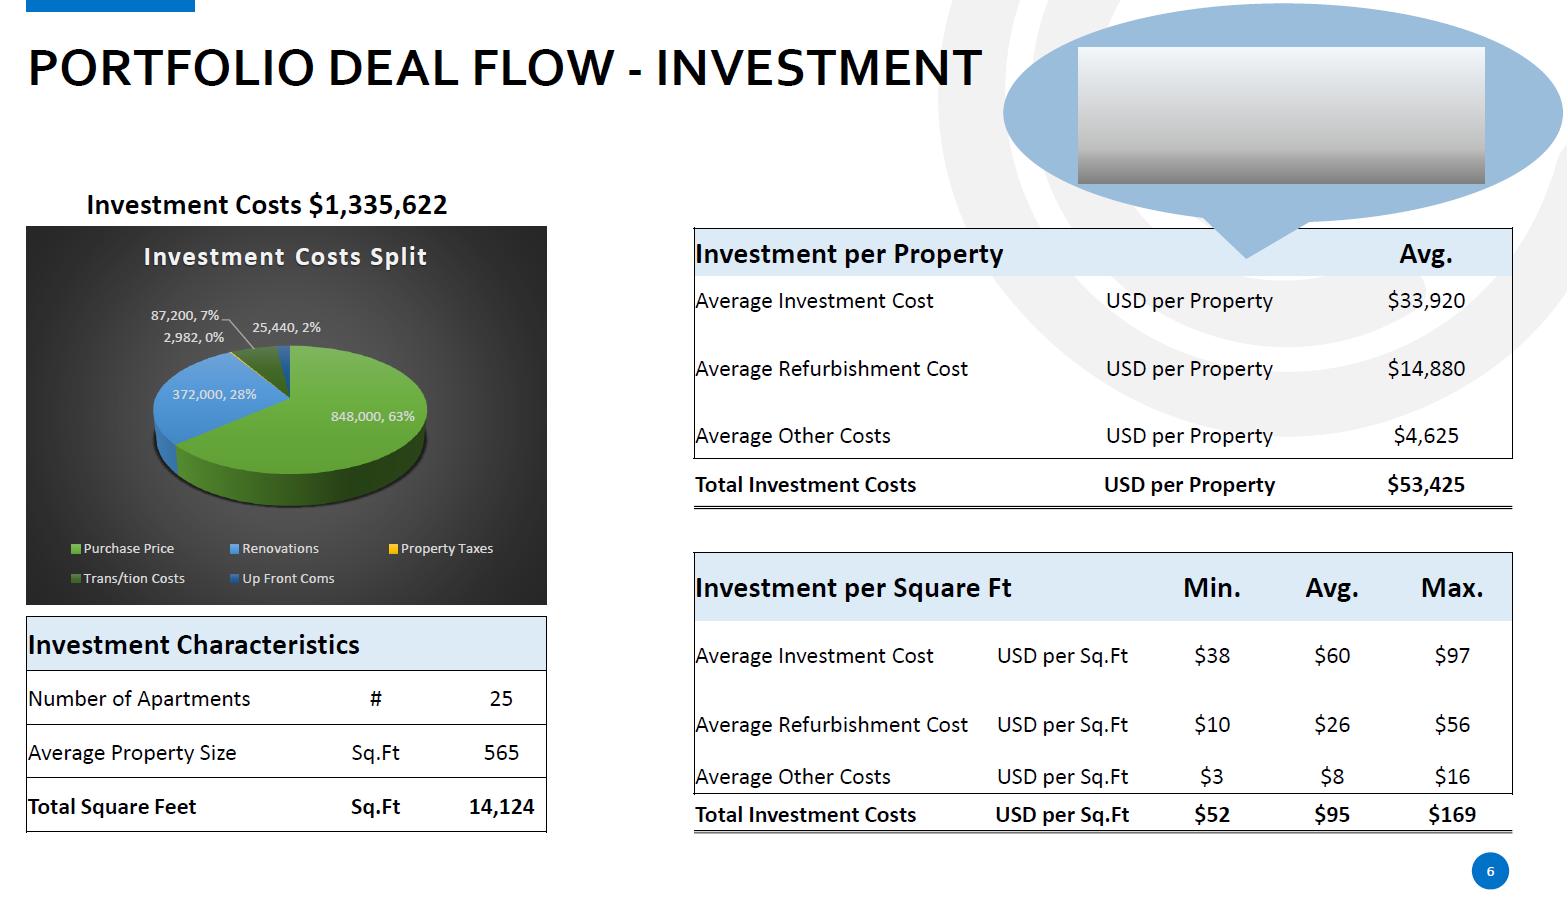
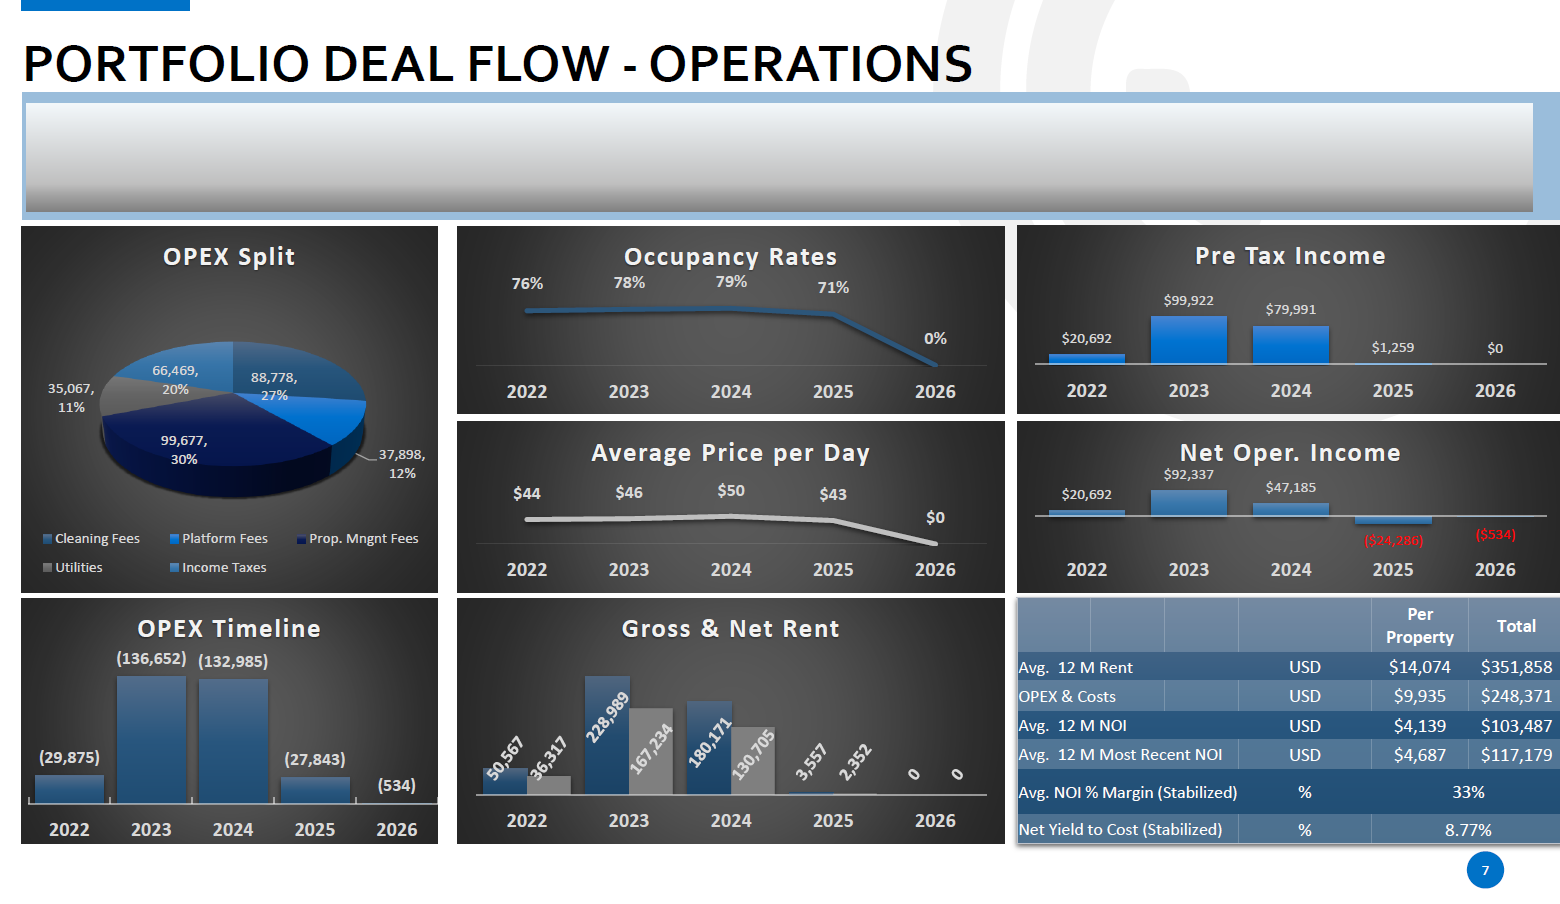
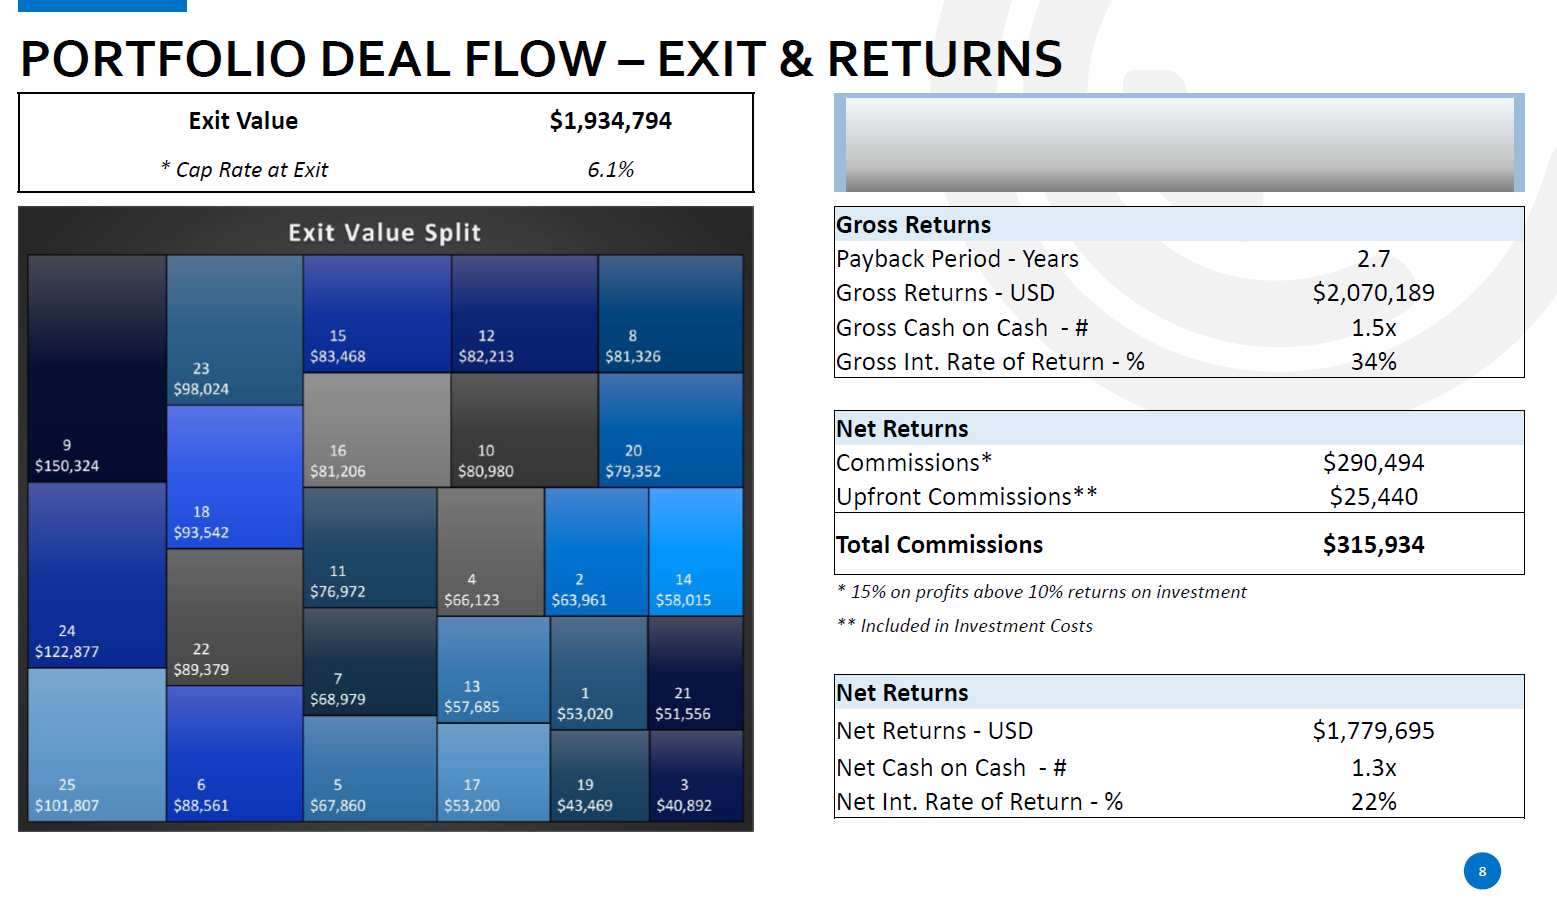
The model generates the cash flows of the portfolio investment, as well as the cash flows of each property separately. Various metrics are generated such as payback period, internal rate of return, cash on cash, net yield to cost, net returns, commissions. All the above are summarized in 2 dashboards: one for the whole portfolio and another for individual properties.
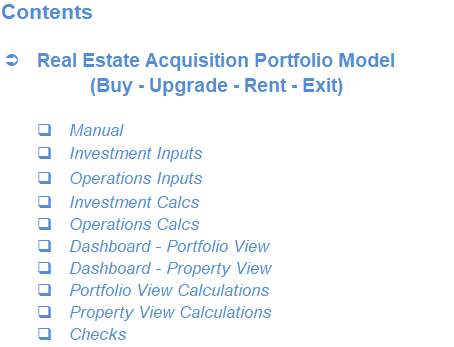
So, a quick overview of the model, in the contents tab you can see the structure of the model and by clicking on any of the headlines to be redirected to the relevant worksheet.
On the timing tab you can feed the general information for the model such as: project title, responsible, timeline of the model and date and currency conventions.
Additionally there is a description of the color coding of the model in the same tab. Inputs are always depicted with a yellow fill and blue letters, call up (that is direct links from other cells) are filled in light blue with blue letters while calculations are depicted with white fill and black characters.
There is also a color coding for the various tabs of the model. Yellow tabs are mostly assumptions tabs, grey tabs are calculations tabs, blue tabs are outputs tabs (that is effectively results or graphs) and finally light blue tabs are admin tabs (for example: the cover page, contents, and checks).
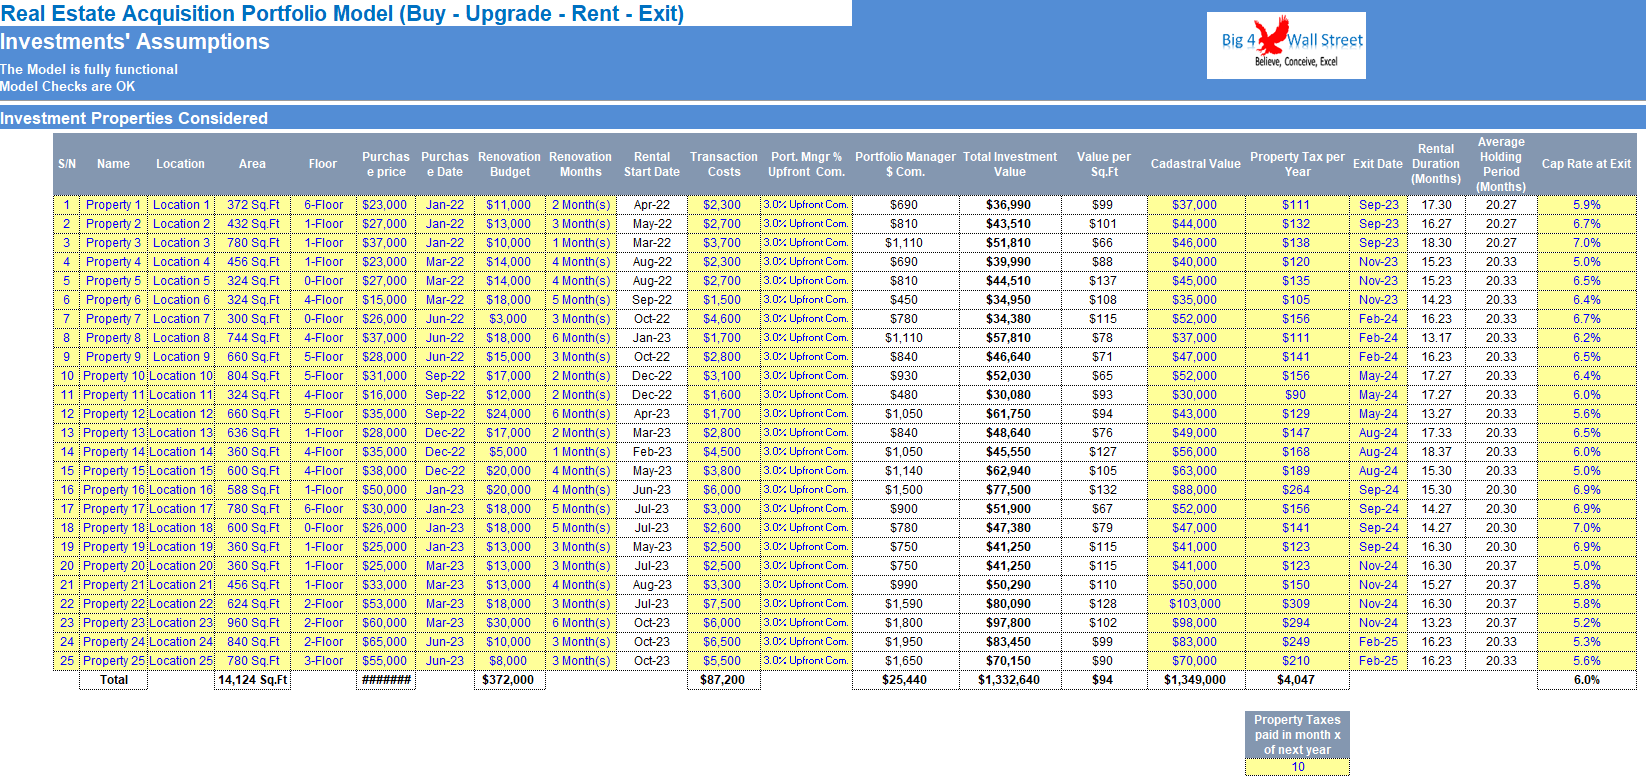
The are 2 tabs where the user input is needed: "Investments’ Assumptions", "Operations’ Assumptions". The user needs to fill the yellow cells in each of these tabs. In the Investments’ Assumptions, the user fills the property name, location, area size, floor, purchase price, purchase date, renovation budget and months needed, transaction costs, upfront commissions, cadastral value, property tax per year, exit date and cap rate at exit.
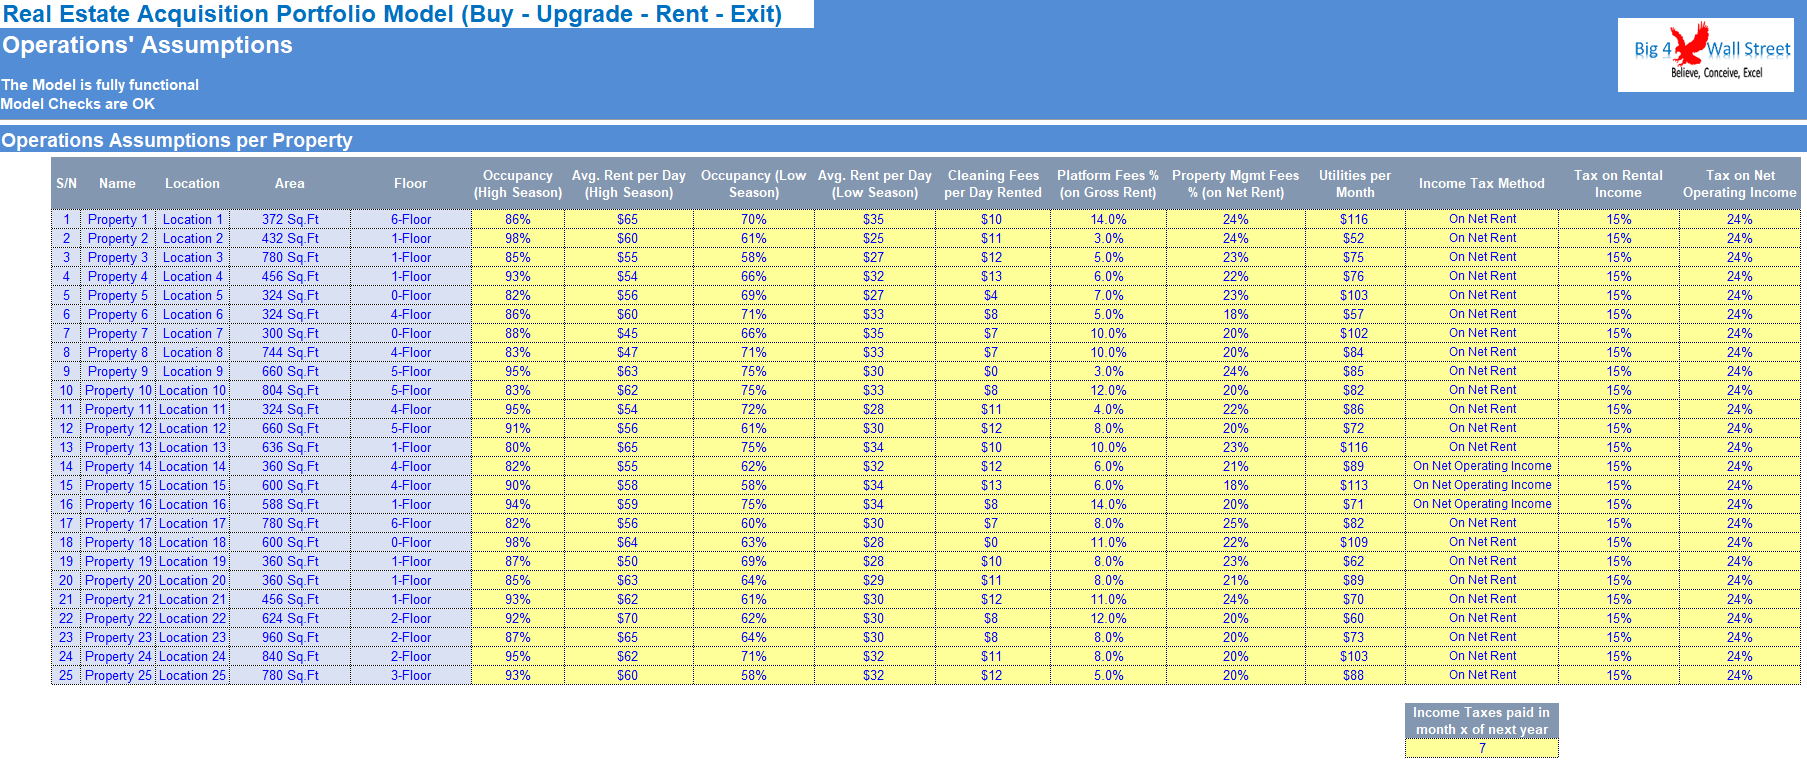
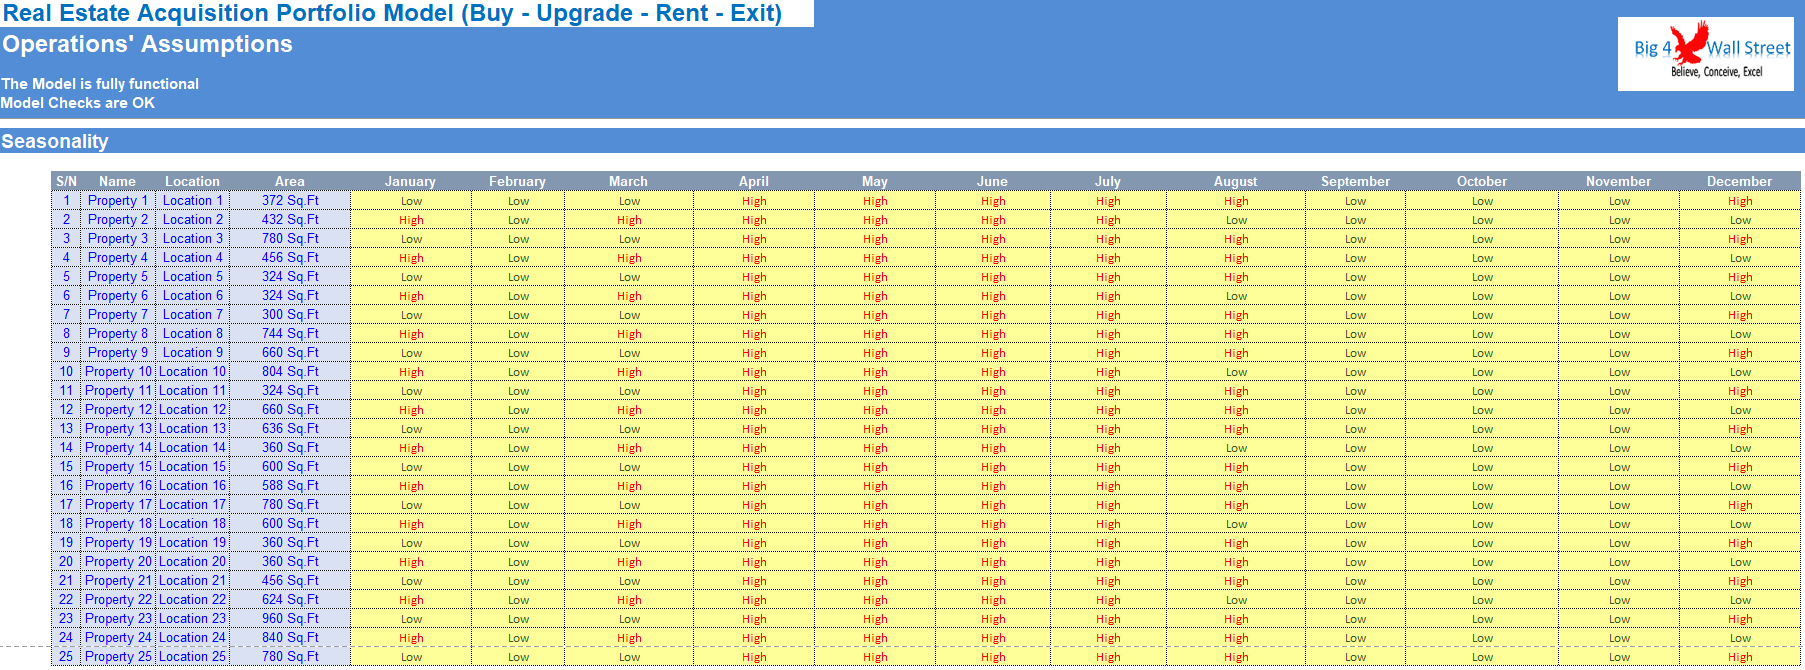
In the Operations’ Assumptions, the user needs to the property operational assumptions such as occupancy in high and low season, rent per day in high and low season, cleaning fees, platform fees, property management fees, utilities, income tax method, tax on rental income, and tax on net operating income. Additionally, the user needs to set the seasonality for each month of the year (low and high).
All the remaining tabs are automatically calculated from the assumptions that the user has set. The resulting tabs are the investment and operations calculations where all calculations are performed, the dashboards (for the entire portfolio, and for each property separately), and the detailed summary outputs across time on a monthly and yearly basis, for the portfolio and the individual properties (such as cash flows, and the various investment metrics).
Finally, the checks tab where the most critical checks are aggregated. Whenever you see an error message in any page, you should consult this page to see where the error is coming from.
Moving on to the Investment Proposal PowerPoint file now, which consists of 15 pages and can be used for a quick presentation of your investment thesis. The PowerPoint file is editable and can be amended. The charts that are present in the PowerPoint file are coming from the excel file that accompanies the PowerPoint file.
The Business Plan is separated into 8 sections: Summary, Investment Thesis, Process, Sources of Added Value, Portfolio Deal Flow (Investment, Operations, Exit), Current Portfolio considered for Acquisition, Team, and finally Appendices (Cash Flows, Investment Metrics and Dashboard).
All appendices tables have been retrieved from the financial model and have been pasted as pictures into the presentation.
Real Estate Acquisition Portfolio Model consists of a financial model in excel and an investment proposal in PowerPoint for the acquisition of a real estate residential apartments portfolio at below replacement cost, with further renovation and short-term renting through online platforms, and exiting the investment as soon as the rental income has stabilized.
The model generates the cash flows of the portfolio investment, as well as the cash flows of each property separately. Various metrics are generated such as payback period, internal rate of return, cash on cash, net yield to cost, net returns, commissions. All the above are summarized in 2 dashboards: one for the whole portfolio and another for individual properties.
So, a quick overview of the model, in the contents tab you can see the structure of the model and by clicking on any of the headlines to be redirected to the relevant worksheet.
On the timing tab you can feed the general information for the model such as: project title, responsible, timeline of the model and date and currency conventions.
Additionally there is a description of the color coding of the model in the same tab. Inputs are always depicted with a yellow fill and blue letters, call up (that is direct links from other cells) are filled in light blue with blue letters while calculations are depicted with white fill and black characters.
There is also a color coding for the various tabs of the model. Yellow tabs are mostly assumptions tabs, grey tabs are calculations tabs, blue tabs are outputs tabs (that is effectively results or graphs) and finally light blue tabs are admin tabs (for example: the cover page, contents, and checks).
The are 2 tabs where the user input is needed: "Investments’ Assumptions", "Operations’ Assumptions". The user needs to fill the yellow cells in each of these tabs. In the Investments’ Assumptions, the user fills the property name, location, area size, floor, purchase price, purchase date, renovation budget and months needed, transaction costs, upfront commissions, cadastral value, property tax per year, exit date and cap rate at exit.
In the Operations’ Assumptions, the user needs to the property operational assumptions such as occupancy in high and low season, rent per day in high and low season, cleaning fees, platform fees, property management fees, utilities, income tax method, tax on rental income, and tax on net operating income. Additionally, the user needs to set the seasonality for each month of the year (low and high).
All the remaining tabs are automatically calculated from the assumptions that the user has set. The resulting tabs are the investment and operations calculations where all calculations are performed, the dashboards (for the entire portfolio, and for each property separately), and the detailed summary outputs across time on a monthly and yearly basis, for the portfolio and the individual properties (such as cash flows, and the various investment metrics).
Finally, the checks tab where the most critical checks are aggregated. Whenever you see an error message in any page, you should consult this page to see where the error is coming from.
Moving on to the Investment Proposal PowerPoint file now, which consists of 15 pages and can be used for a quick presentation of your investment thesis. The PowerPoint file is editable and can be amended. The charts that are present in the PowerPoint file are coming from the excel file that accompanies the PowerPoint file.
The Business Plan is separated into 8 sections: Summary, Investment Thesis, Process, Sources of Added Value, Portfolio Deal Flow (Investment, Operations, Exit), Current Portfolio considered for Acquisition, Team, and finally Appendices (Cash Flows, Investment Metrics and Dashboard).
All appendices tables have been retrieved from the financial model and have been pasted as pictures into the presentation.
This Best Practice includes
1 Excel and 1 Powerpoint
