Originally published: 19/01/2021 11:05
Publication number: ELQ-38629-1
View all versions & Certificate
Publication number: ELQ-38629-1
View all versions & Certificate

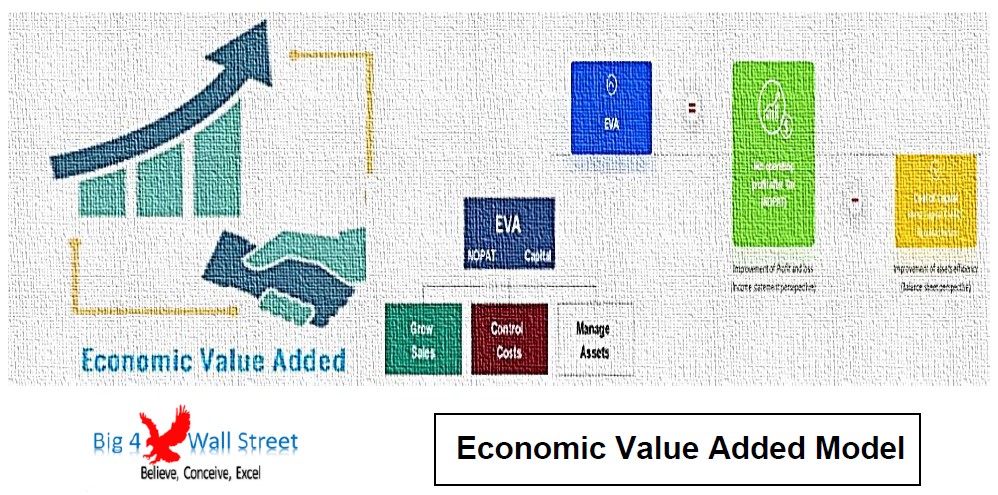
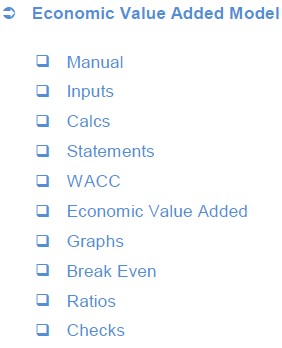
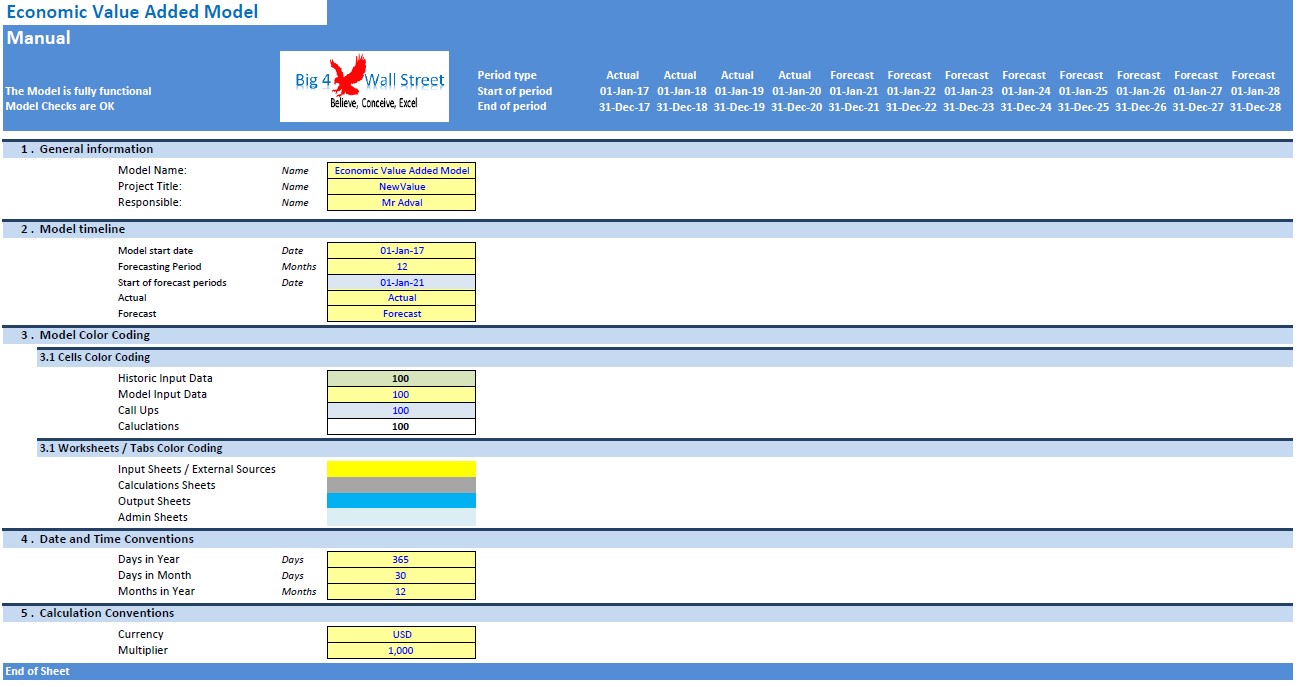
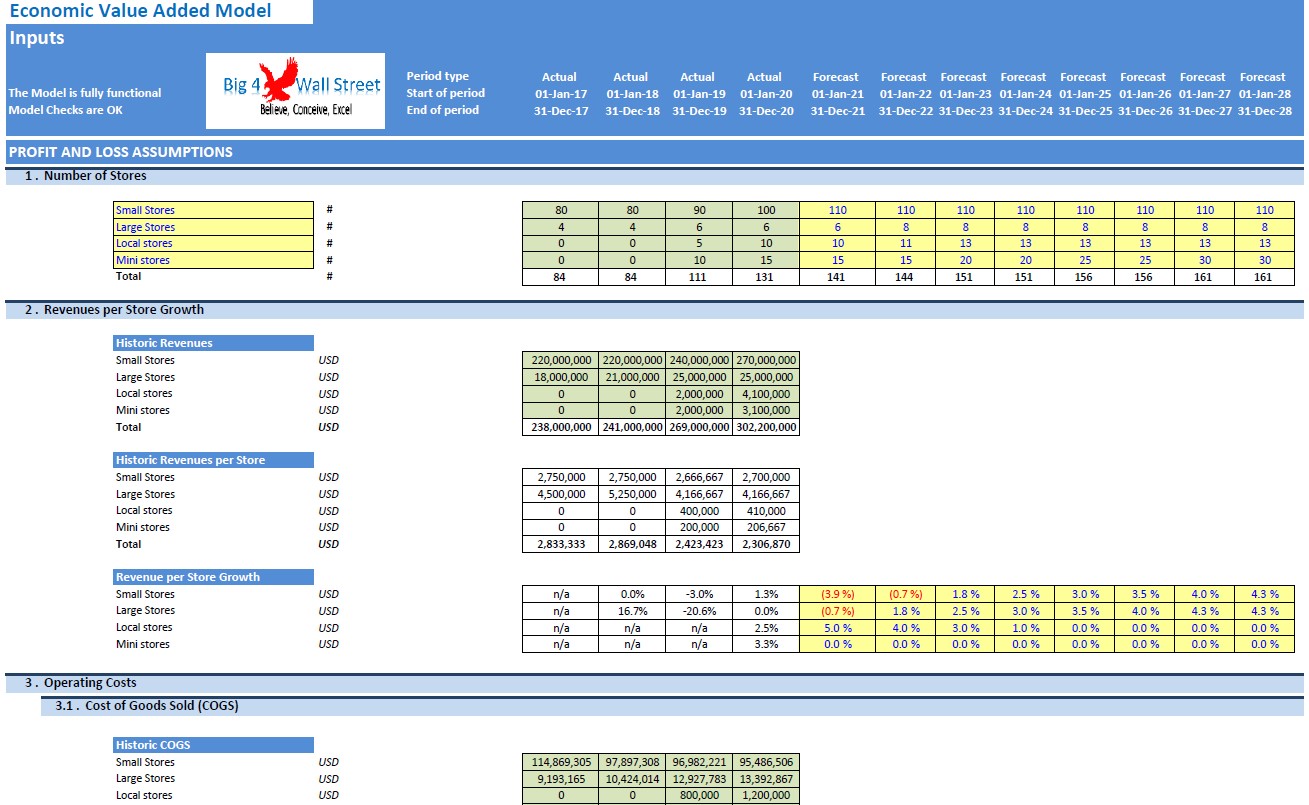
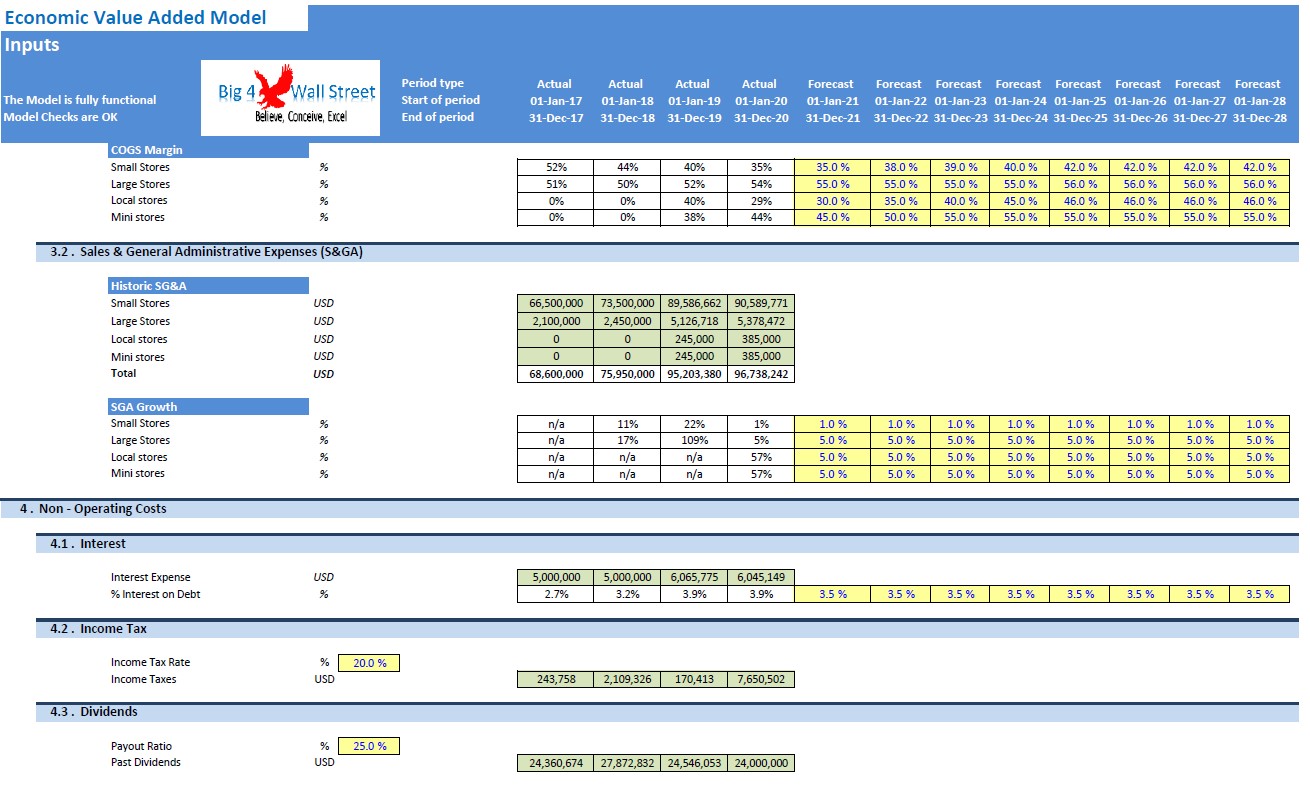
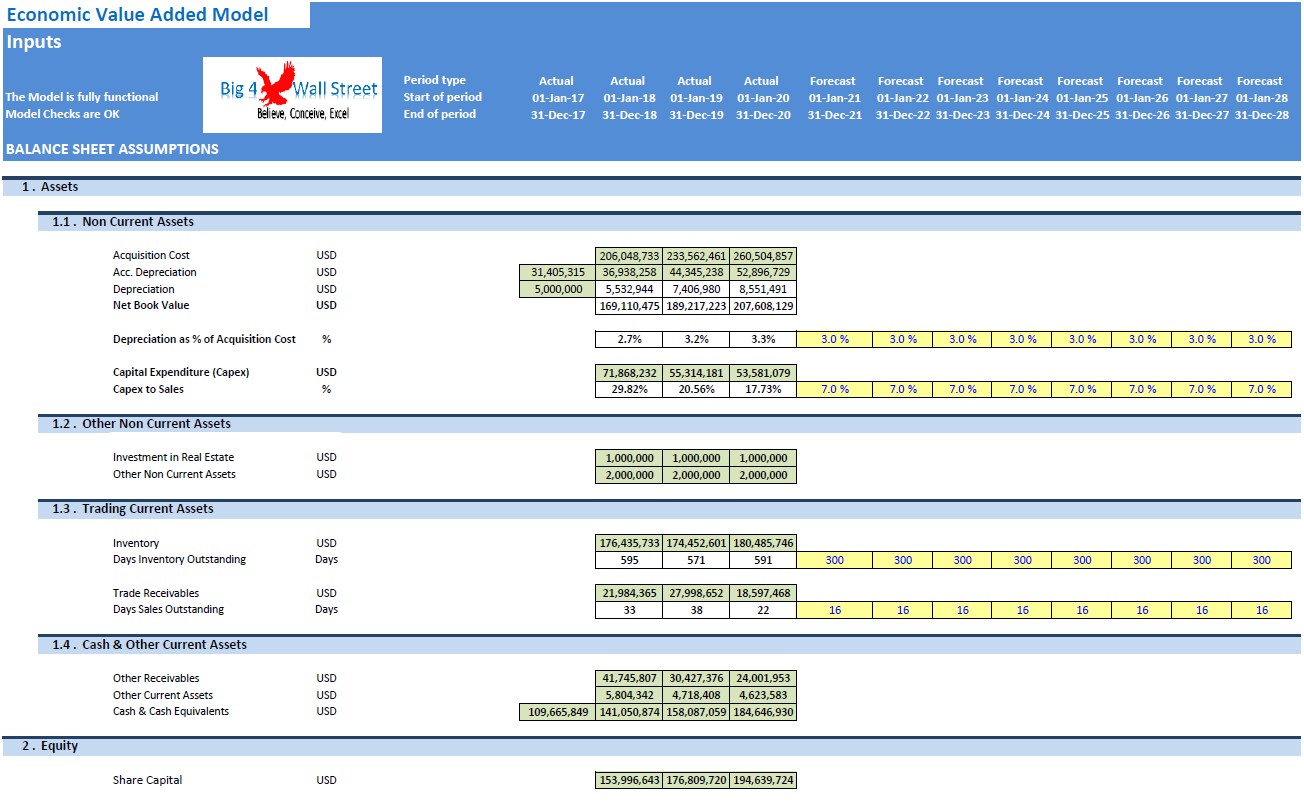
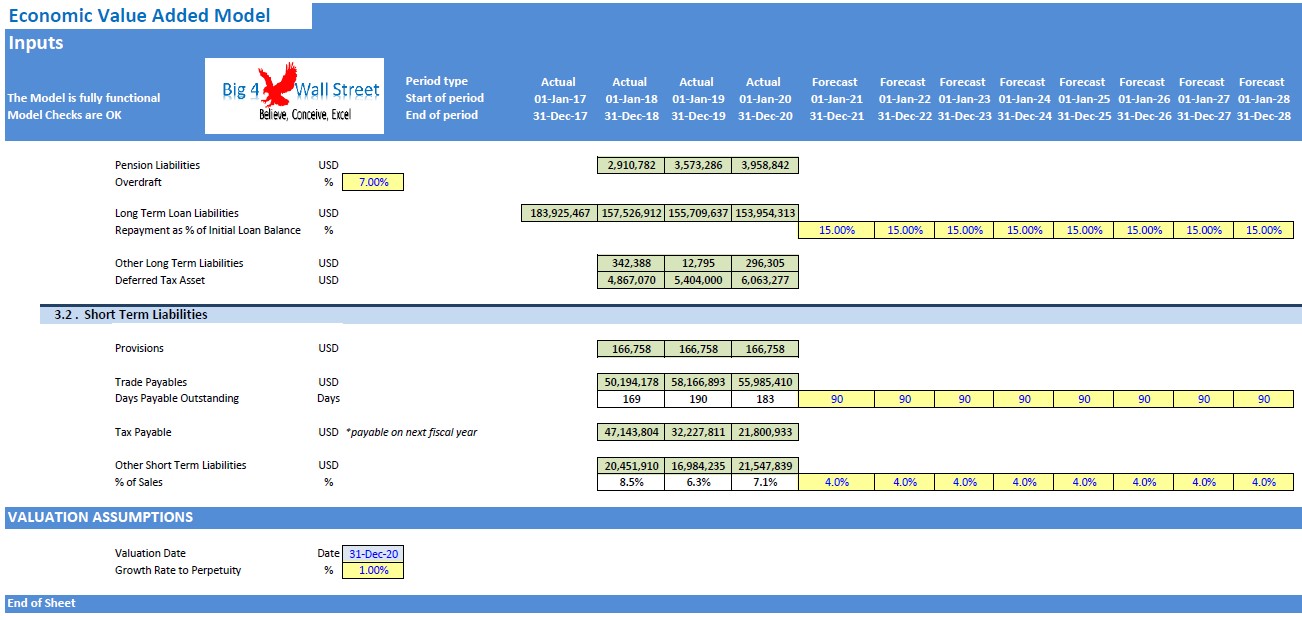
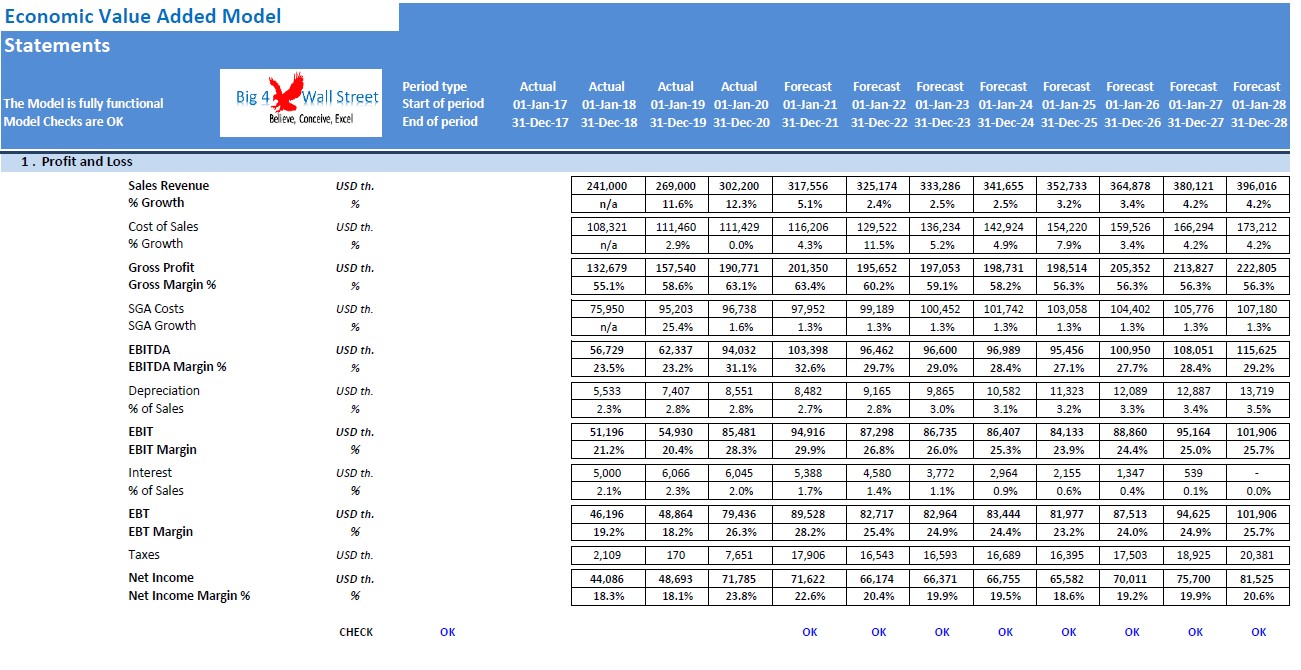
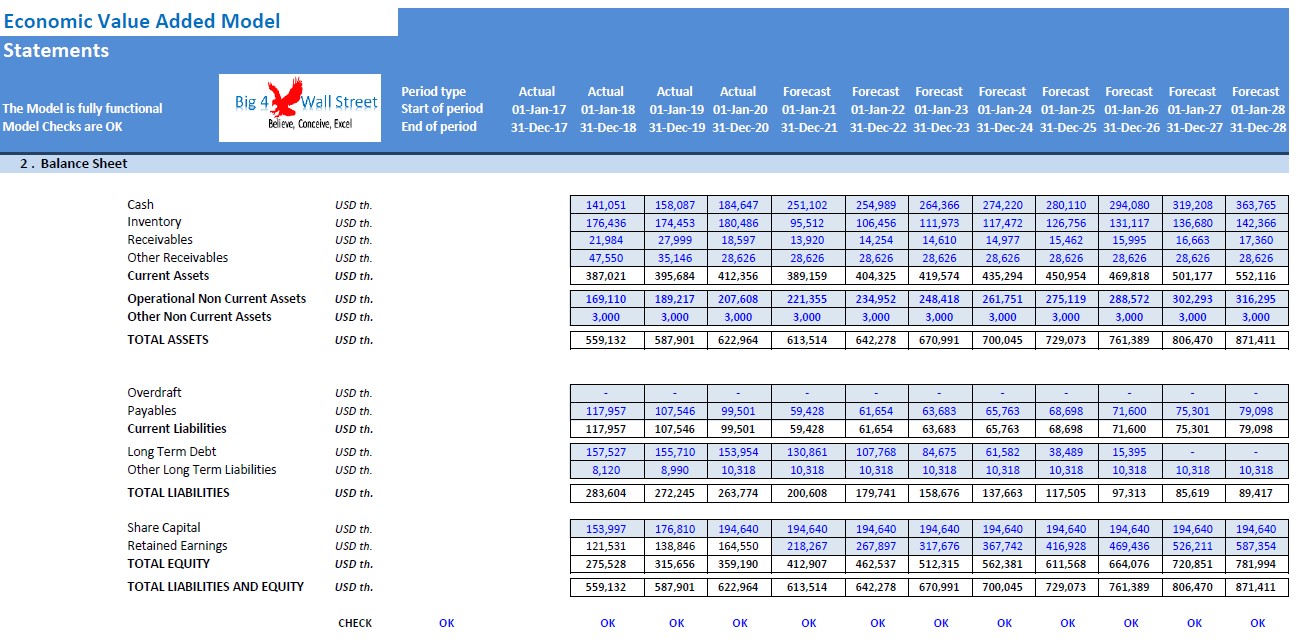
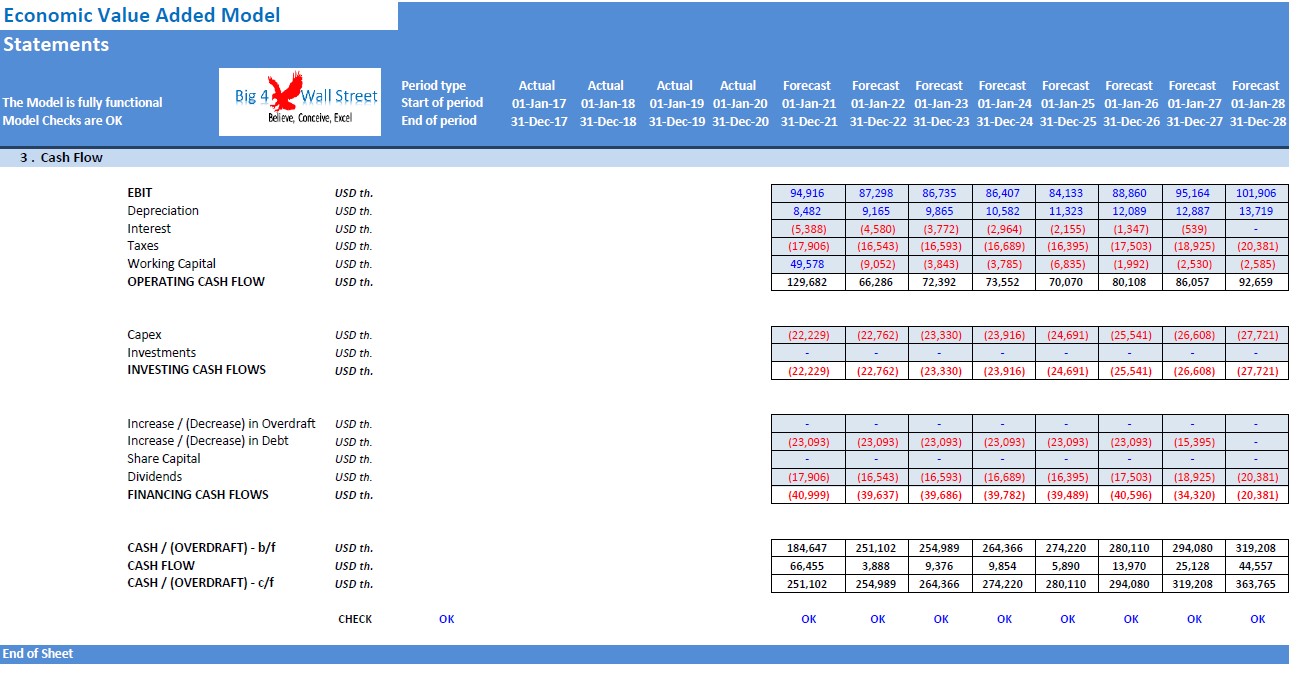
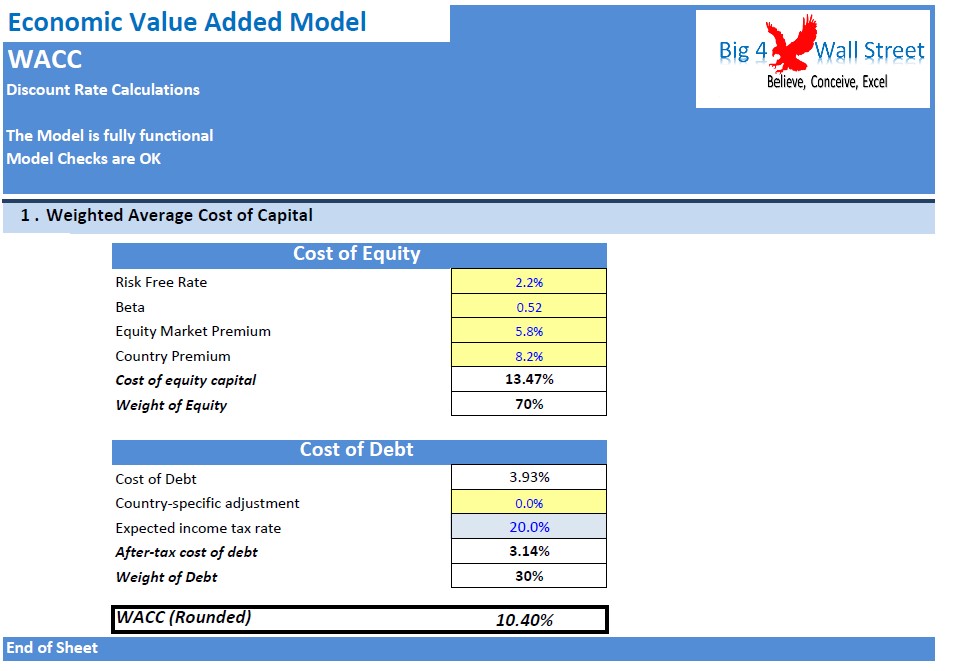
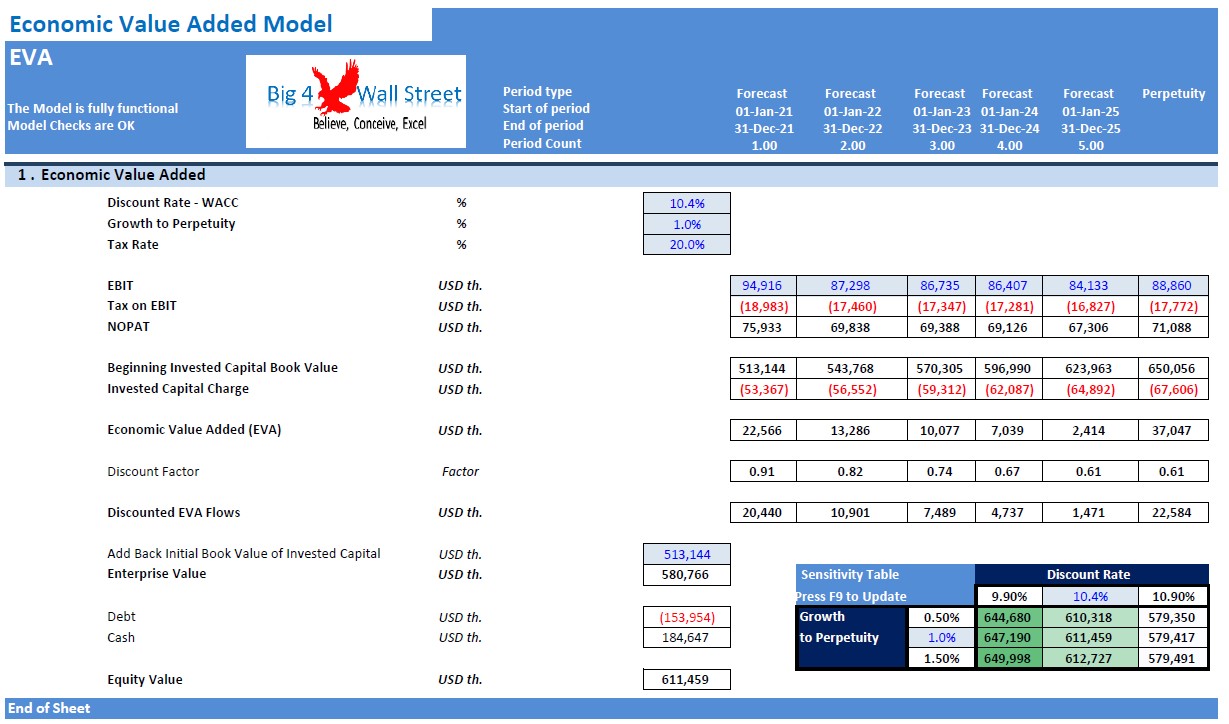
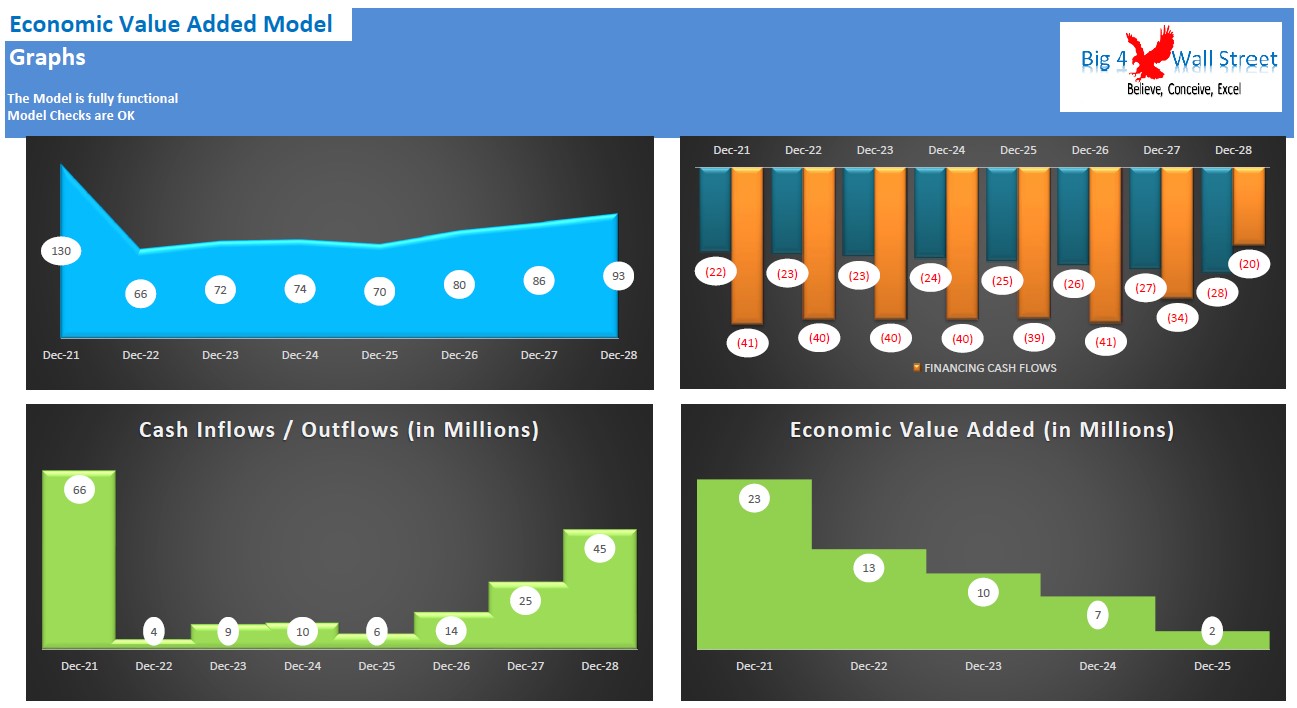
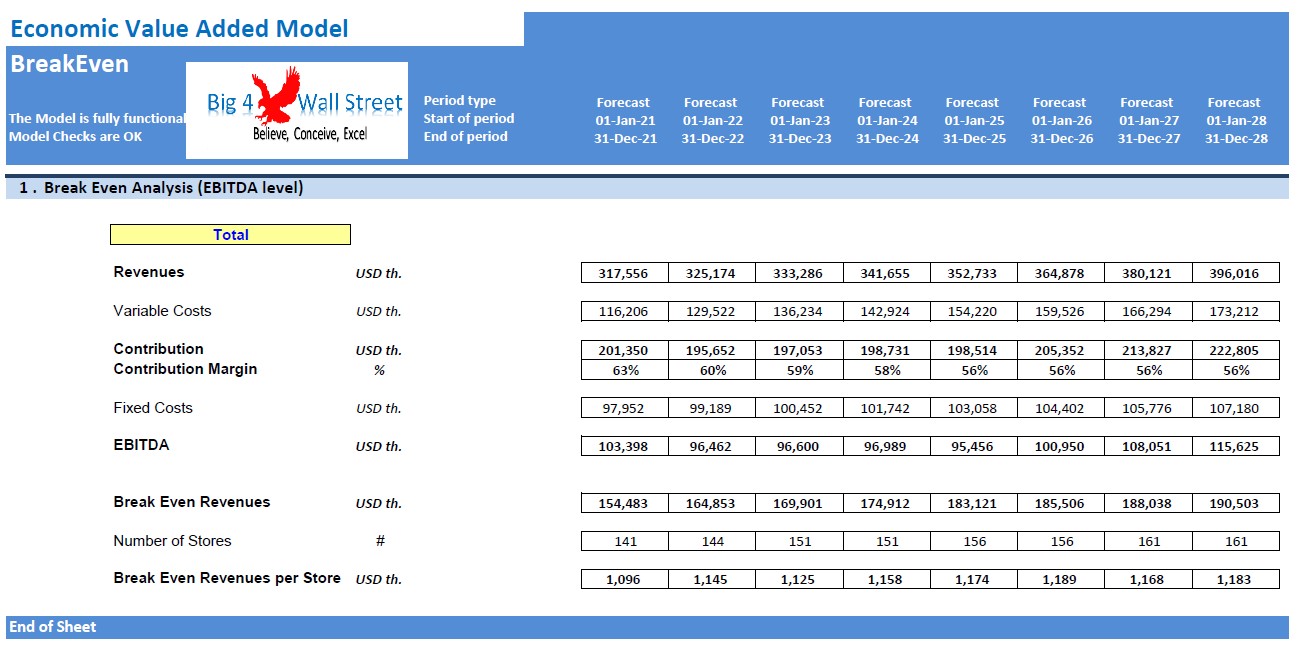
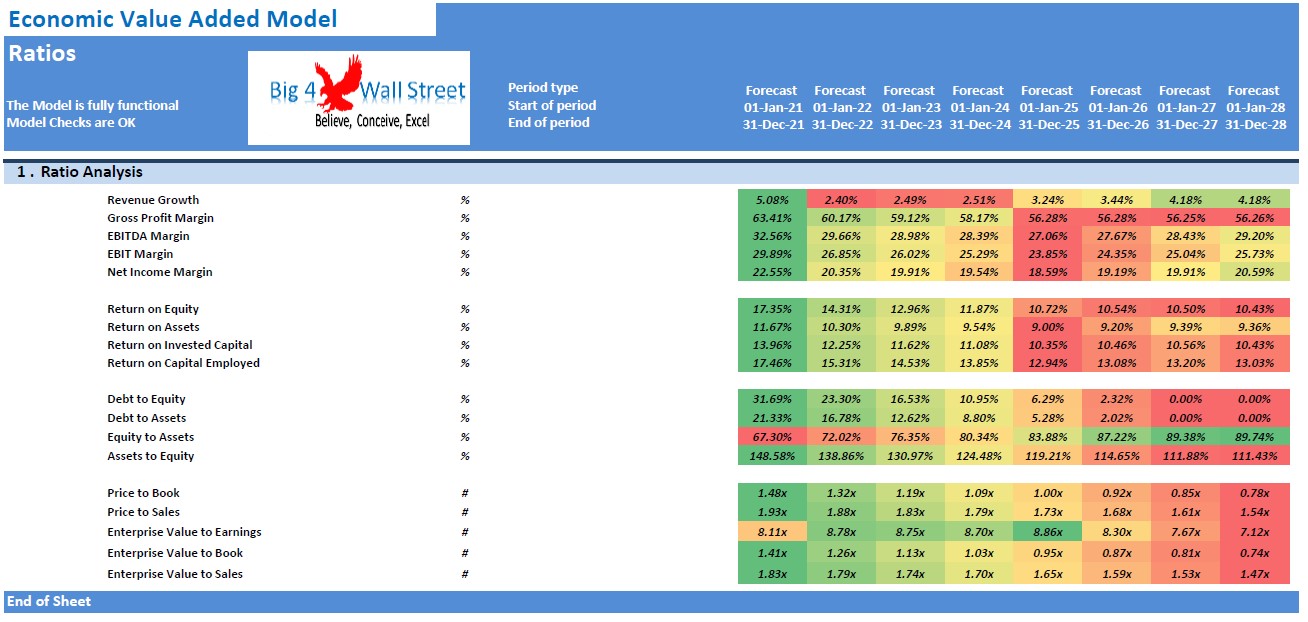
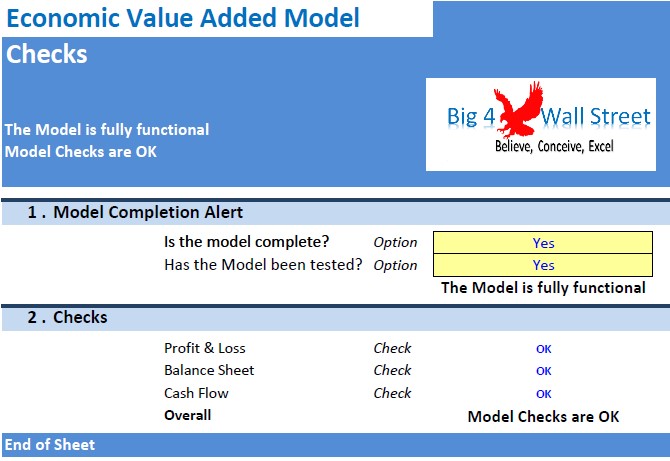
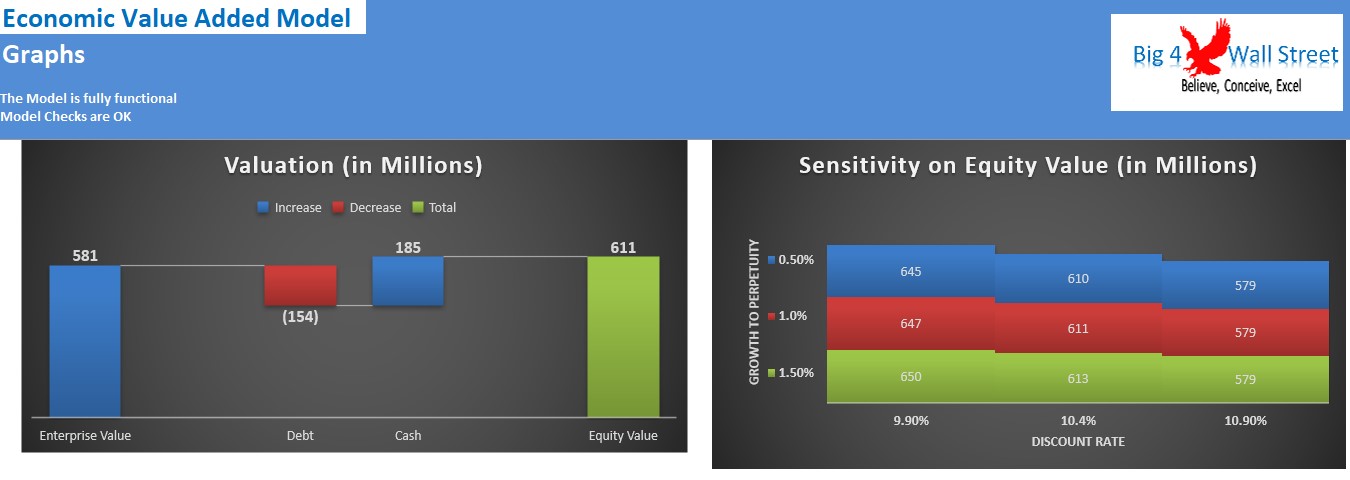
Economic Value Added
Economic Value Added Model presents another valuation method which is based on a residual income approach.
Further information
Economic Value Added Model presents another valuation method which is based on a residual income approach which takes the perspective of all providers of capital (both debt and equity), where we subtract a capital charge (the company's total cost of capital in money terms) from the company's after-tax operating profit.
Apply a different valuation approach based on the economic value added.
