
Originally published: 20/09/2021 08:03
Last version published: 05/11/2021 09:40
Publication number: ELQ-84198-3
View all versions & Certificate
Last version published: 05/11/2021 09:40
Publication number: ELQ-84198-3
View all versions & Certificate

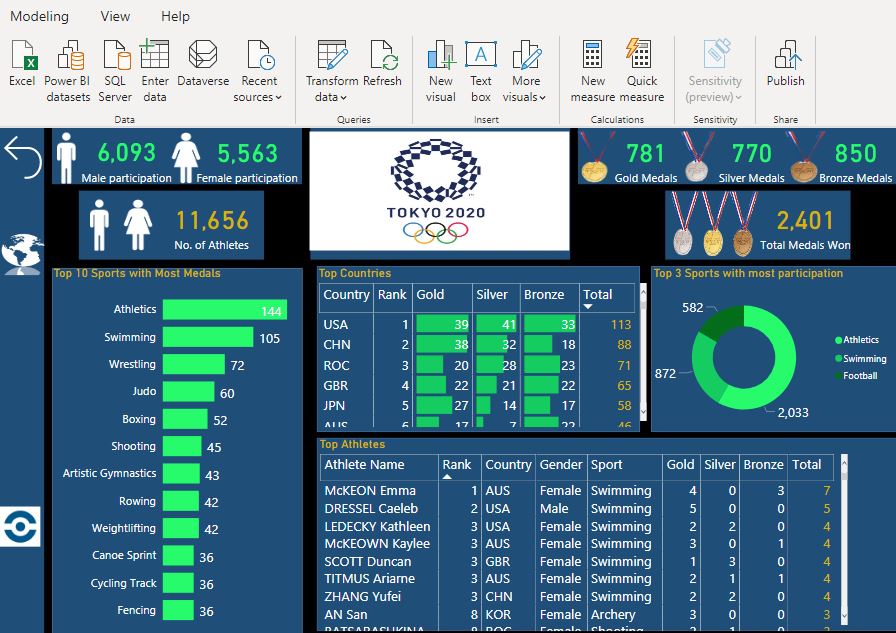
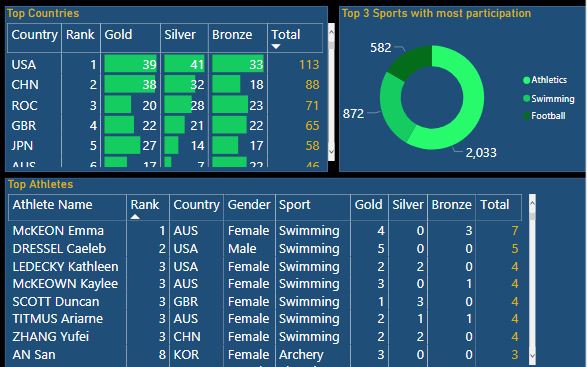
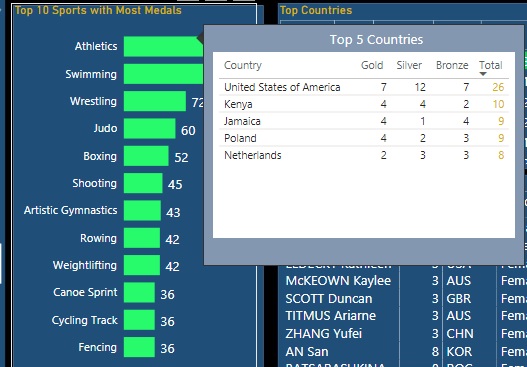
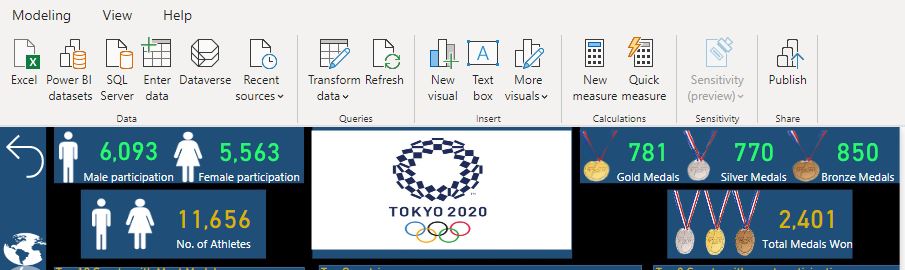
Tokyo Olympics 2020 Dashboard in Power BI
This dashboard shows the performance of Countries and it's Athletes in Tokyo Olympics 2020.
