
Originally published: 27/01/2021 16:50
Publication number: ELQ-65396-1
View all versions & Certificate
Publication number: ELQ-65396-1
View all versions & Certificate

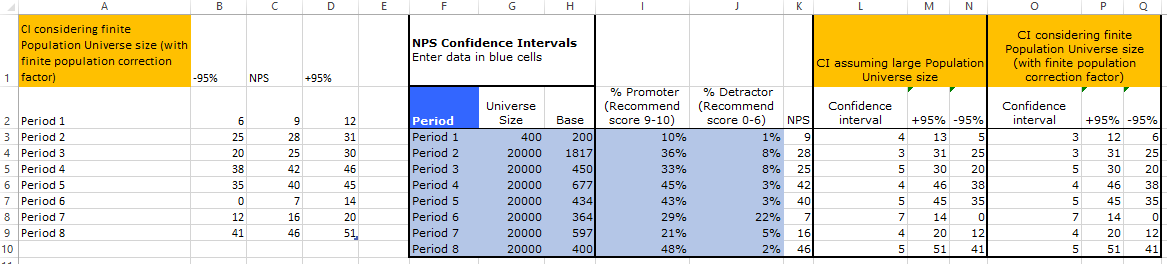
NPS Confidence Interval Charting Template
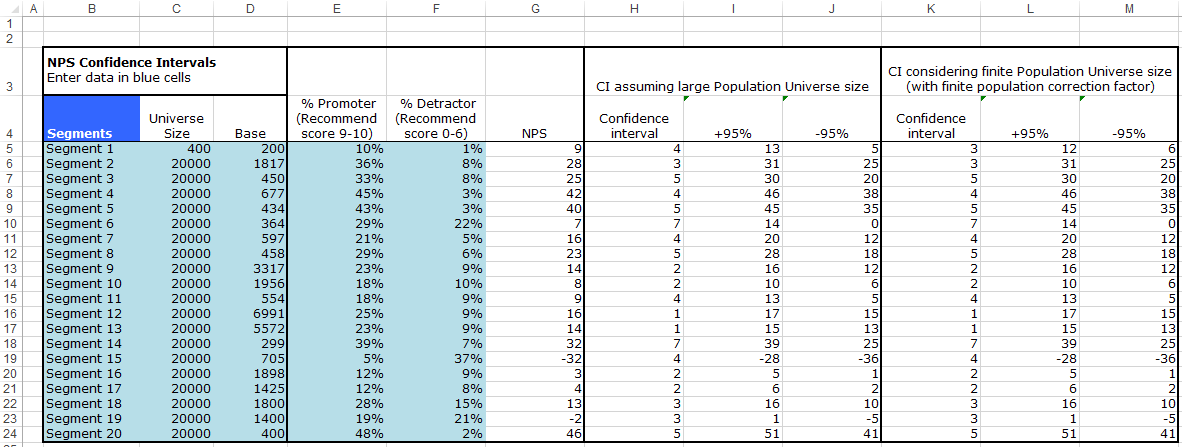
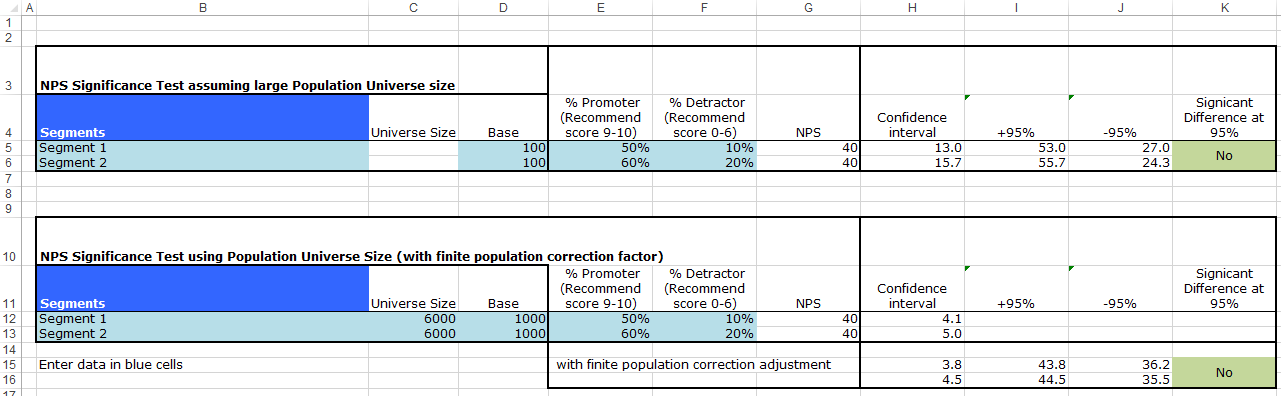
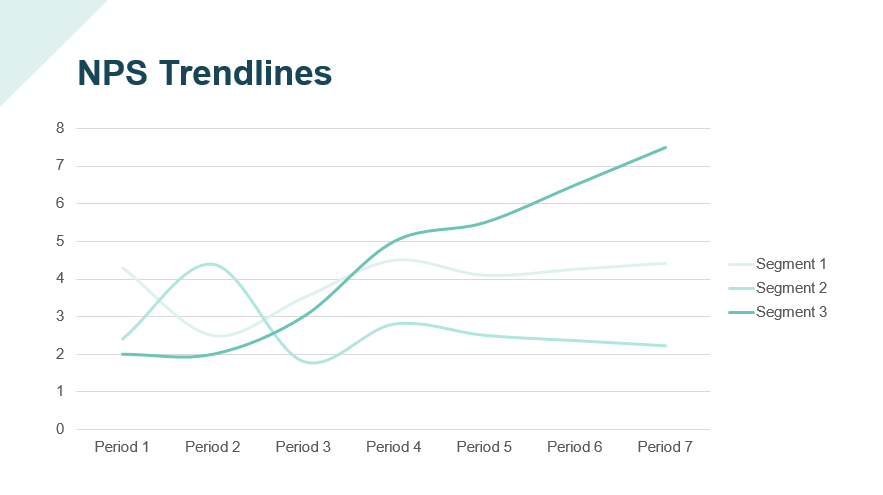
NPS Confidence Intervals charting tool with finite population correction adjustment feature
