Originally published: 27/11/2025 14:25
Last version published: 15/12/2025 08:33
Publication number: ELQ-87694-4
View all versions & Certificate
Last version published: 15/12/2025 08:33
Publication number: ELQ-87694-4
View all versions & Certificate

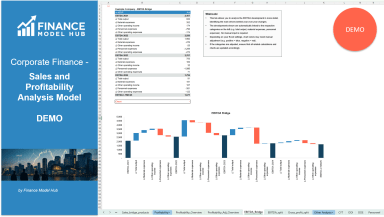
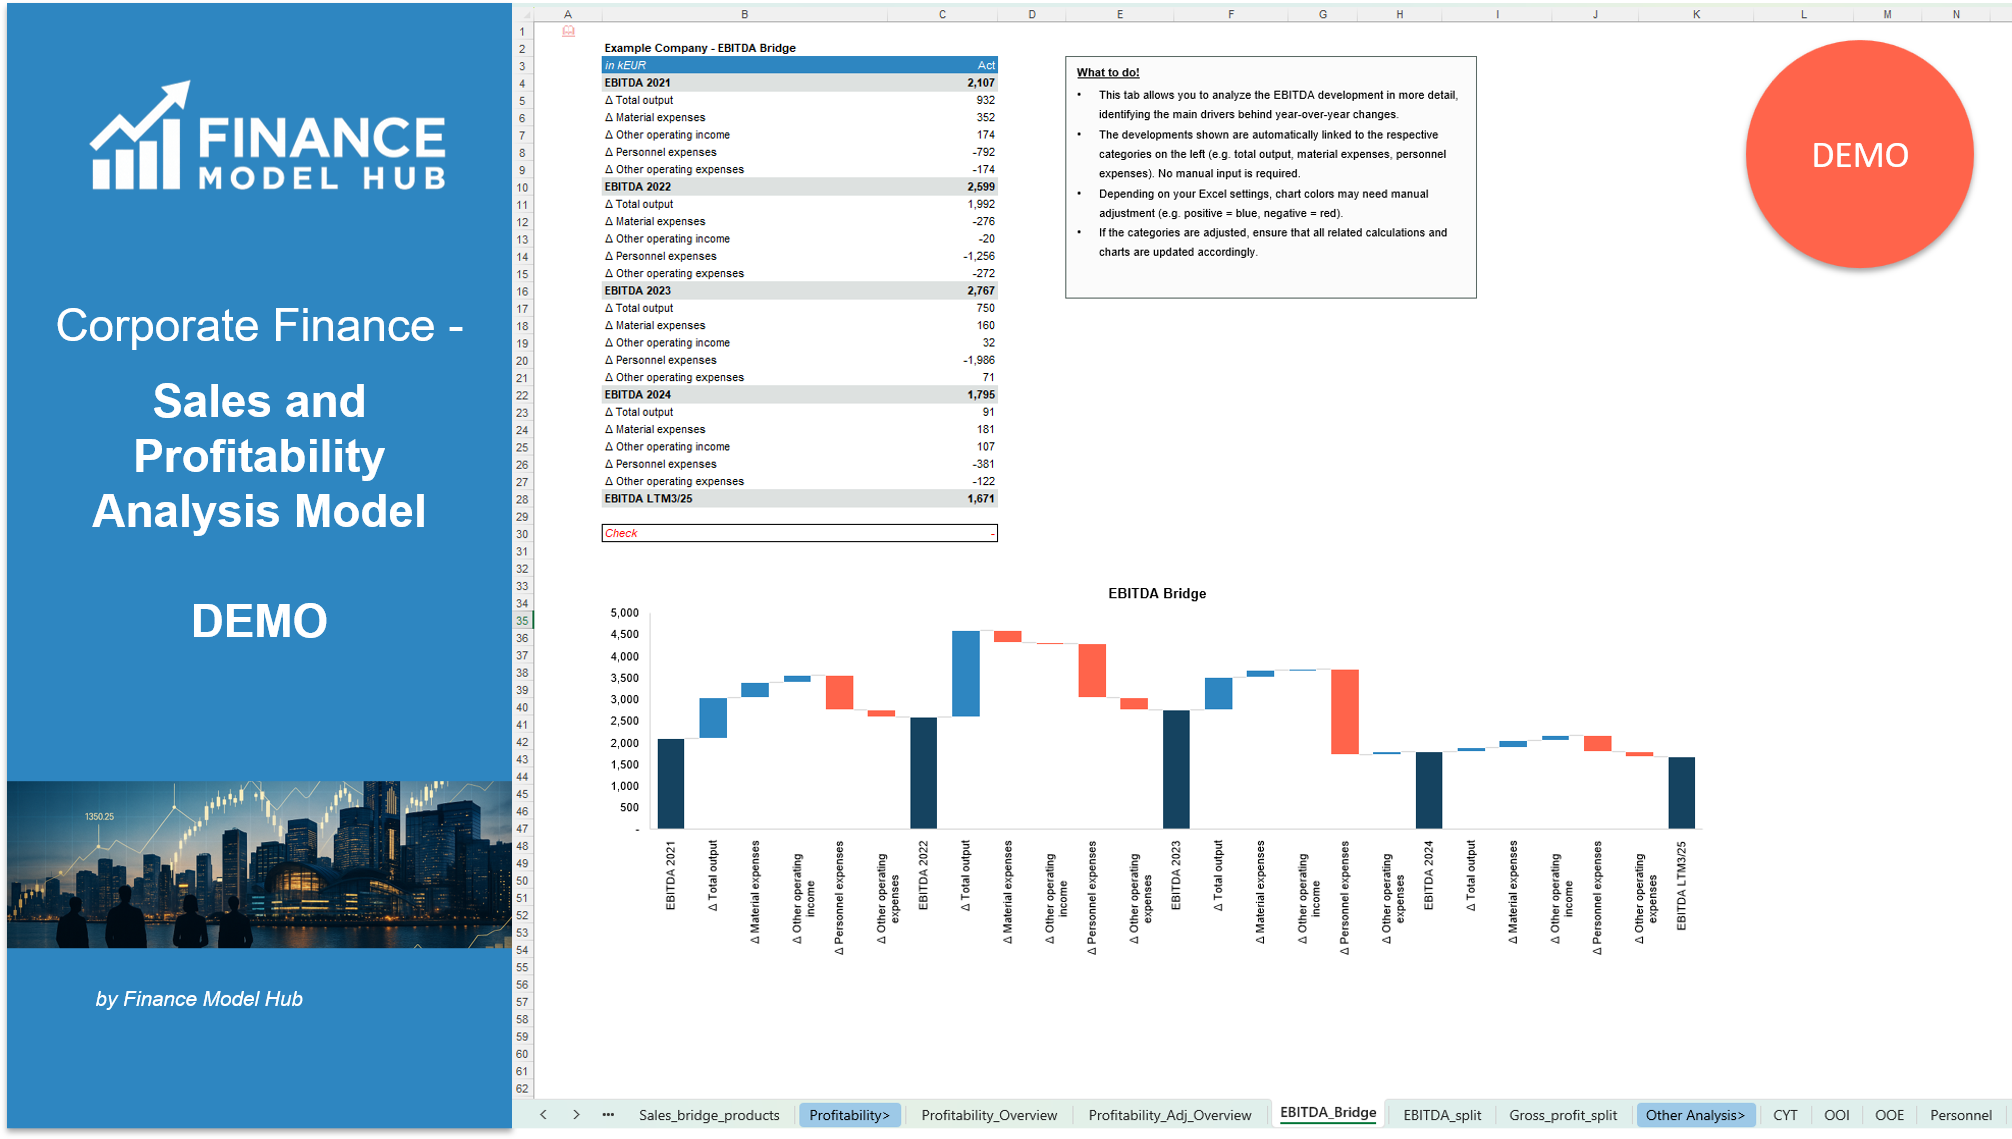
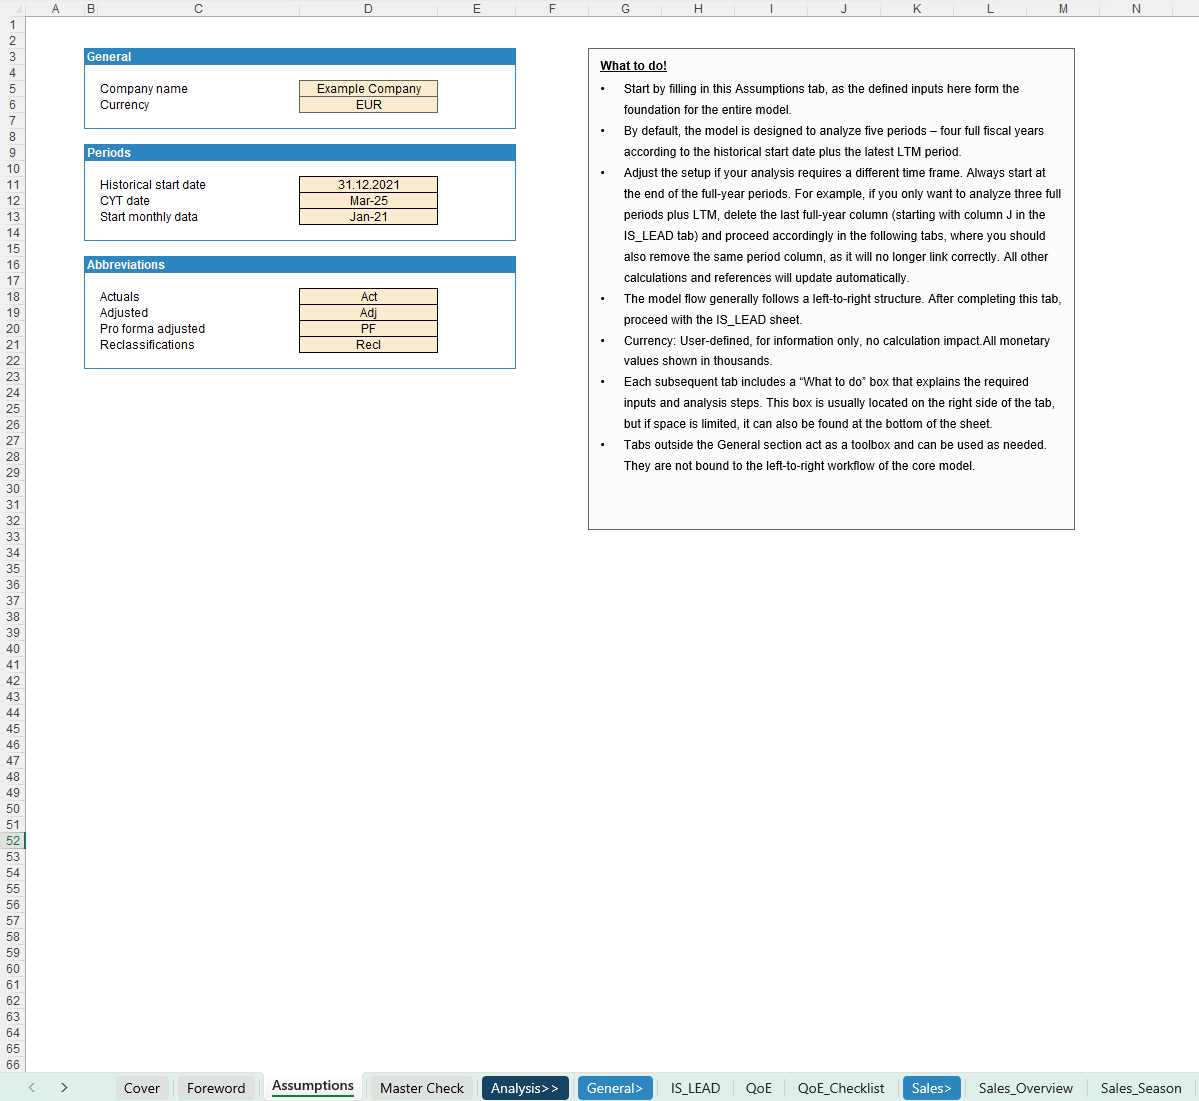
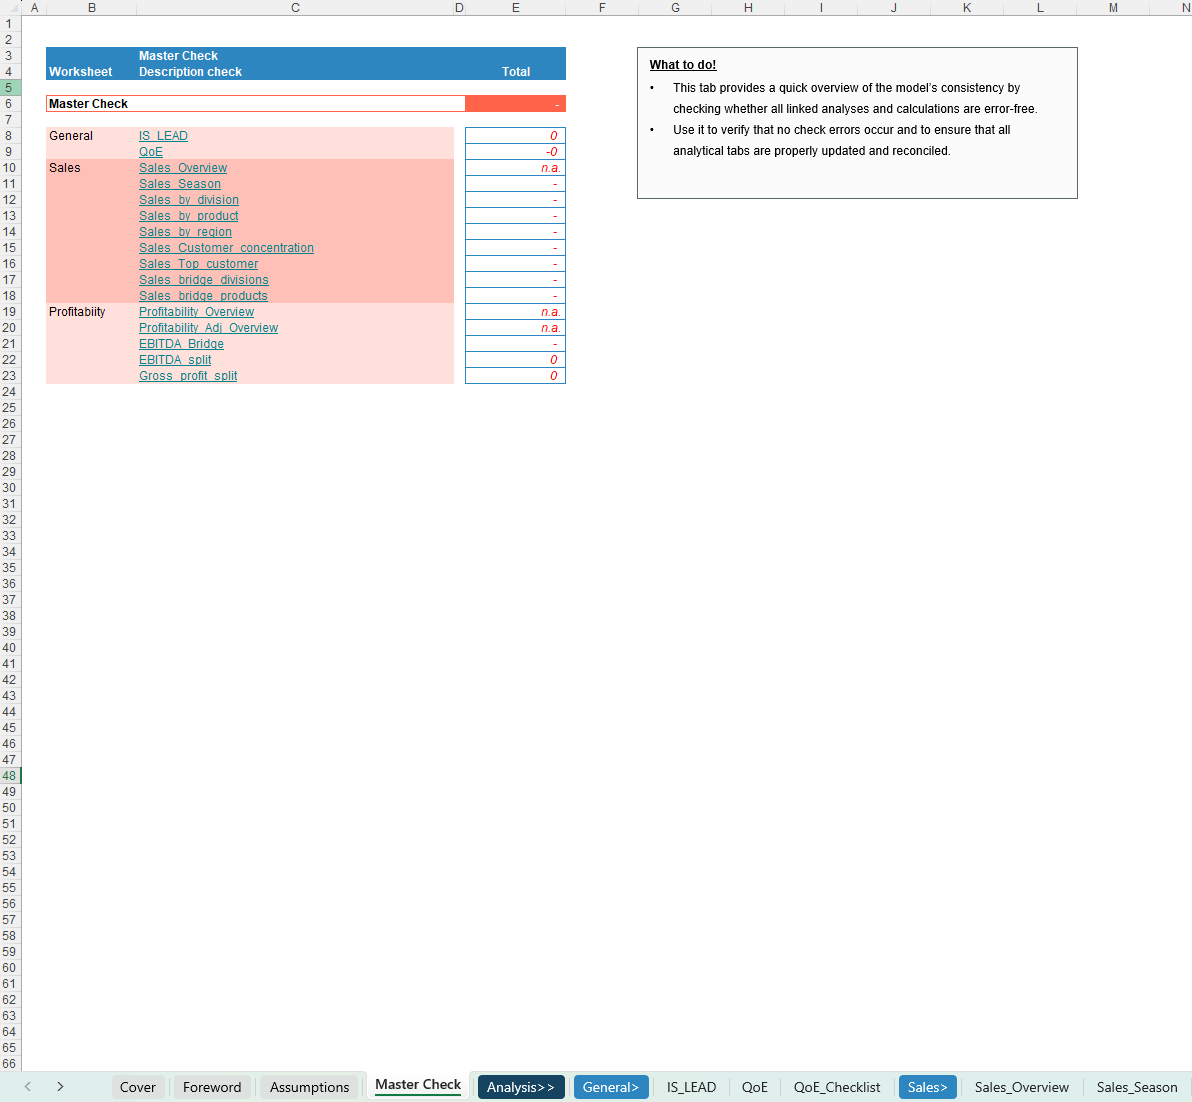
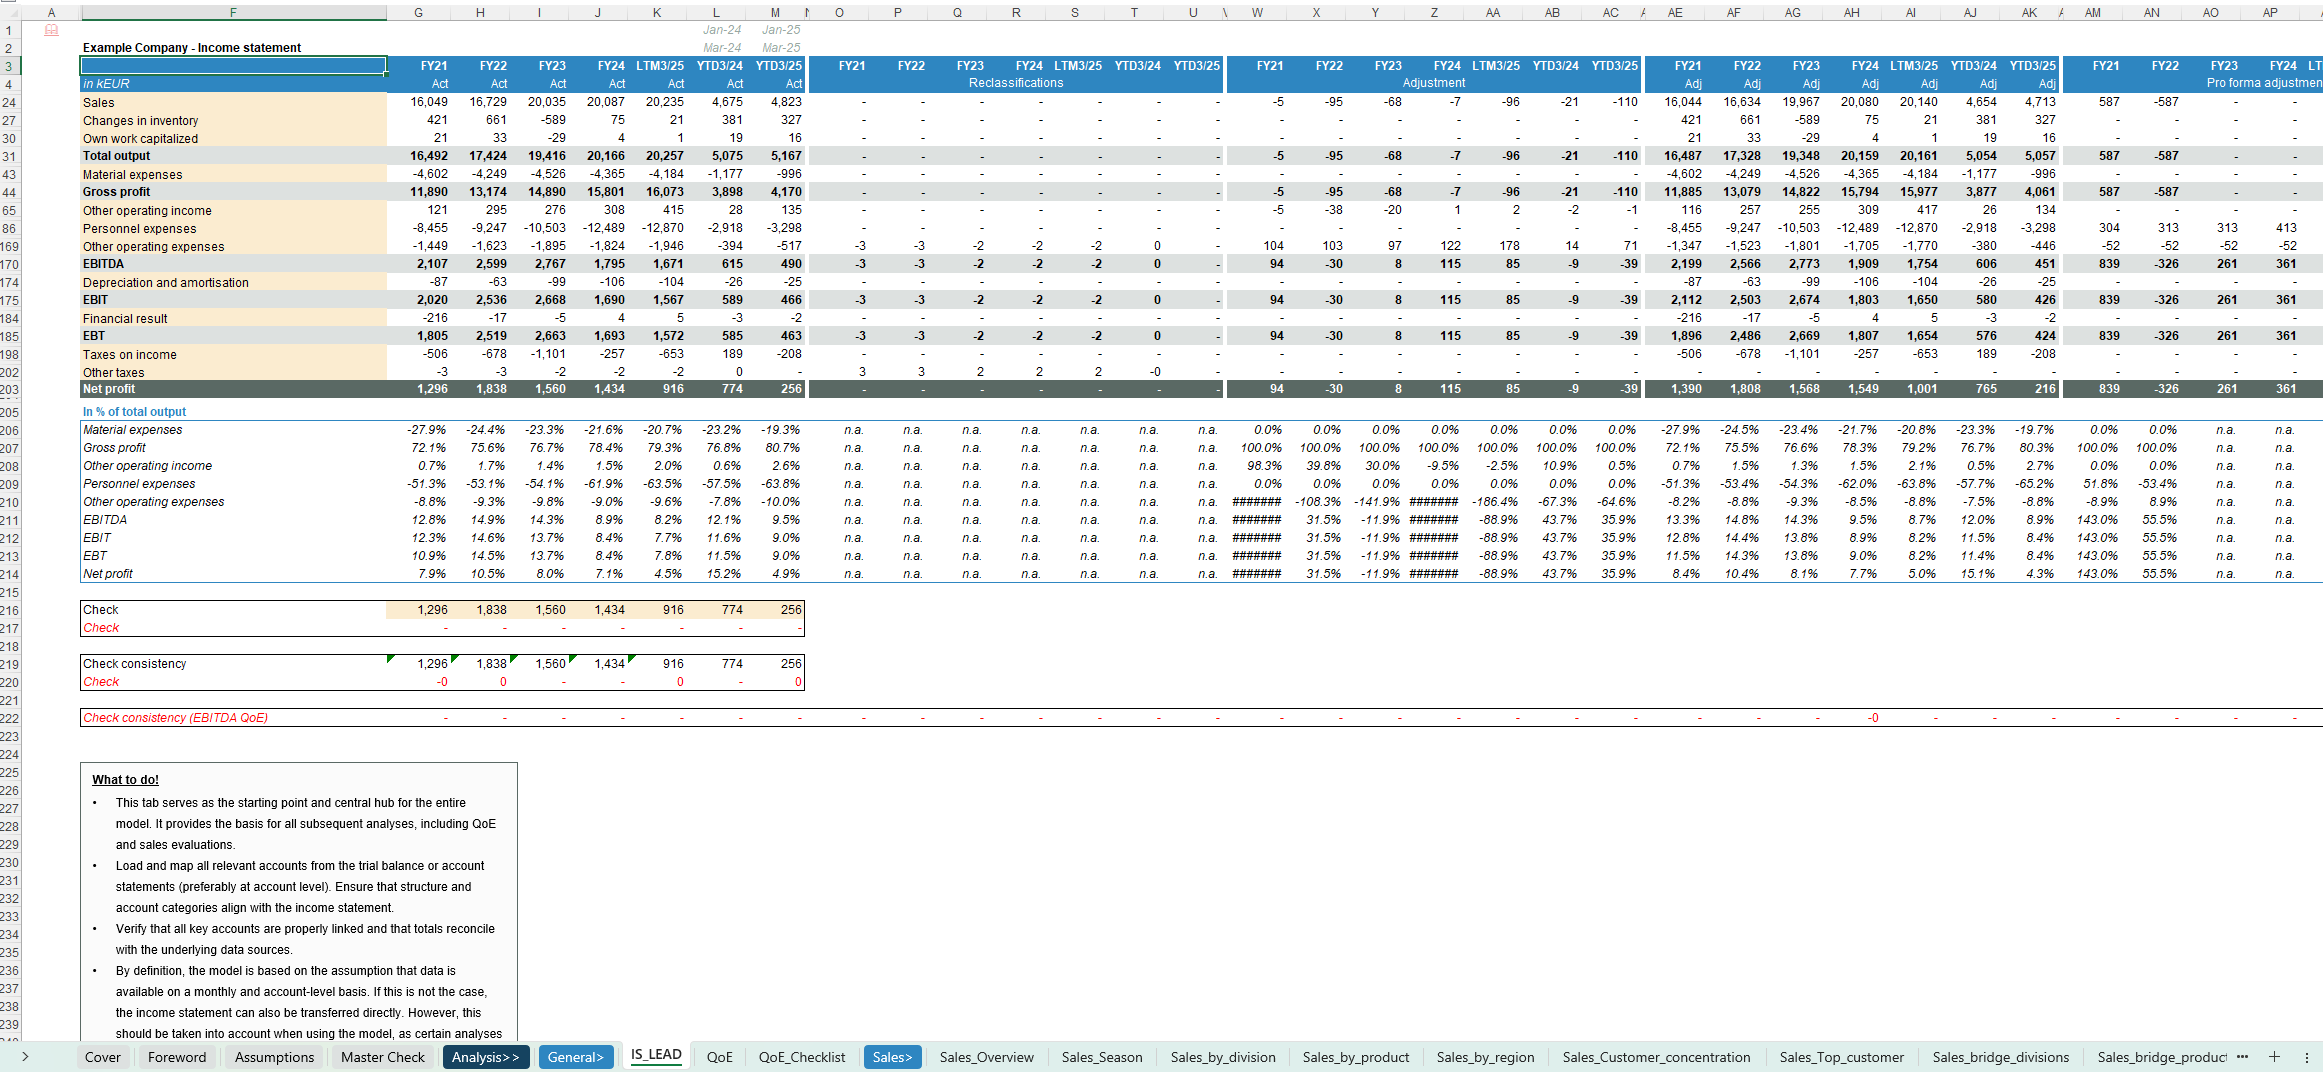
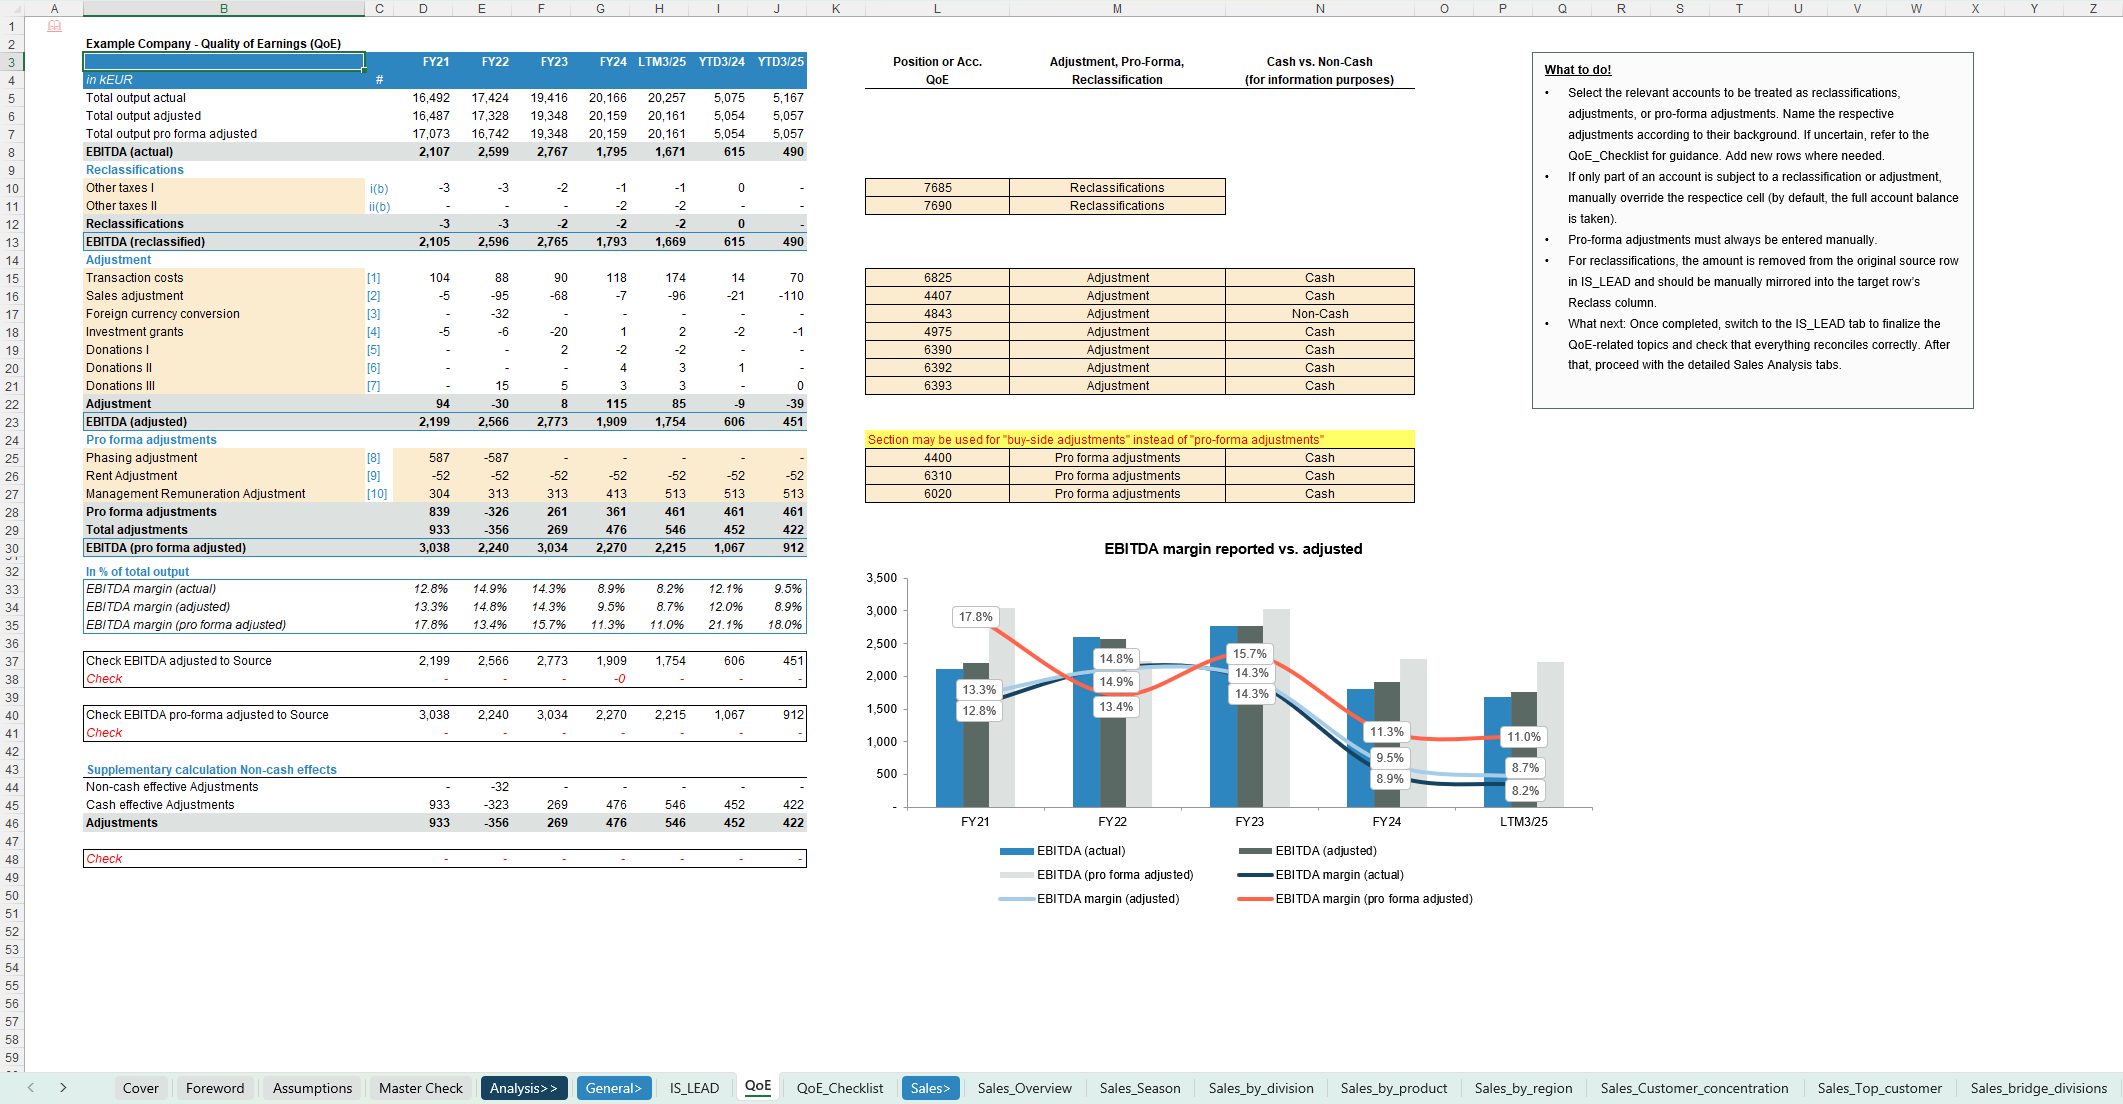
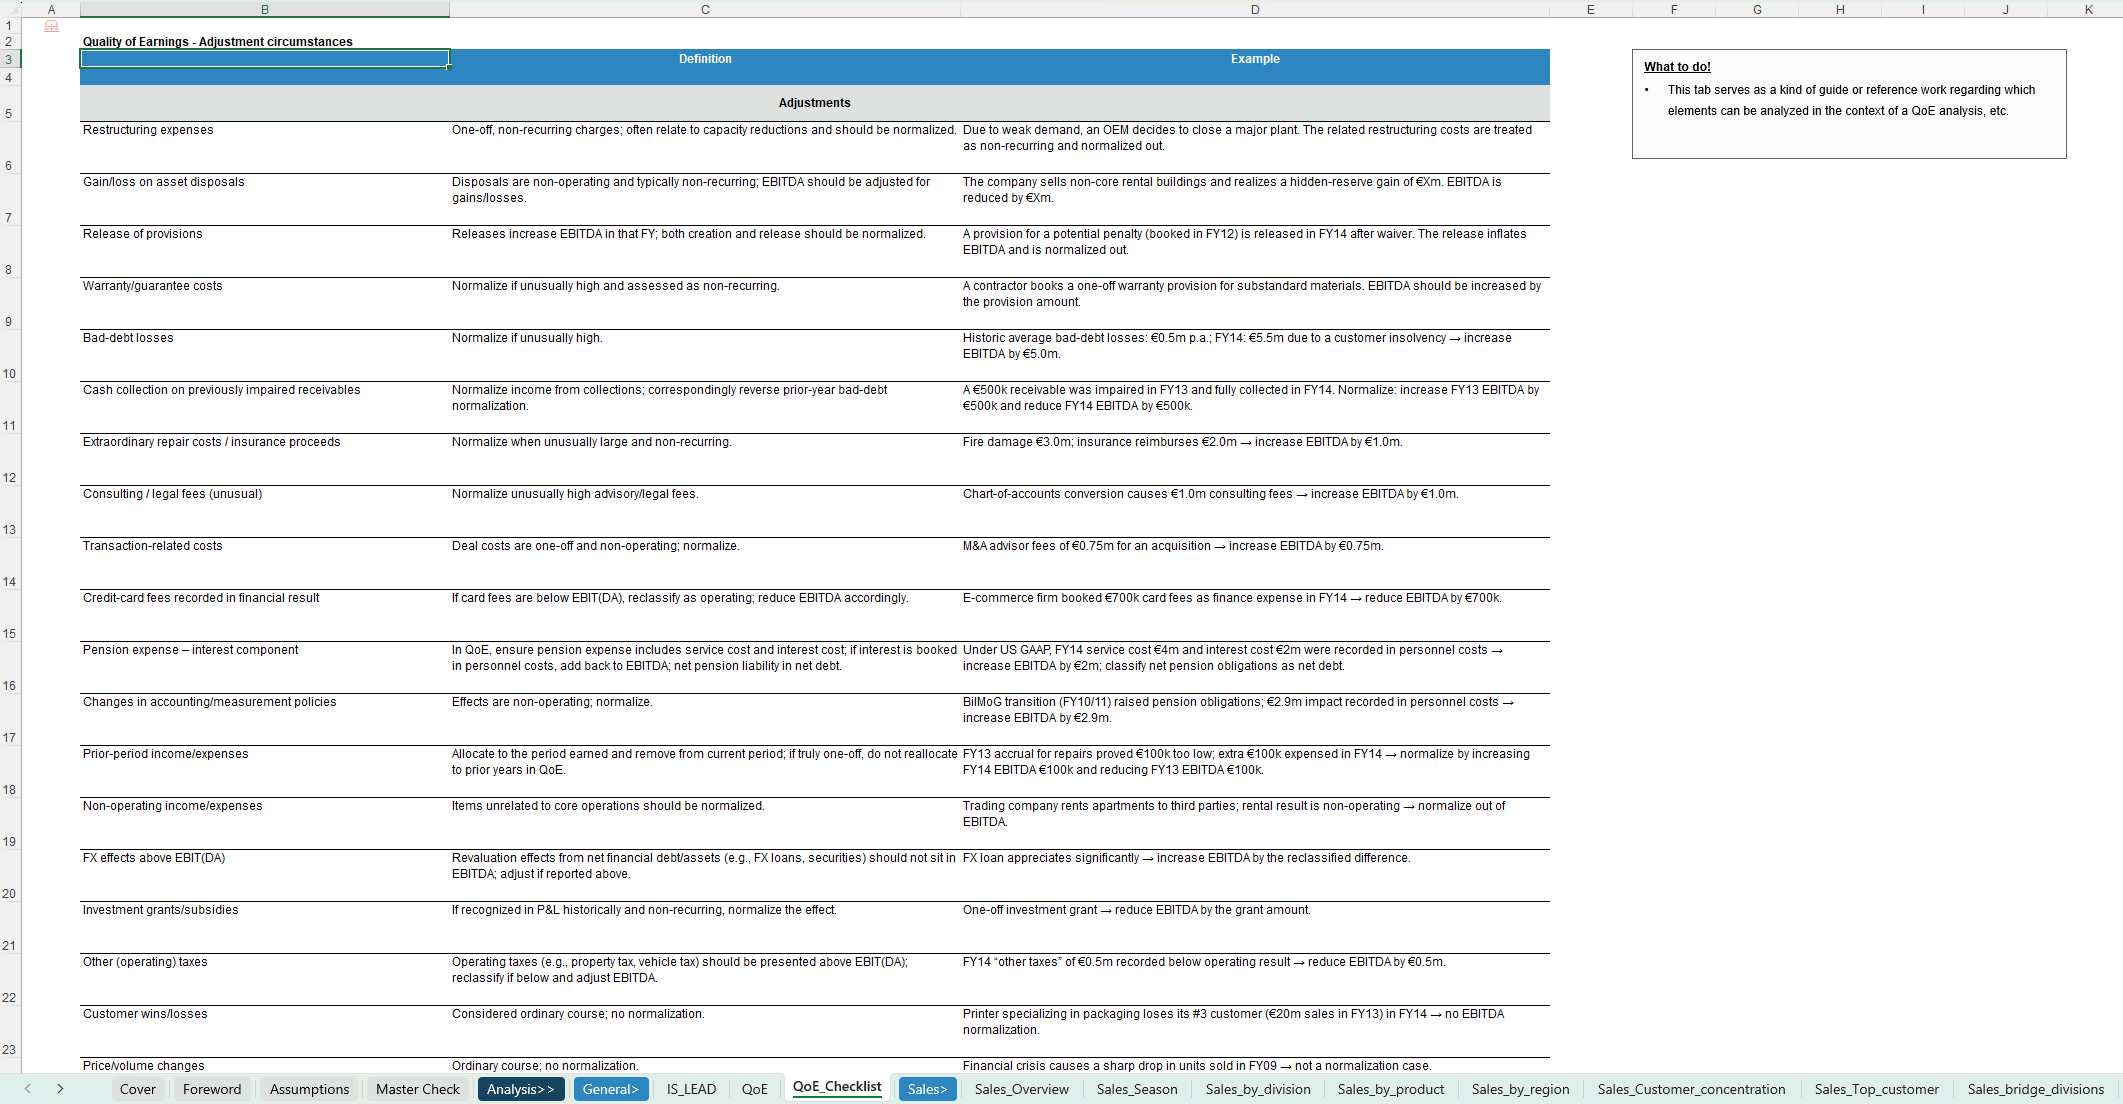
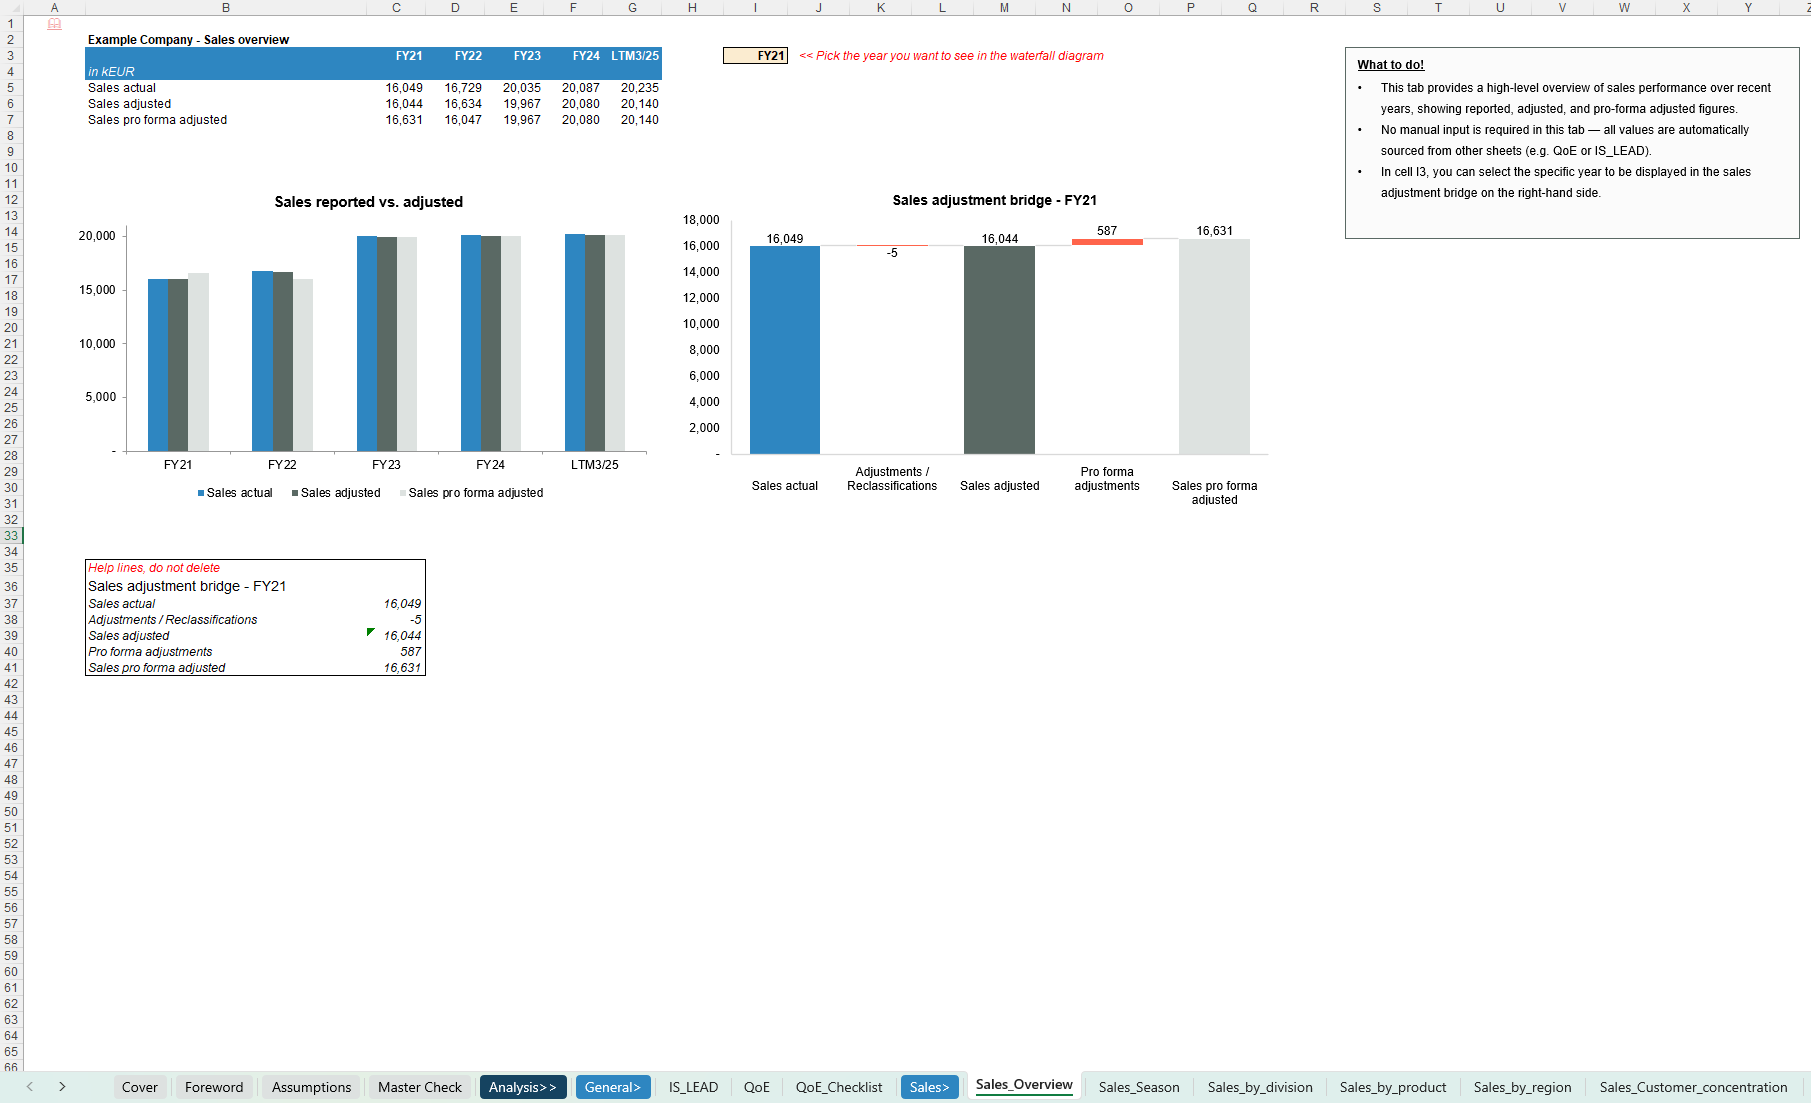
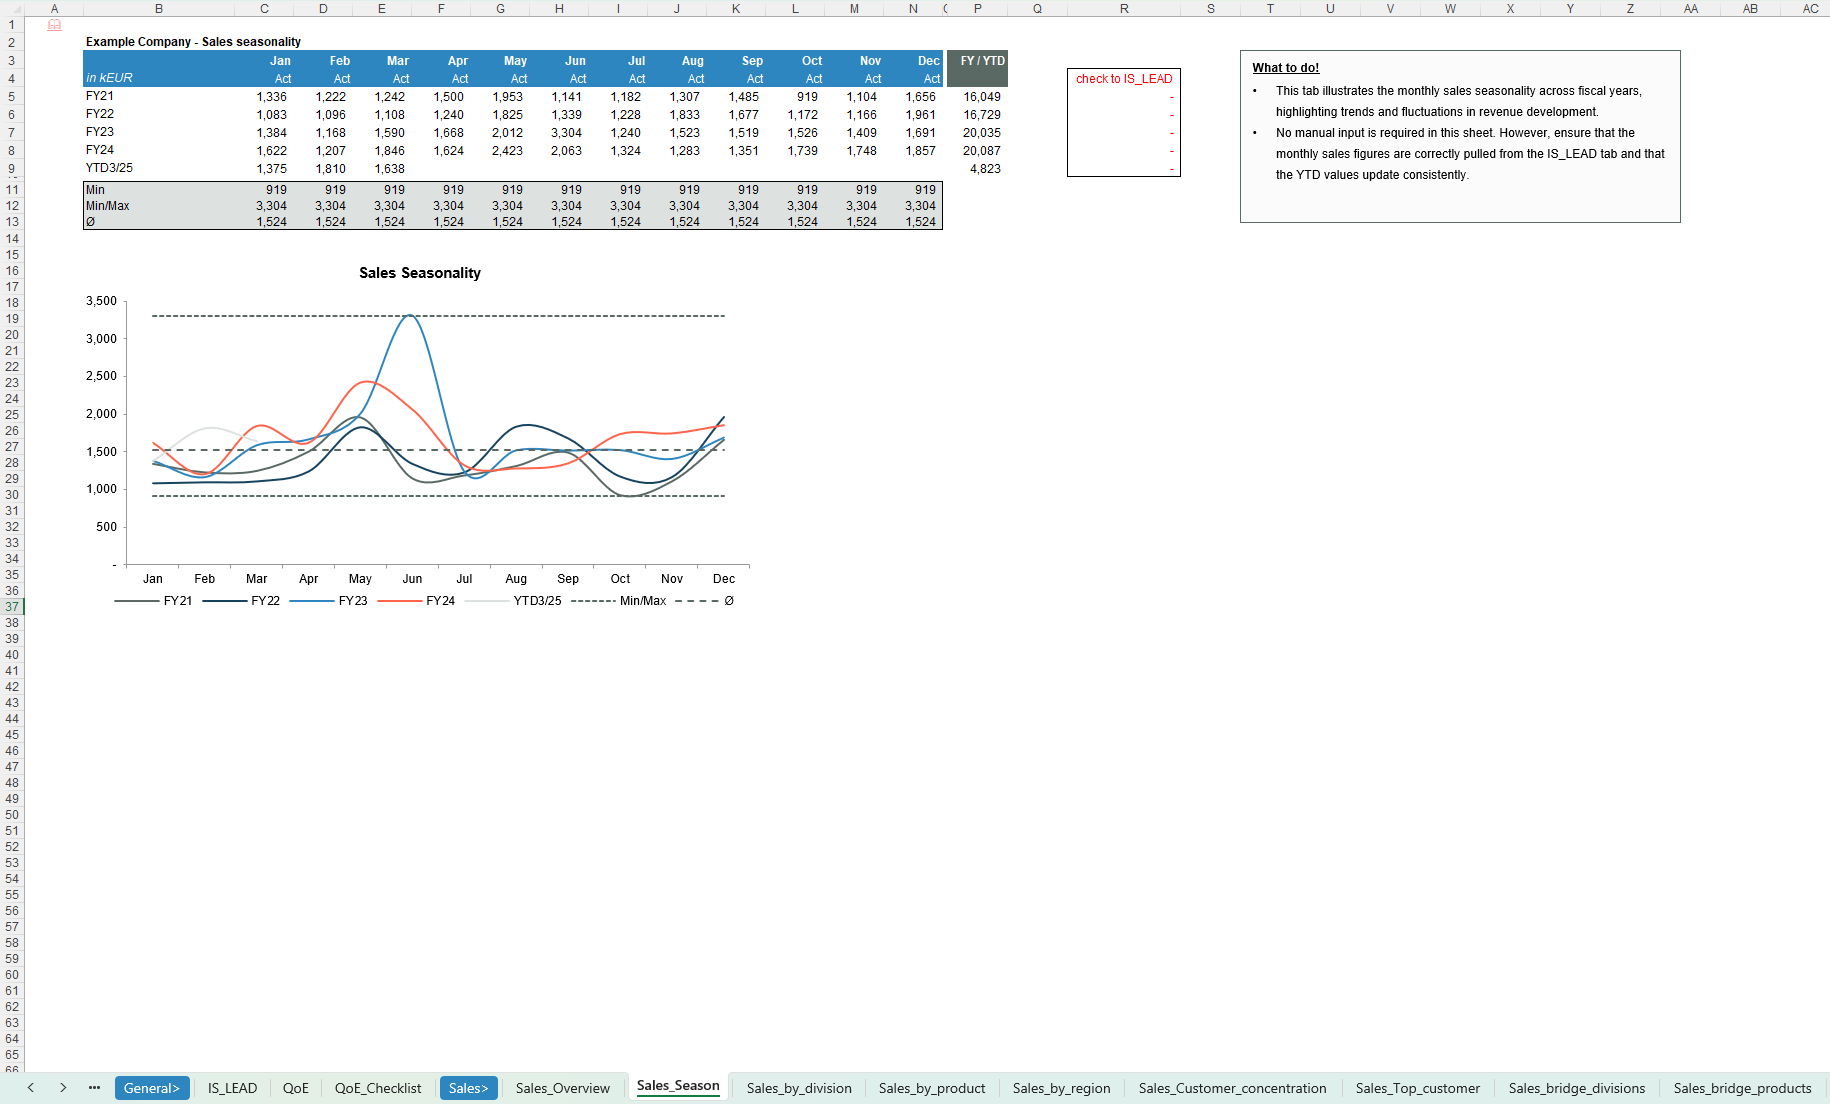
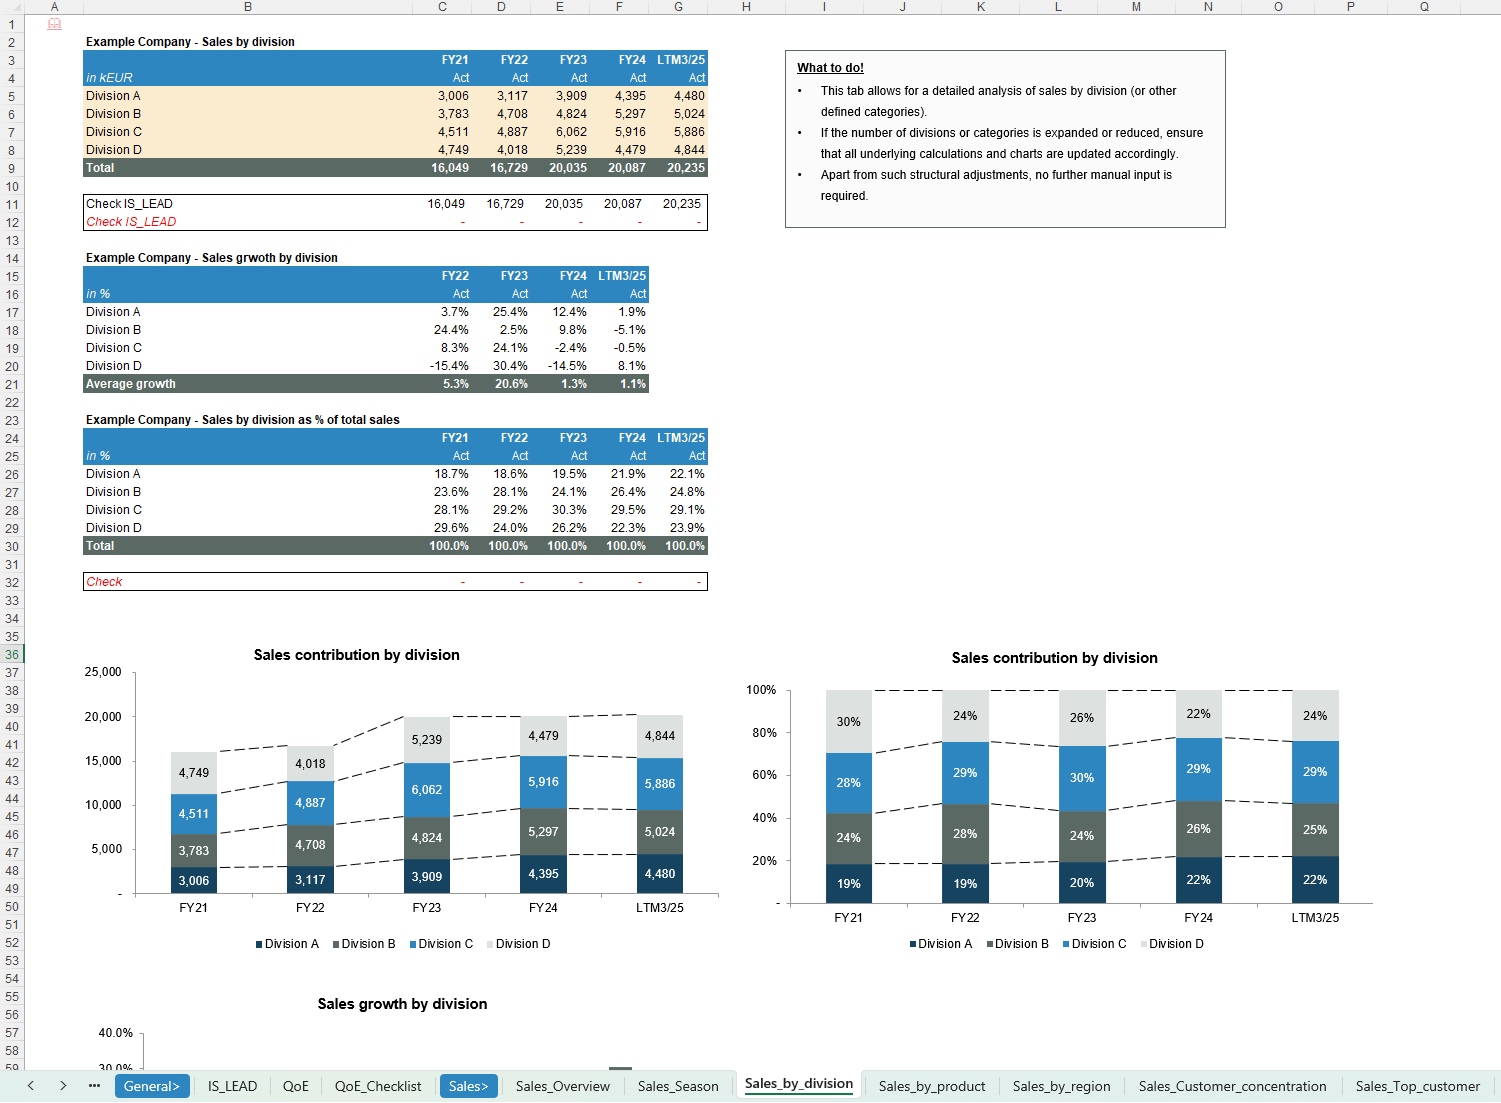
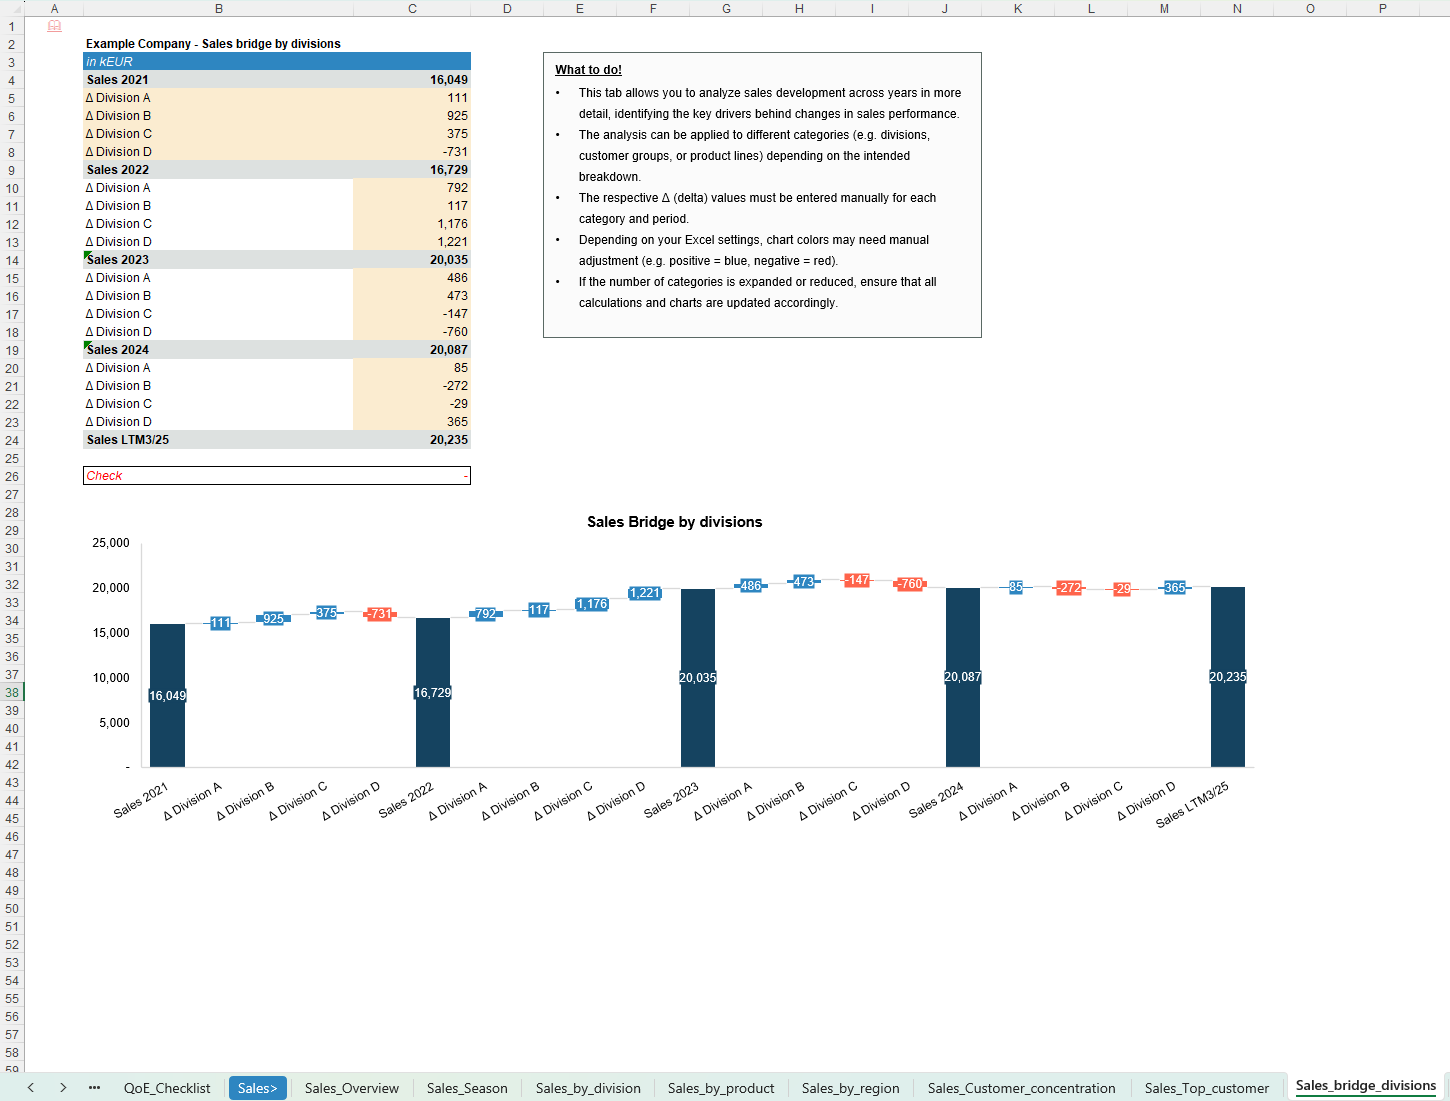
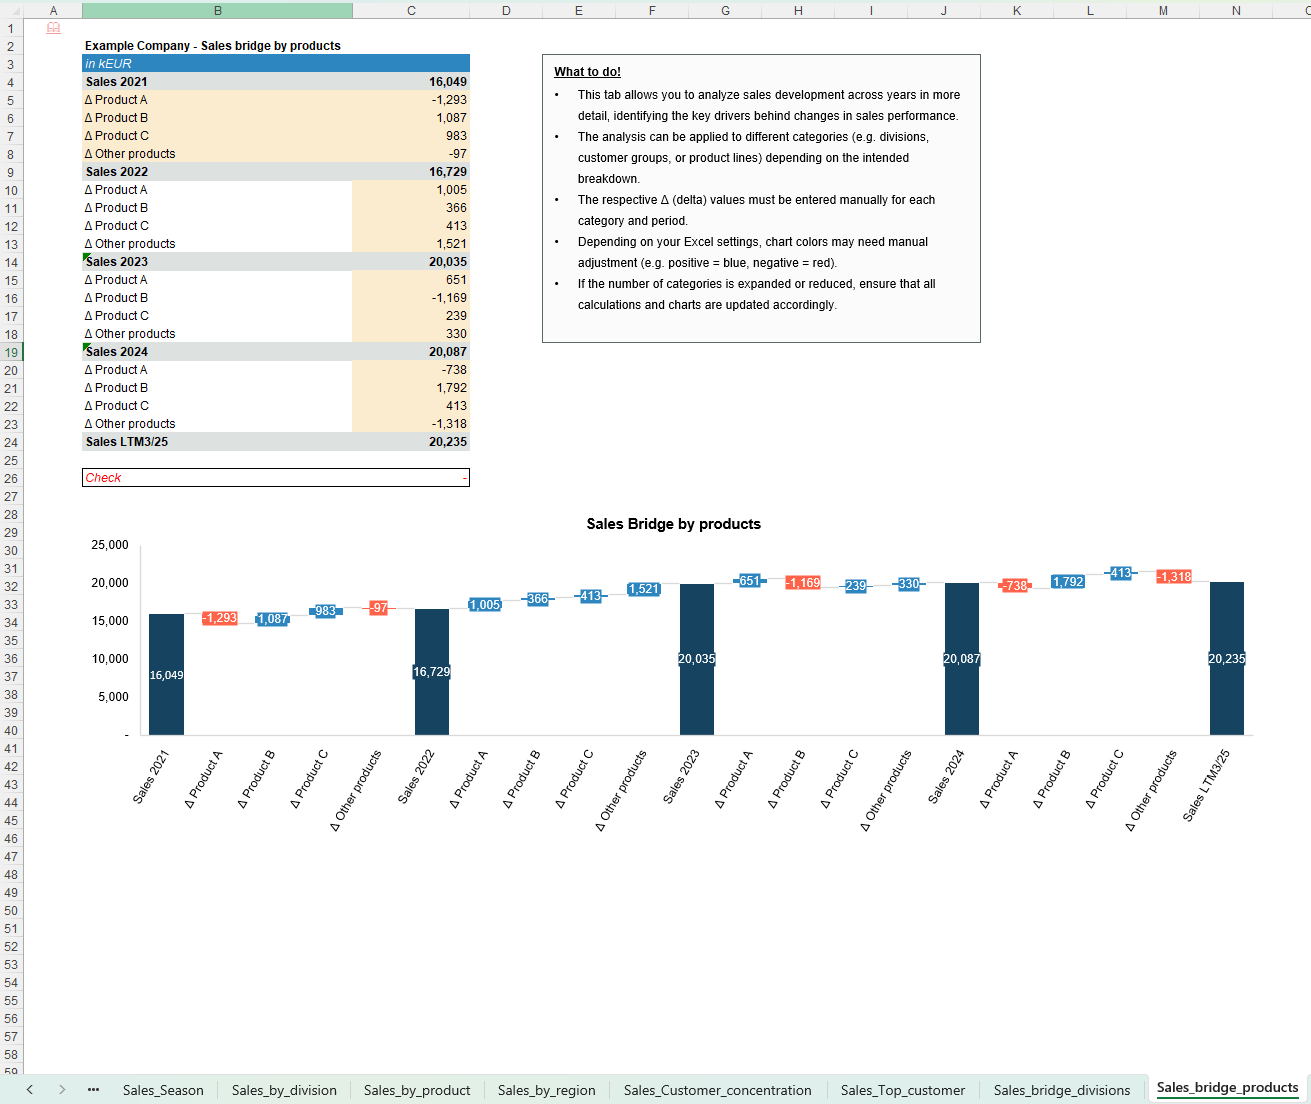
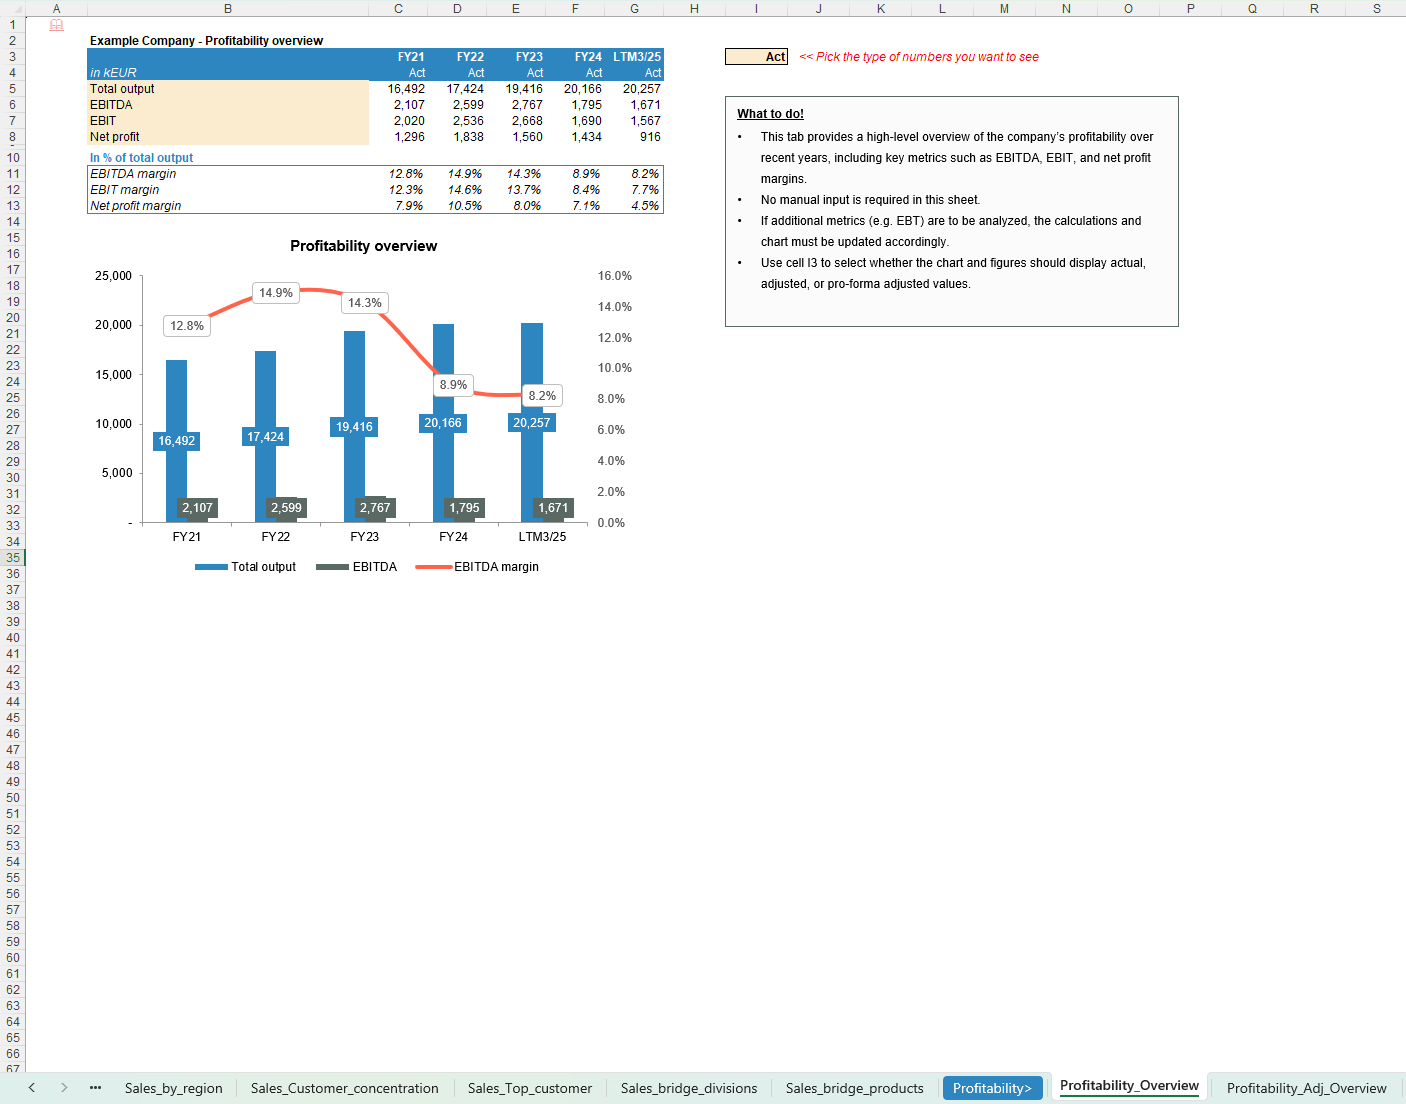
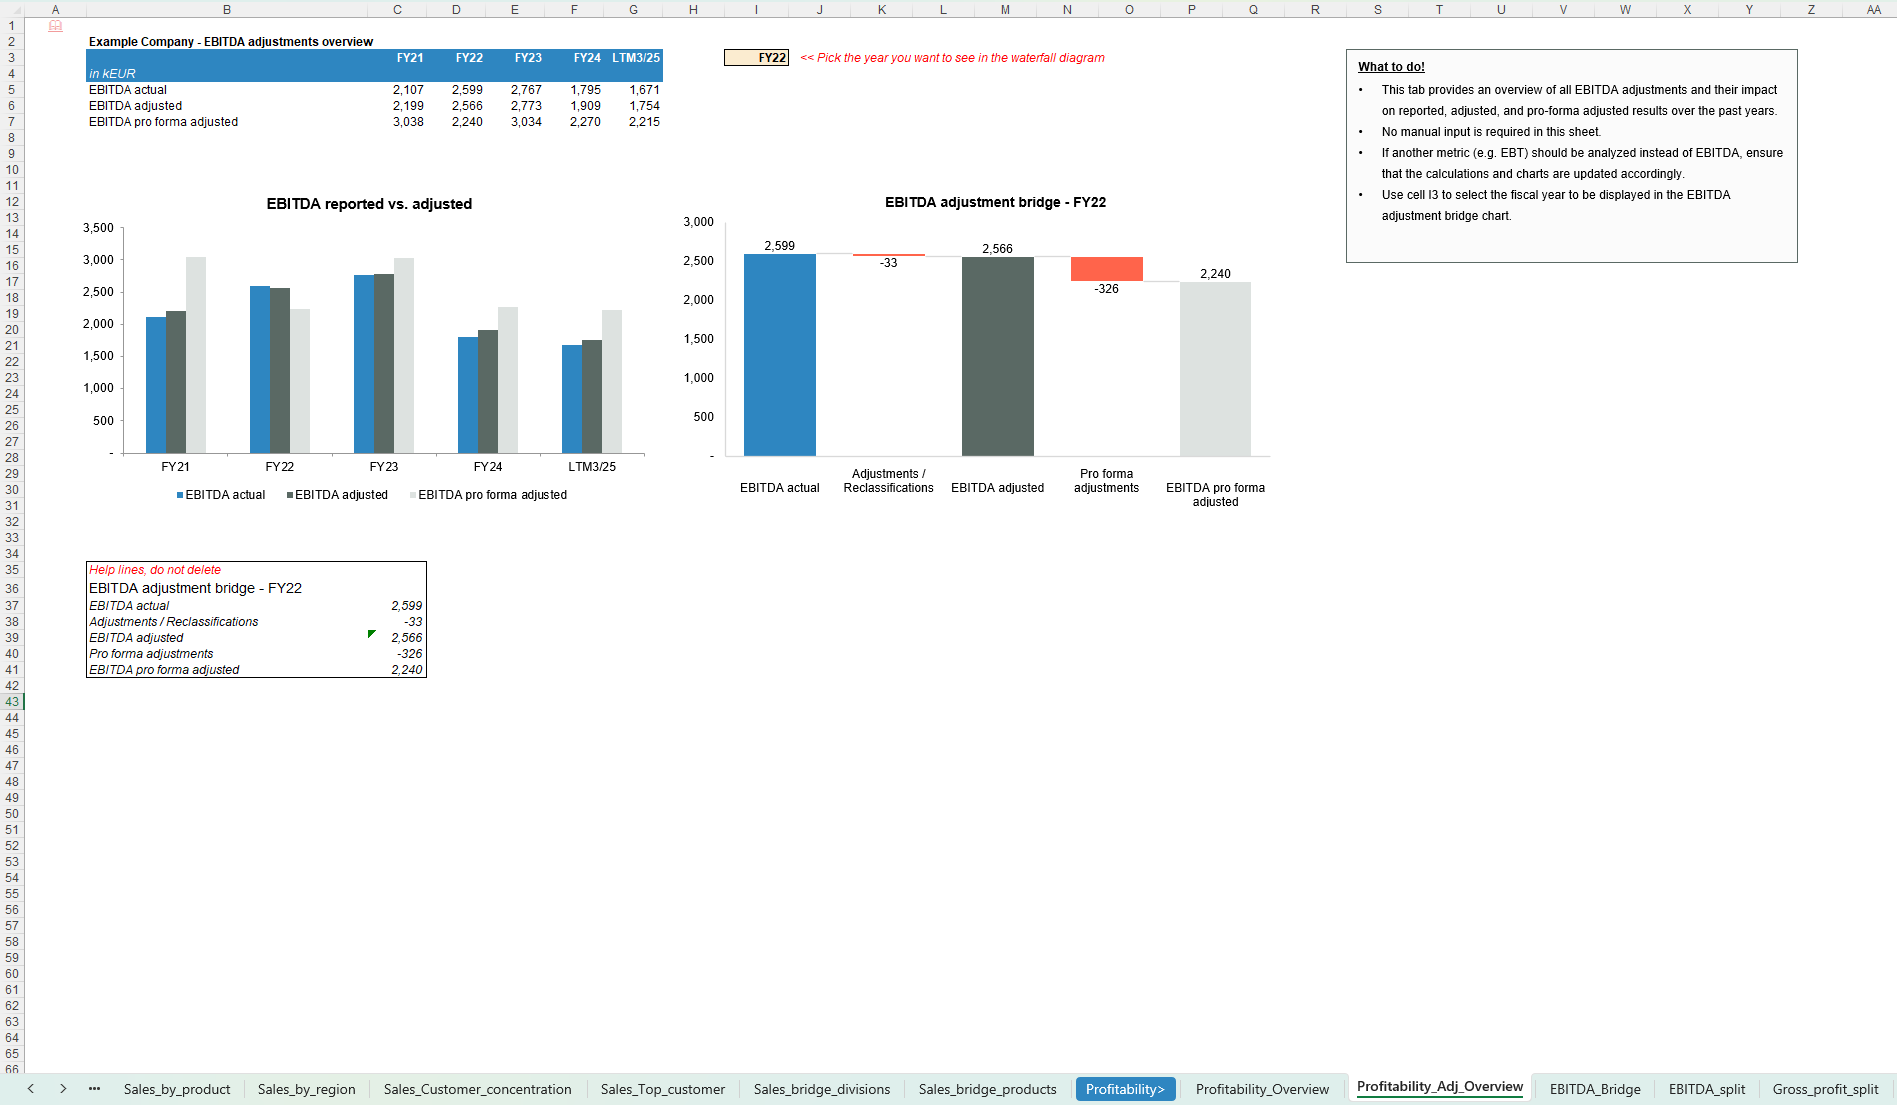
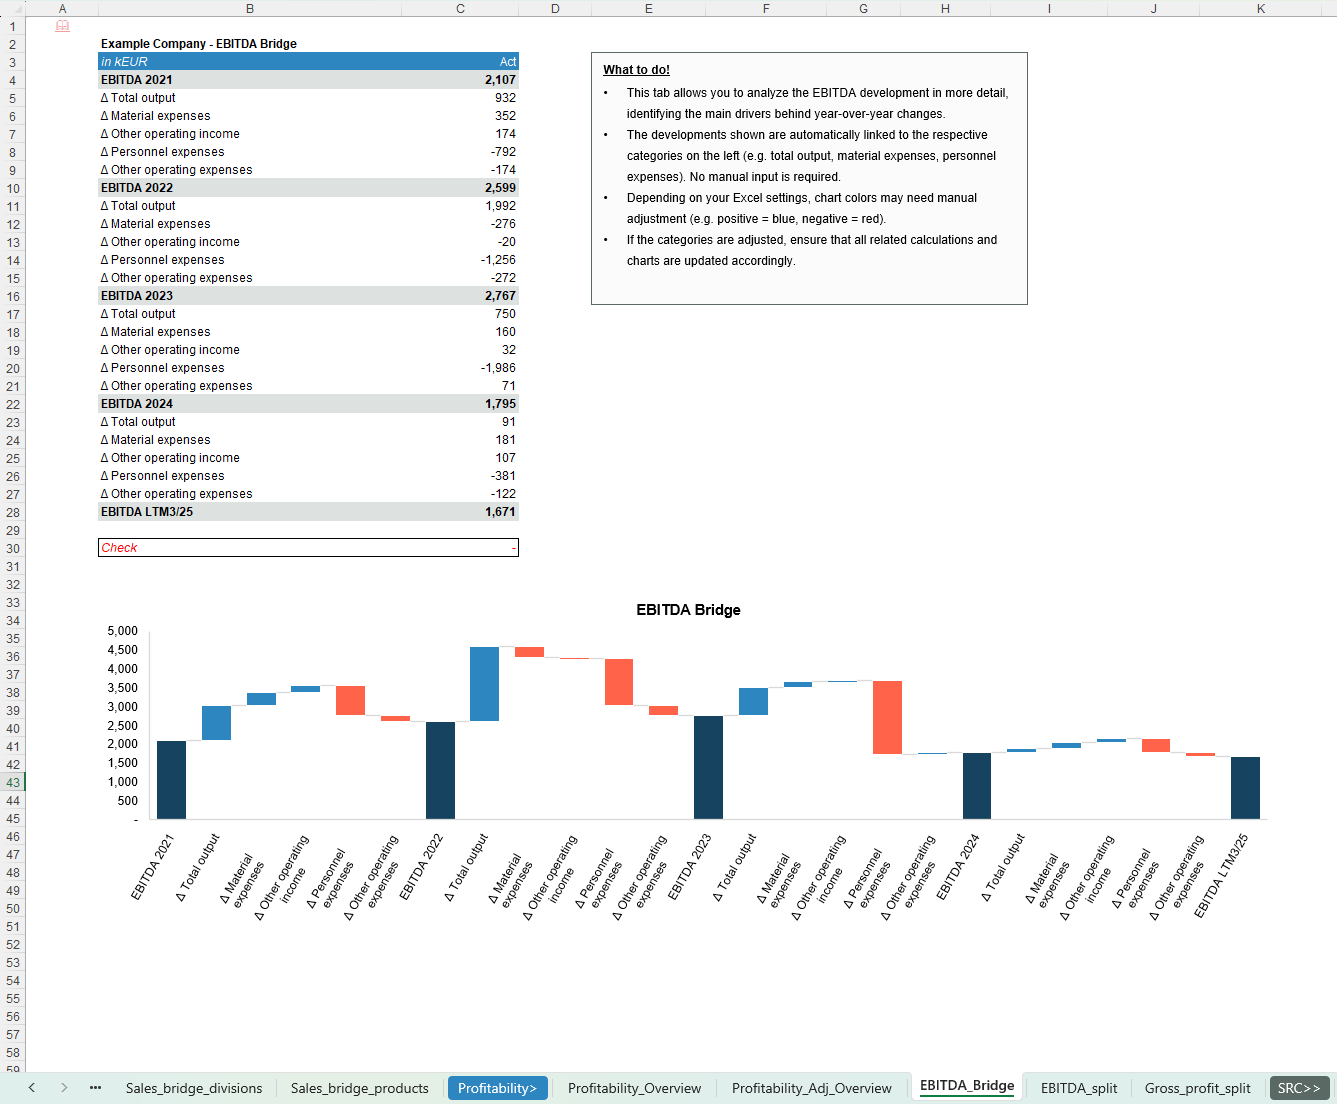
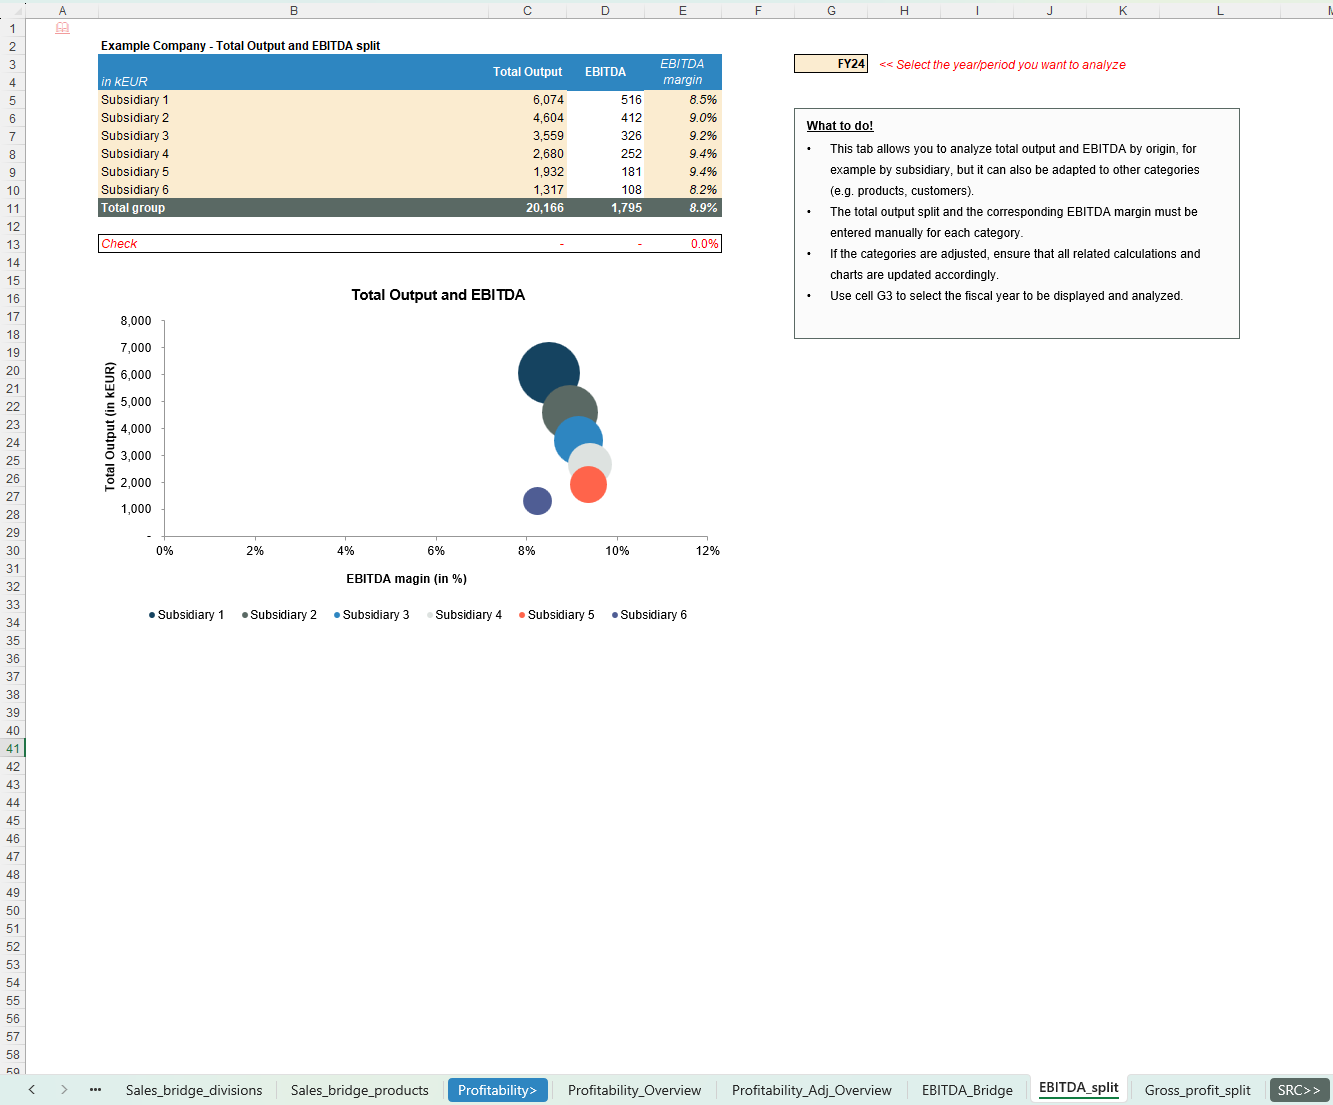
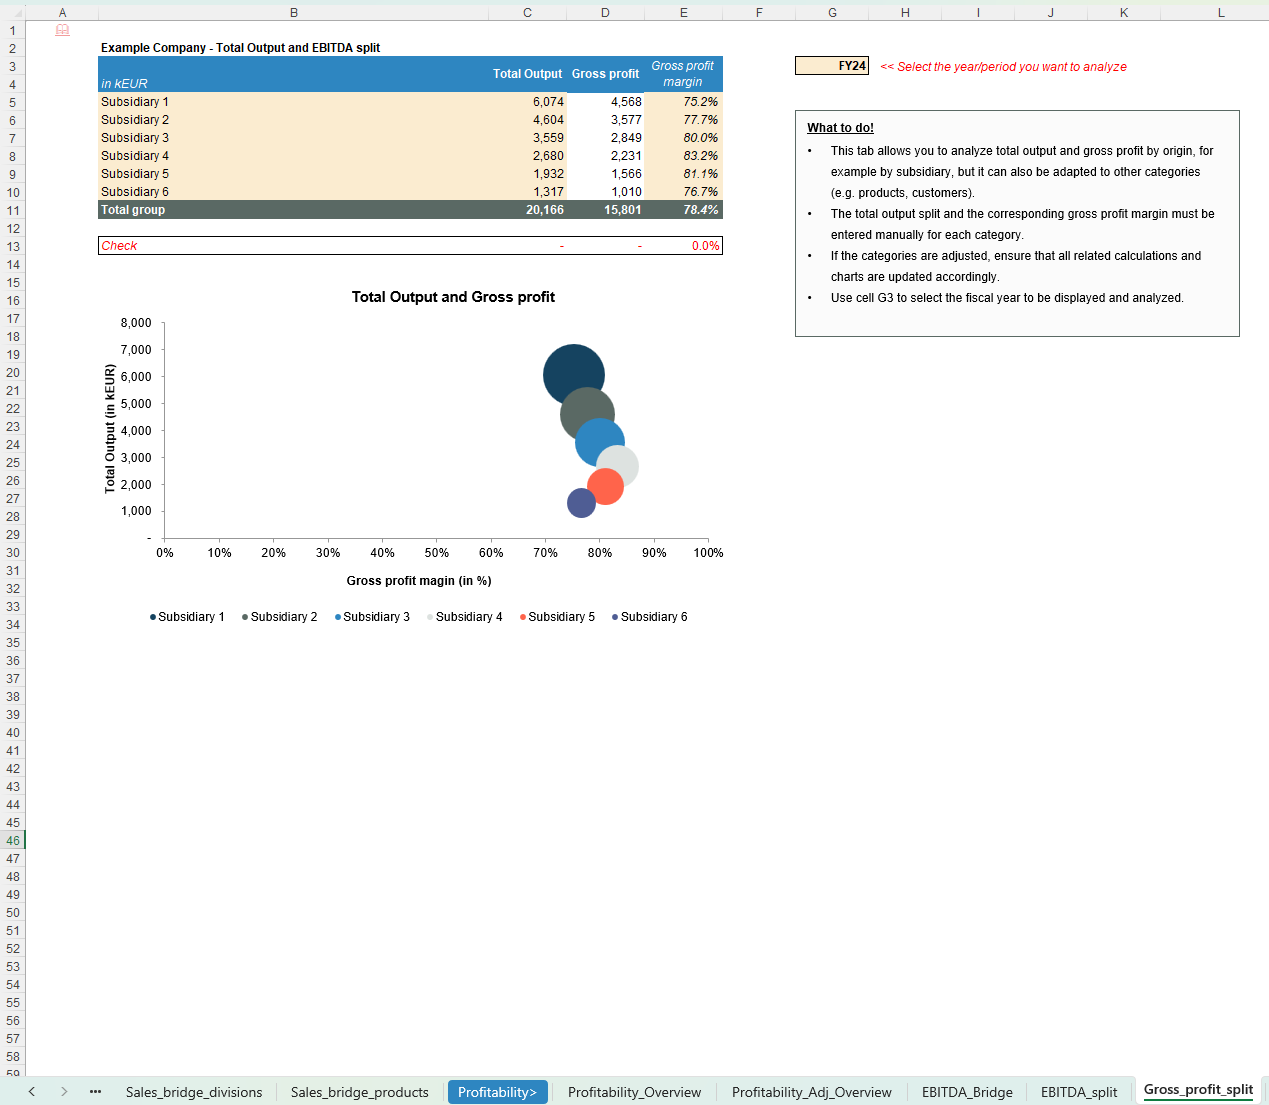
Transaction Services – FDD Sales & Profitability Analysis Model - DEMO
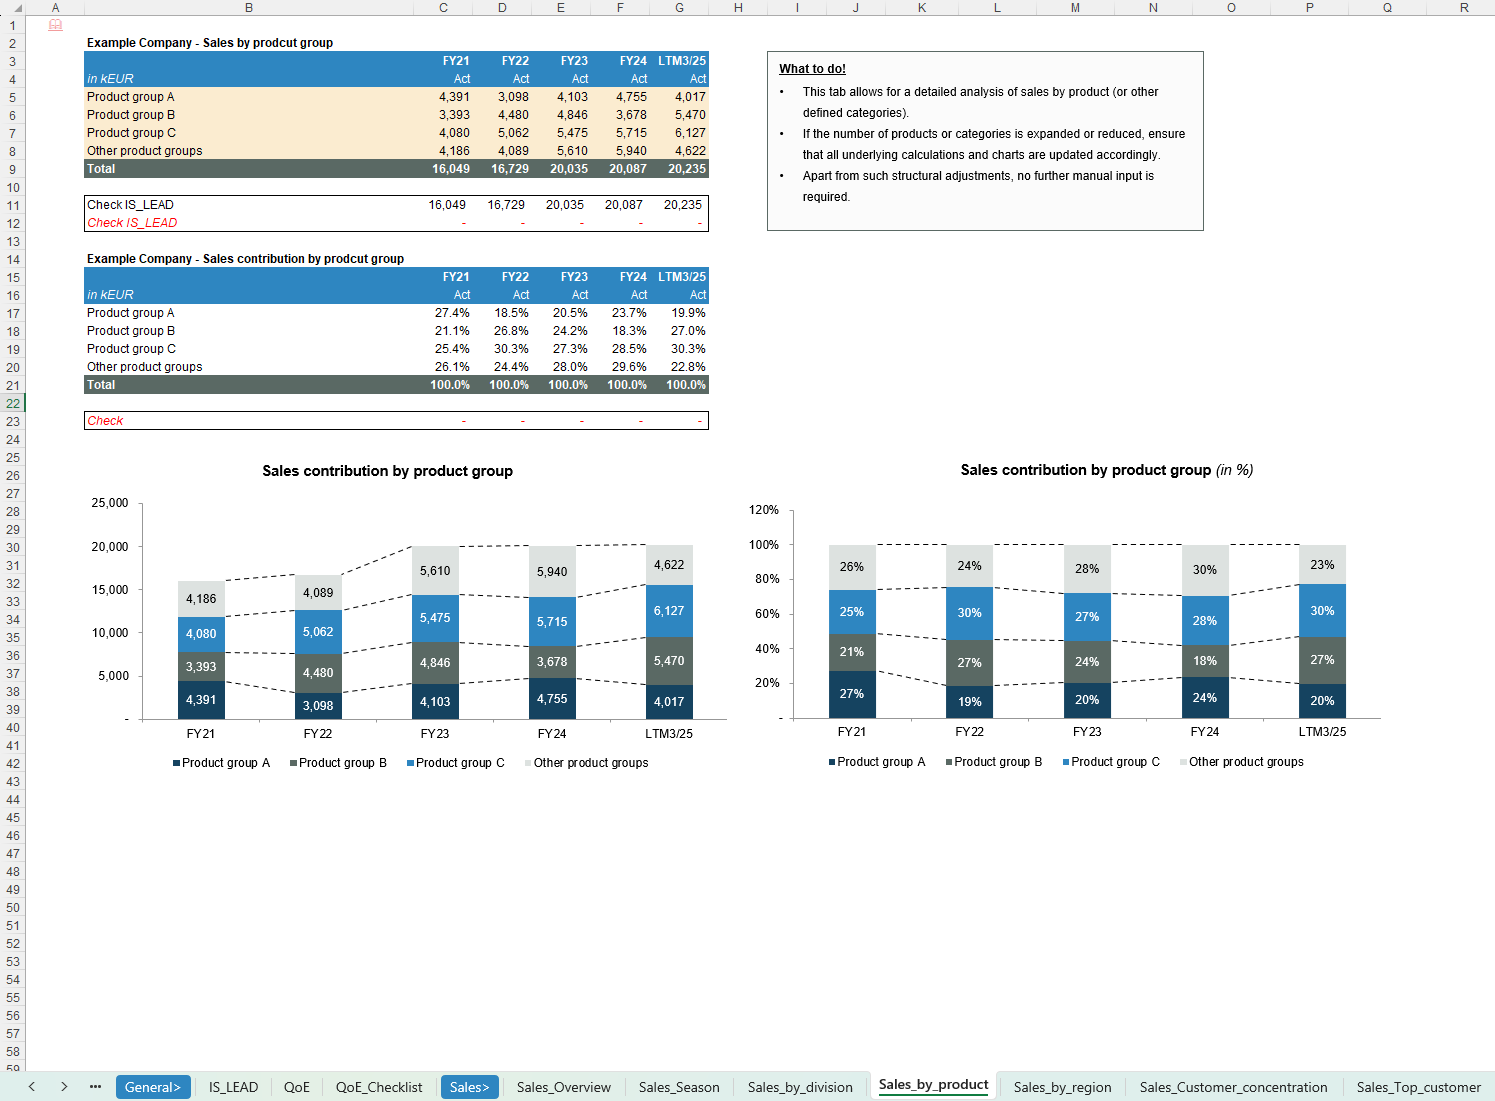
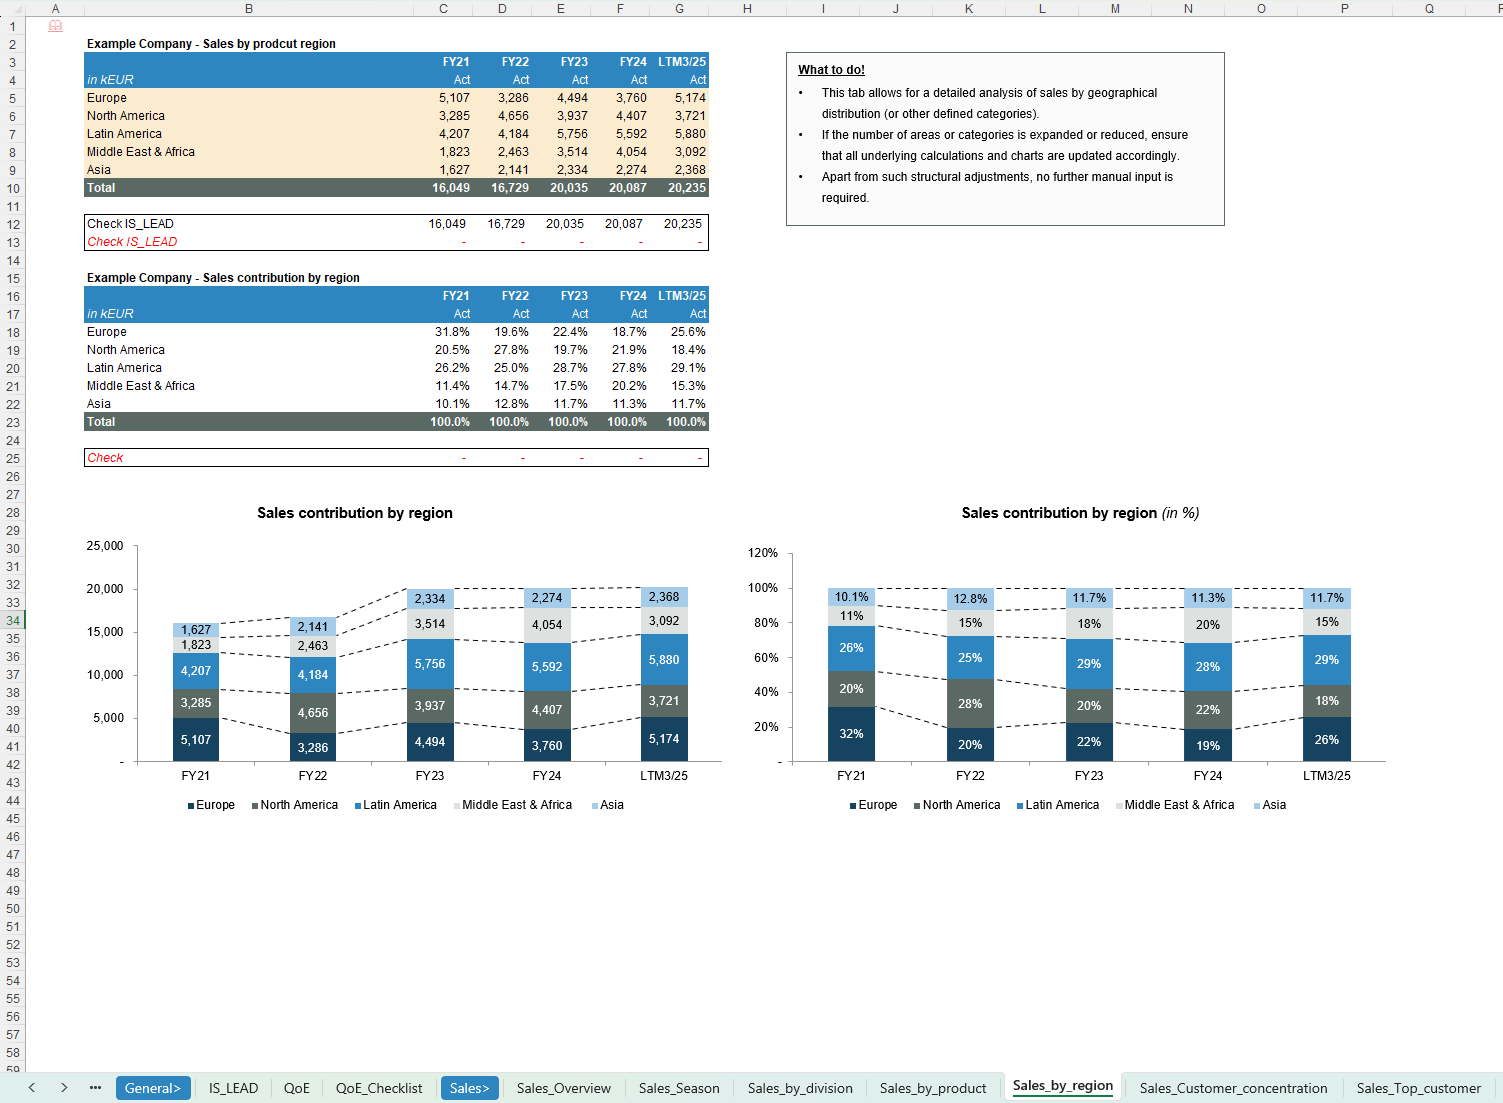
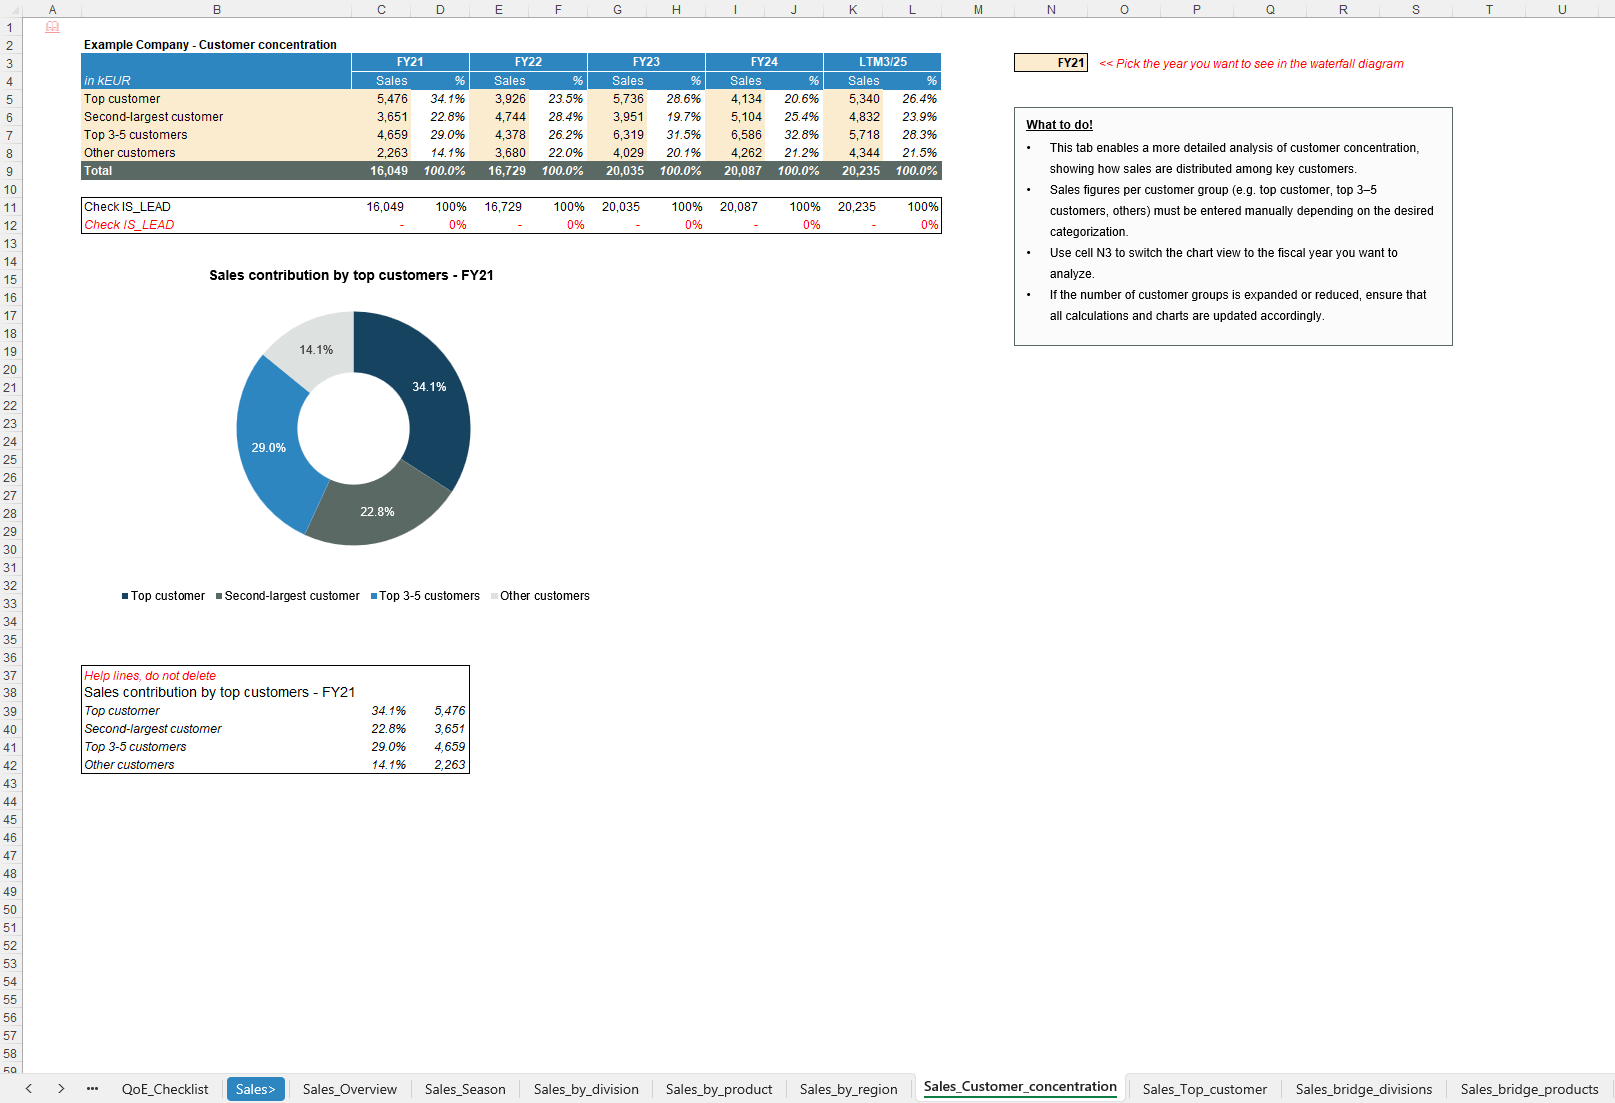
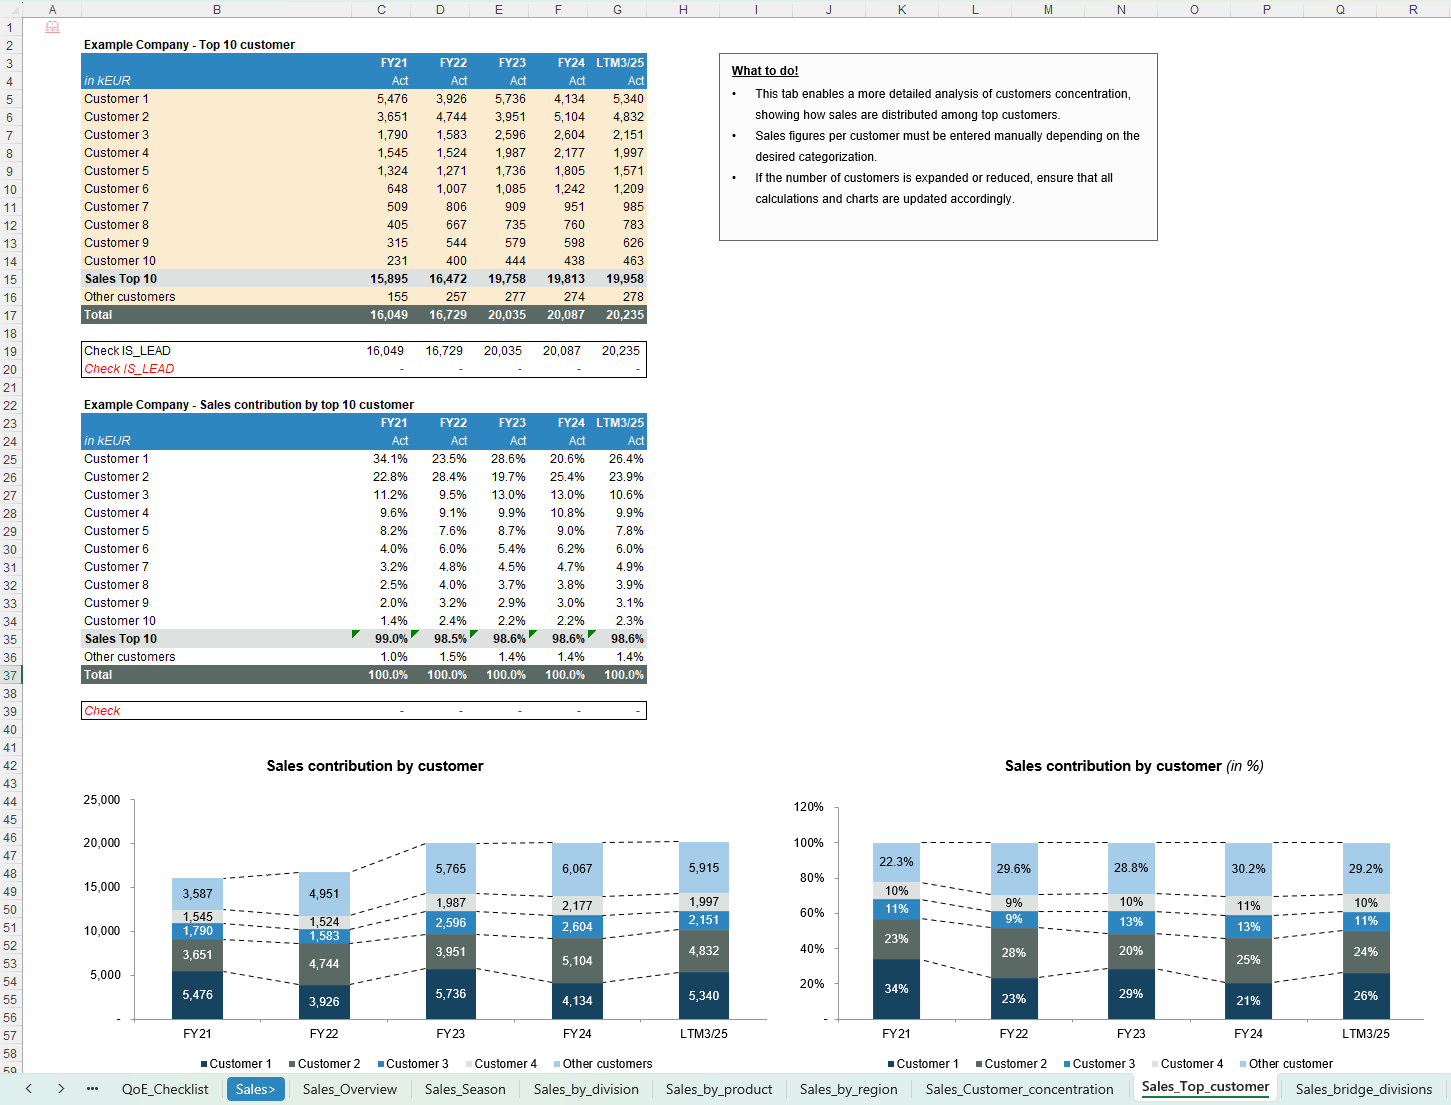
This FDD workbook for Transaction Services enables multi-dimensional sales and profitability analysis incl. Quality of Earnings for DD factbooks.
Independent financial analyst with a focus on valuation, transaction services, M&A analyses.Follow
Further information
FDD workbook for Transaction Services enabling multi-dimensional sales and profitability analysis incl. QoE for focused DD factbooks.
