Originally published: 11/12/2024 15:07
Last version published: 09/01/2025 11:06
Publication number: ELQ-52339-2
View all versions & Certificate
Last version published: 09/01/2025 11:06
Publication number: ELQ-52339-2
View all versions & Certificate

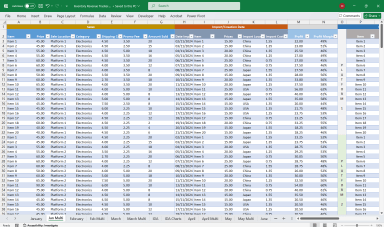
Sales Revenue & Expense Tracker w/ Inventory Discount Analysis in Excel
Multi-Platform Sales Revenue & Expense Tracker w/ Inventory Discount Analysis in Excel
AllFinancialModels offer a curated selection of high-quality yet financial model templates designed to support a wide range of business needs.Follow
Further information
To Monitor Sales Revenue & Expenses, Track Inventory Discount Sales
