


Originally published: 12/07/2018 10:36
Last version published: 11/03/2021 15:30
Publication number: ELQ-90046-6
View all versions & Certificate
Last version published: 11/03/2021 15:30
Publication number: ELQ-90046-6
View all versions & Certificate

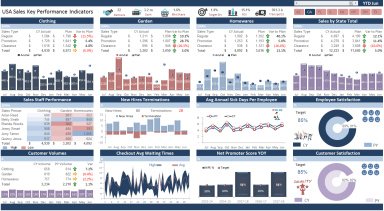
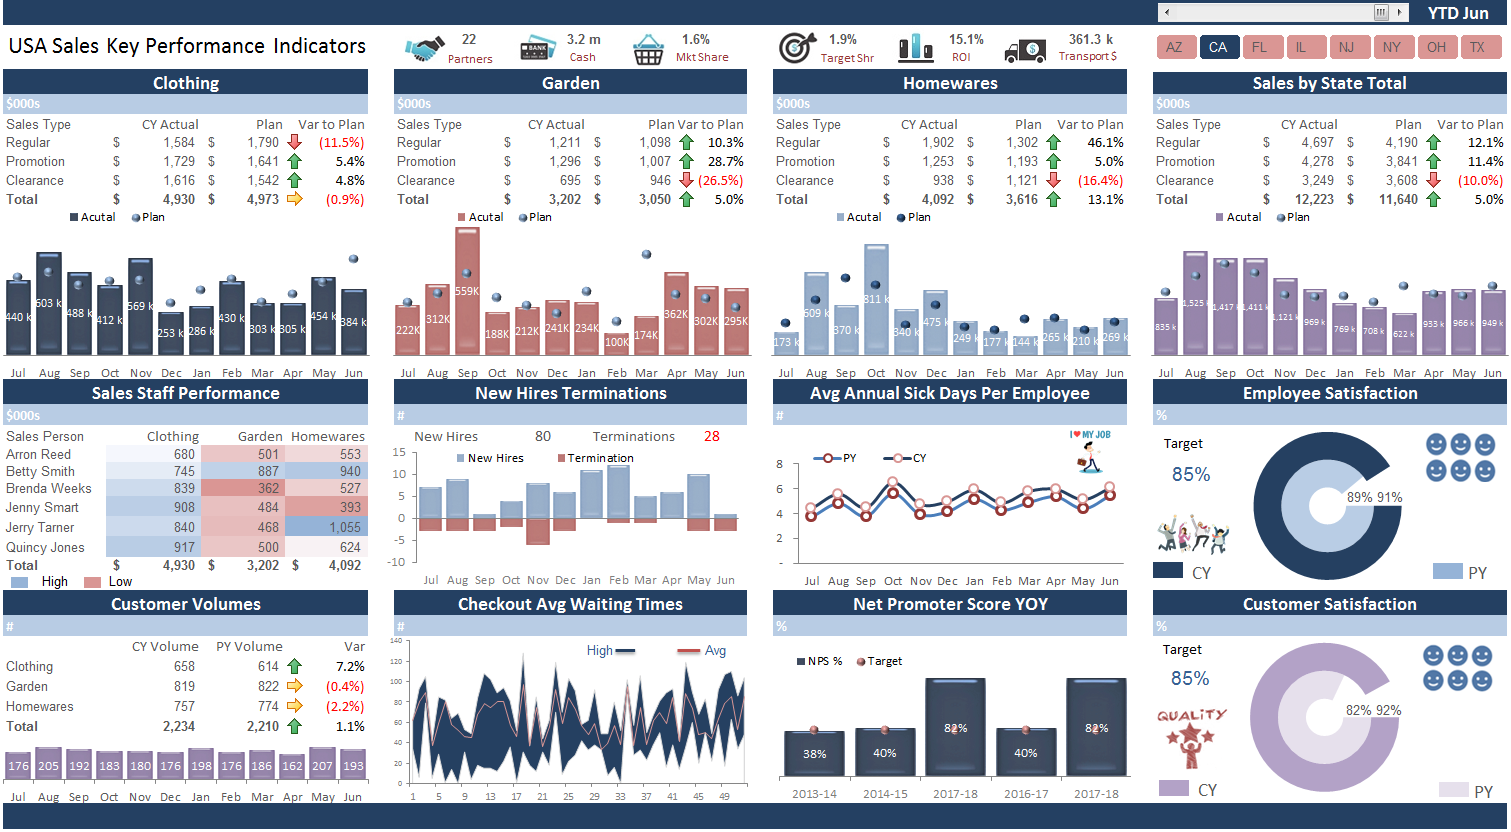
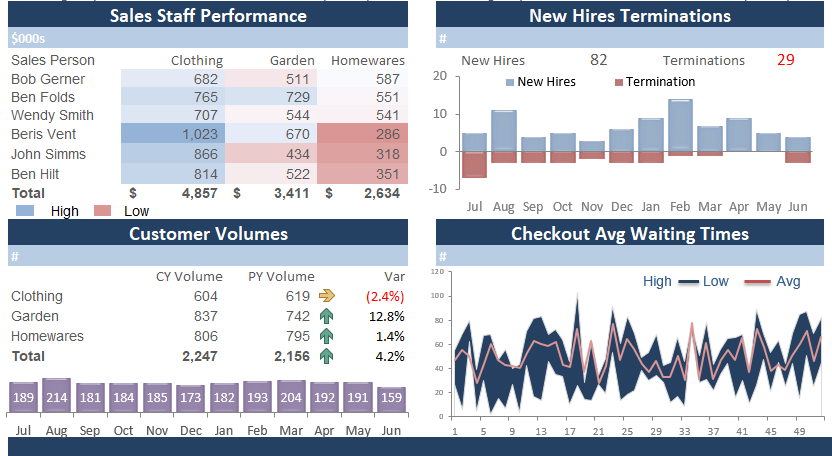
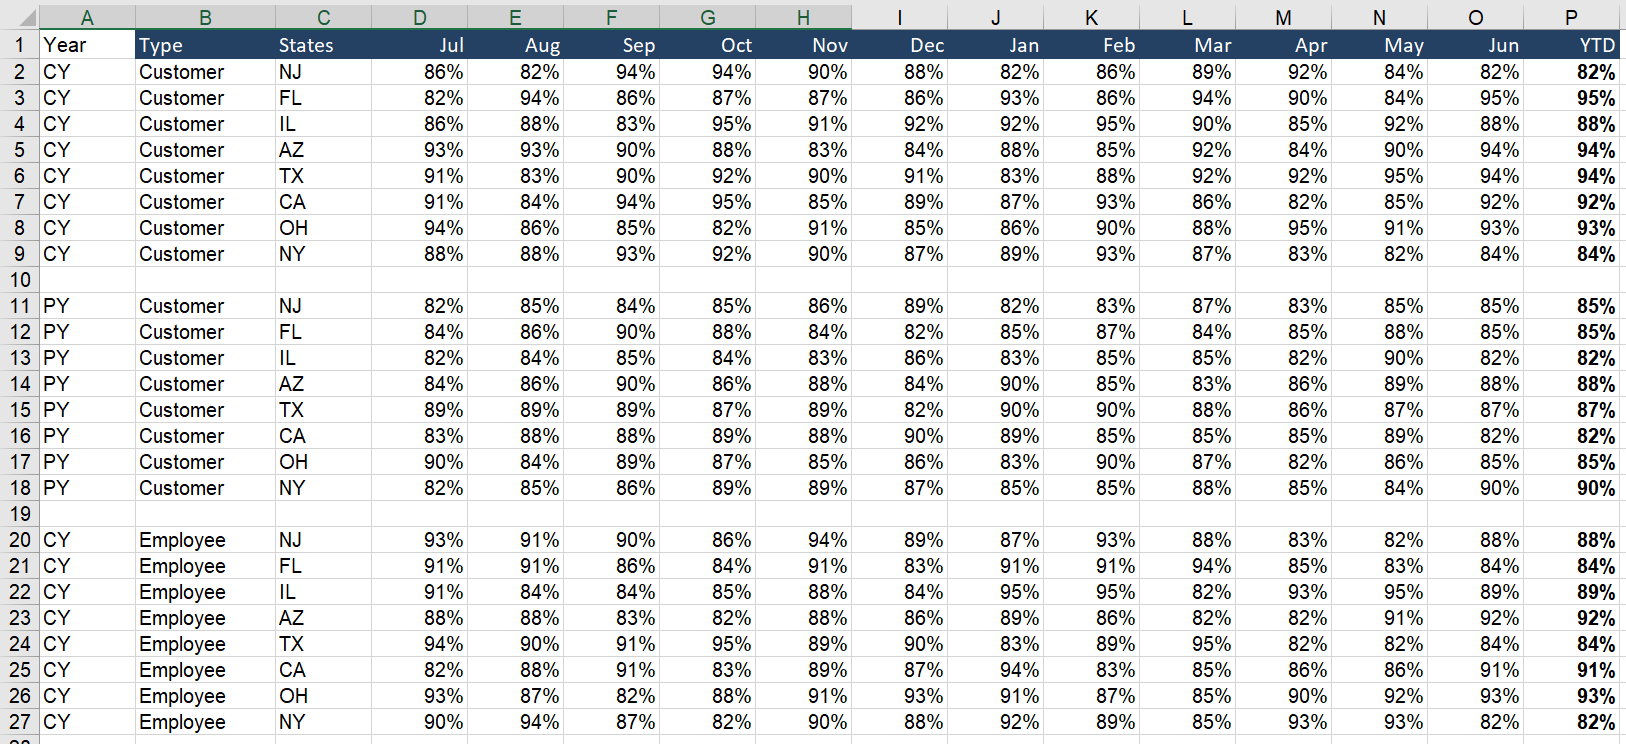
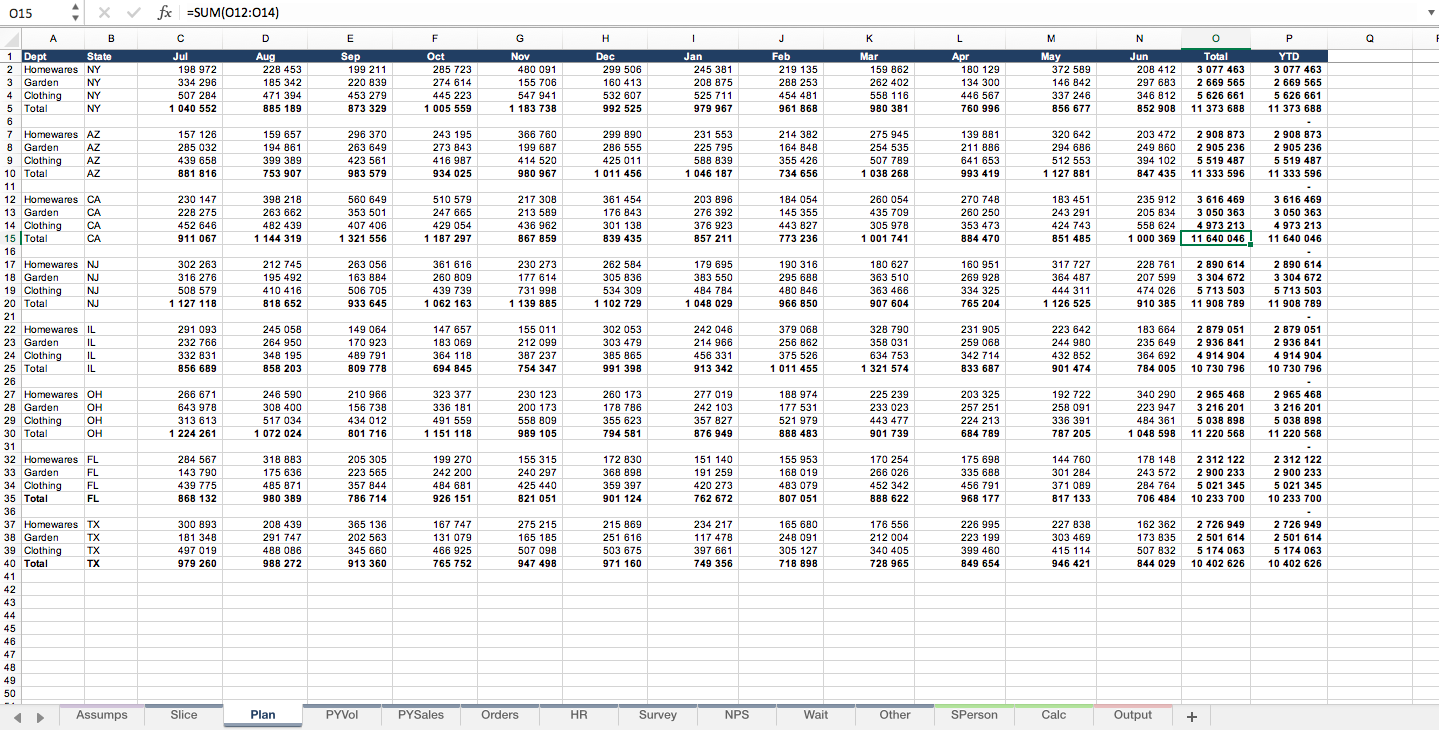
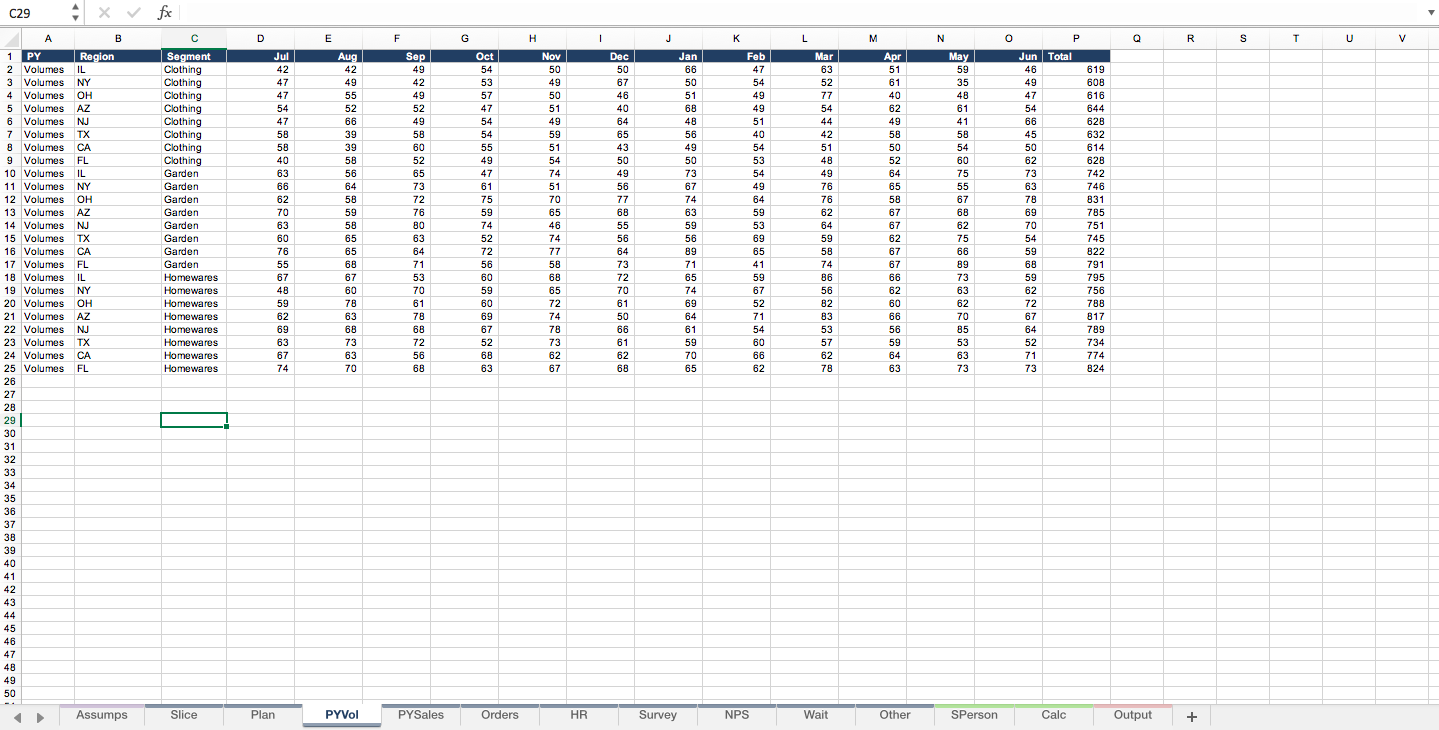
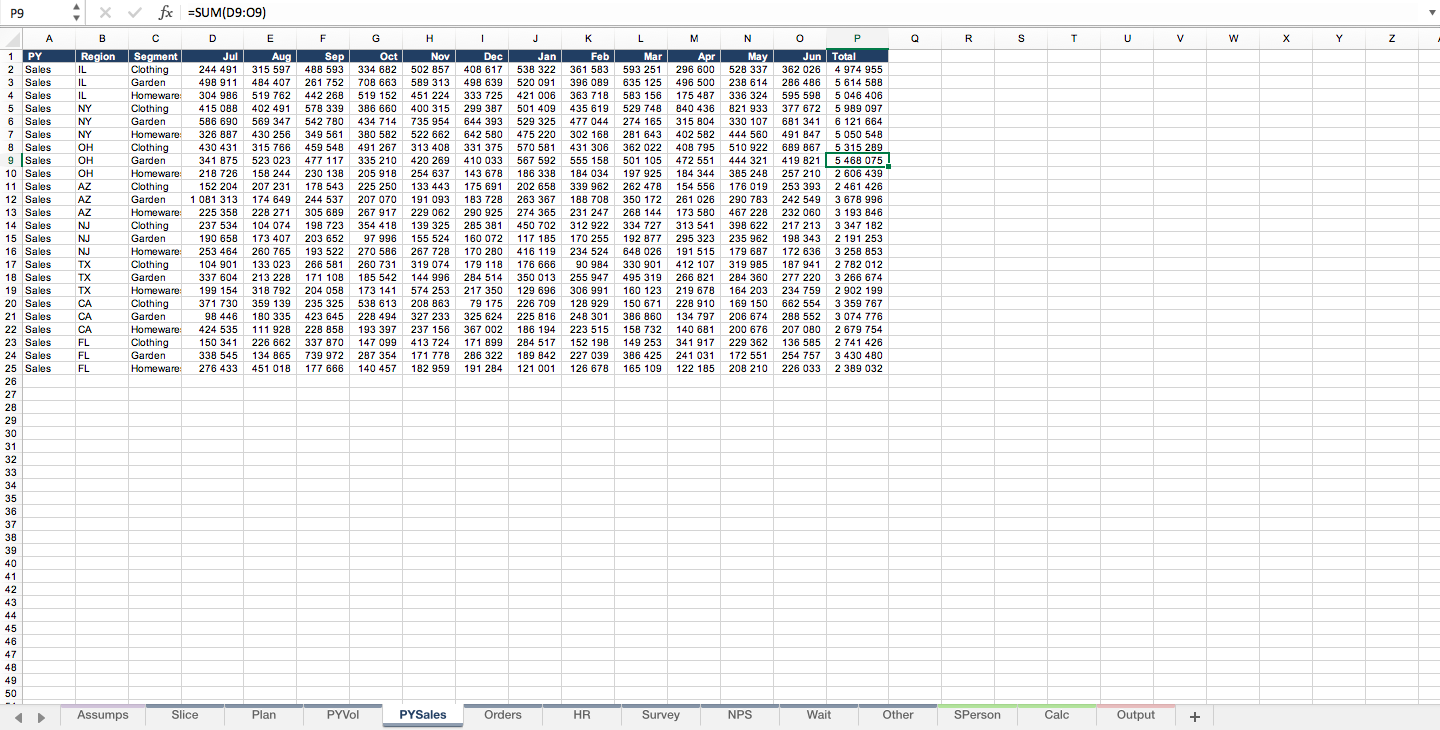
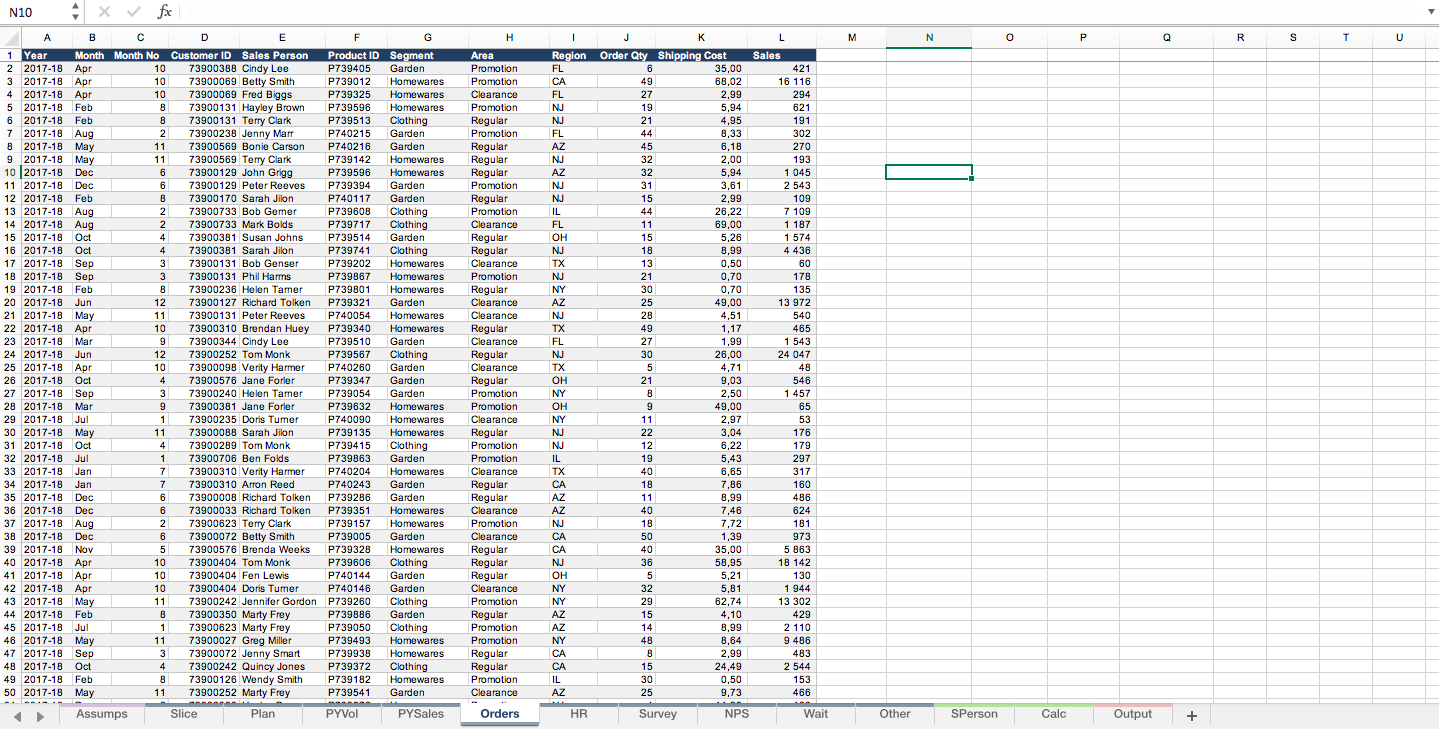
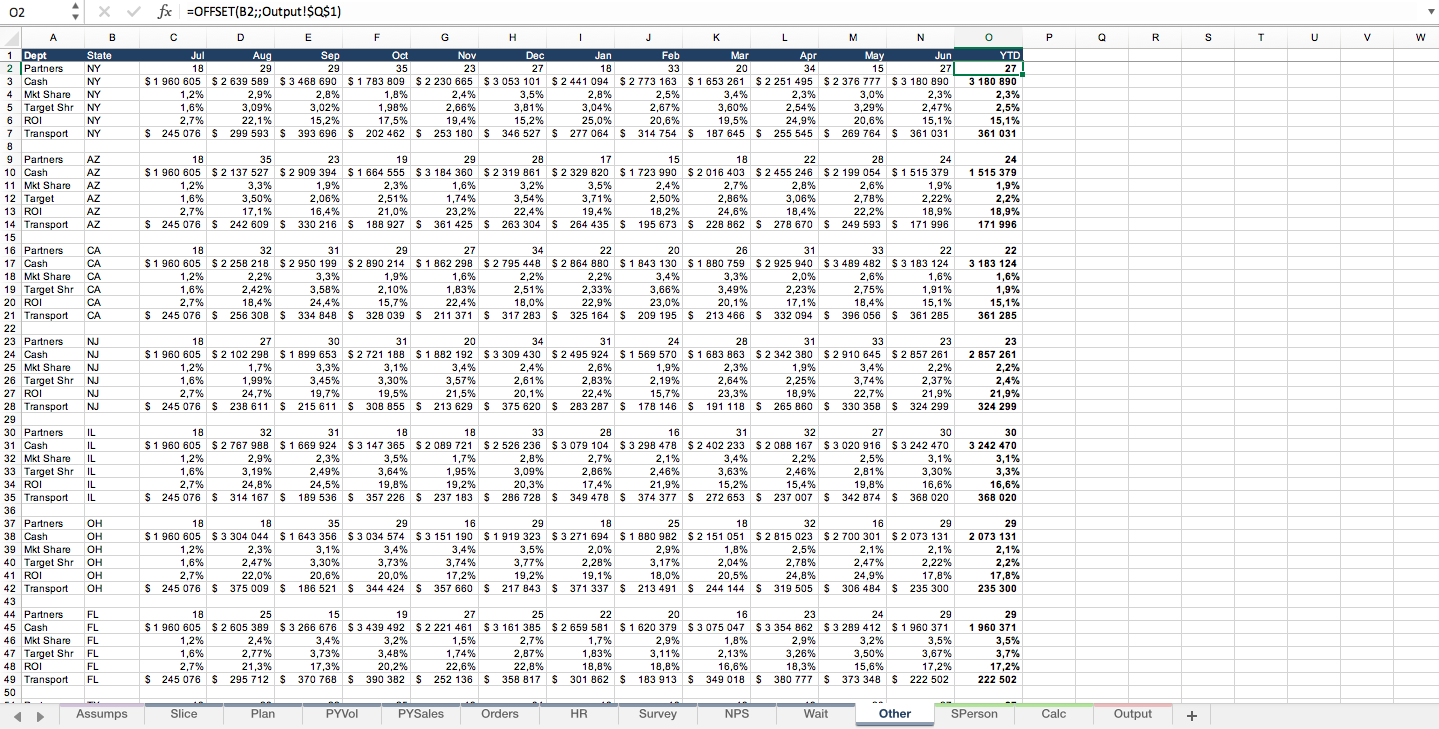
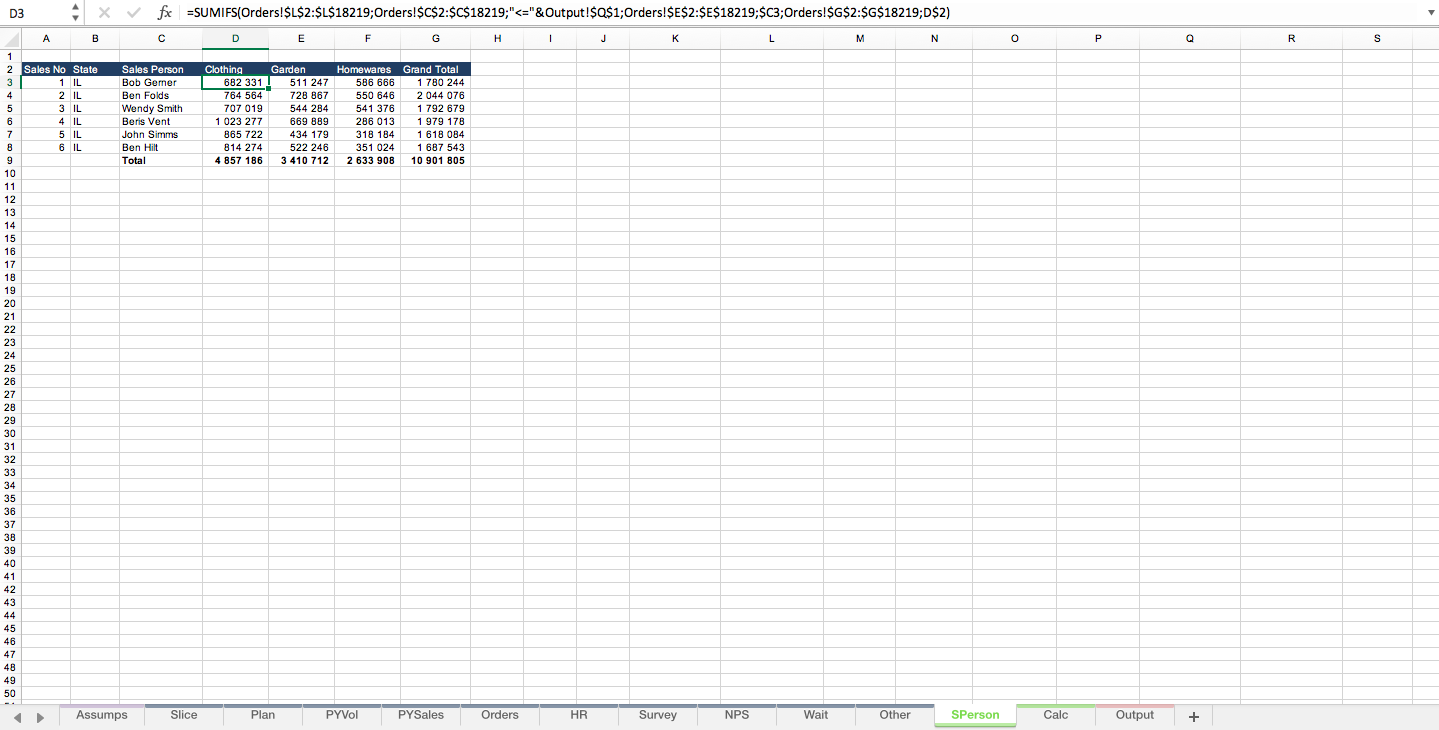
Sales KPI Dashboard Report
This report summaries a range of financial and non financial data in a succinct 1 page summary which is highly pliable.
Further information
The tool displays KPI Sales metrics in a clean clear way. Many metrics are summarised on a single page saving the user days in development time if starting from scratch.
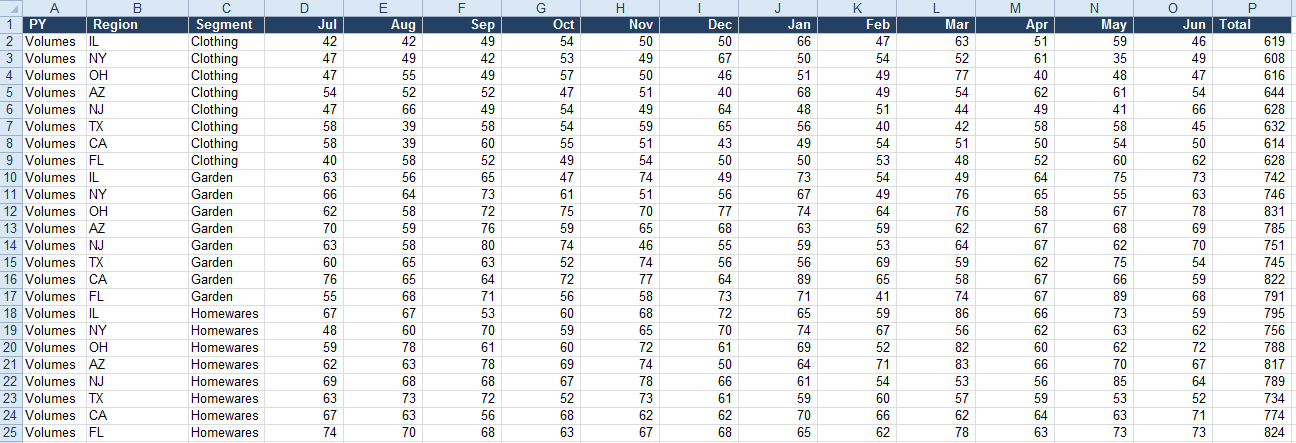
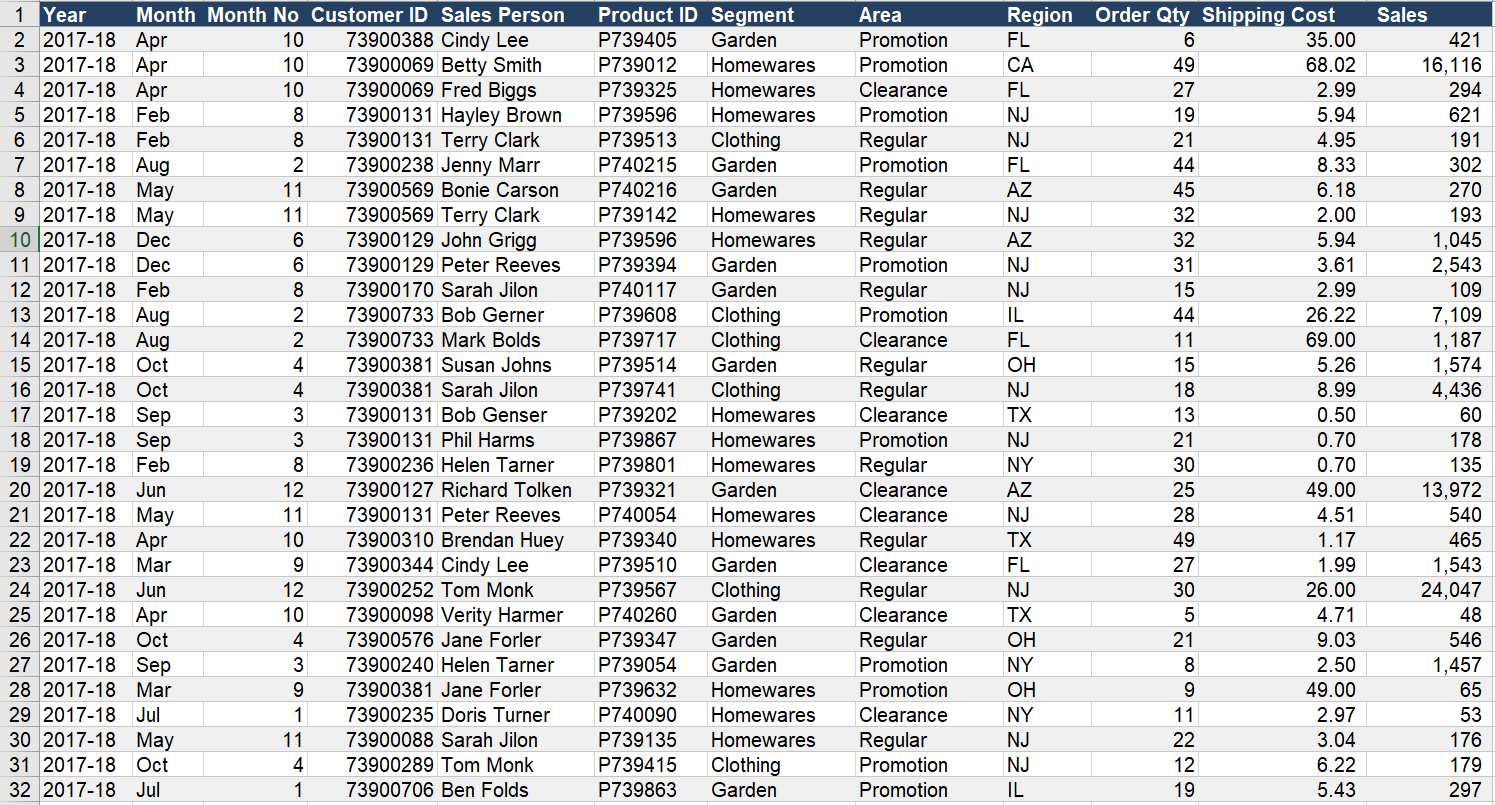
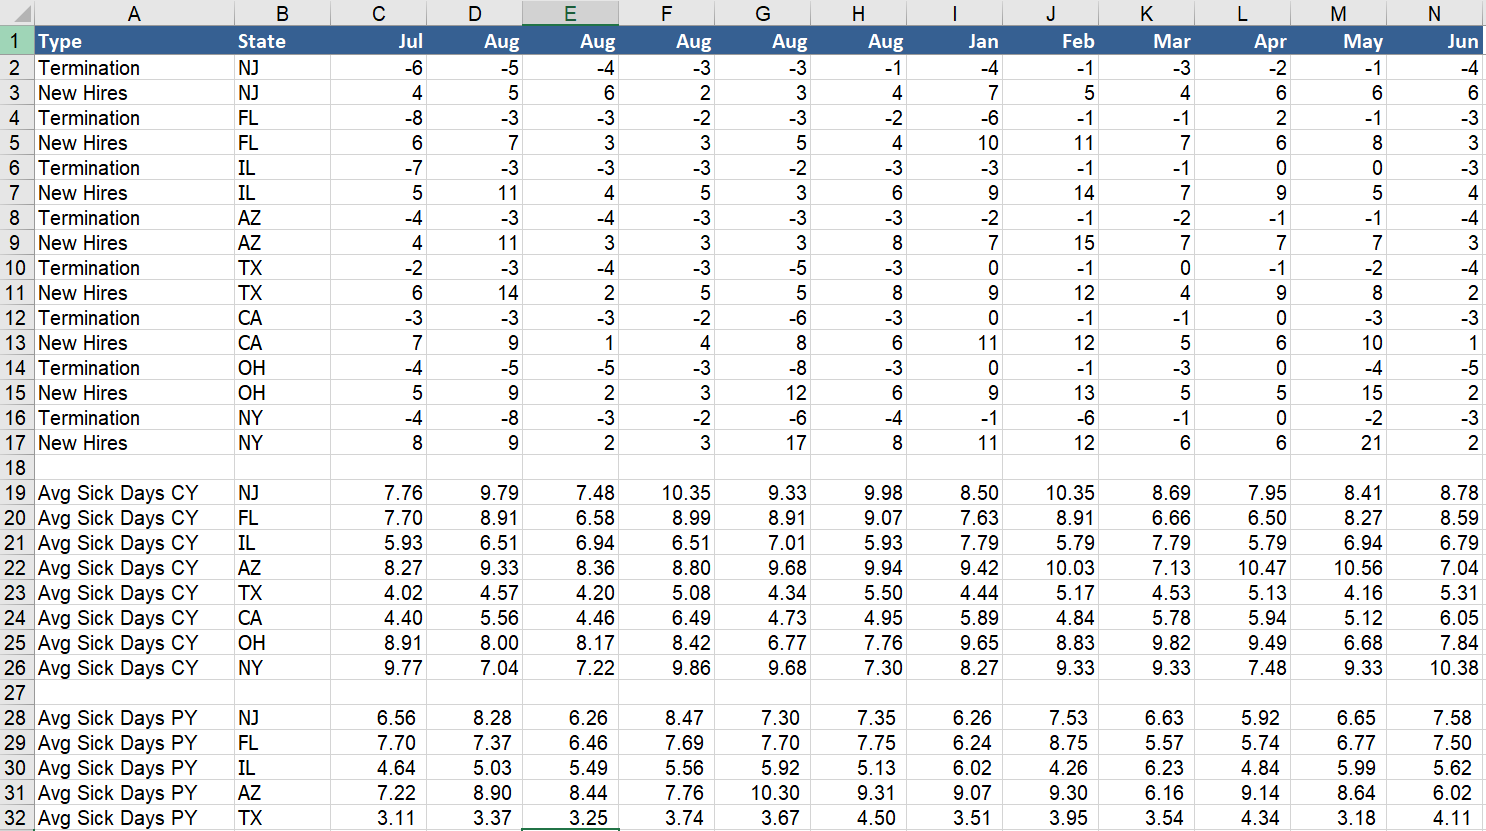
Upload datasets into the model and generate summaries based on month and year to date.
