Hospital Management Dashboard | Patient, Revenue & KPI Analytics Excel Template

Interactive Excel dashboard to track hospital patients, admissions, revenue, and KPIs efficiently

Description
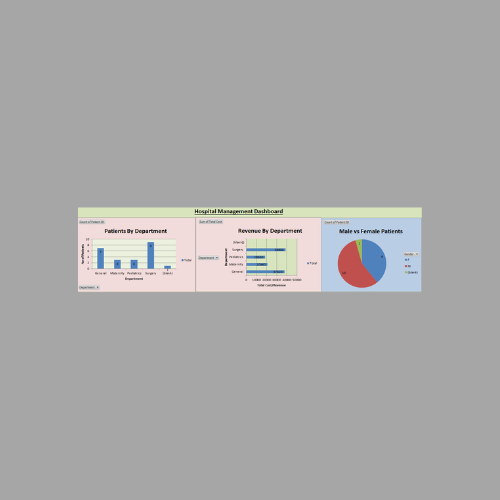
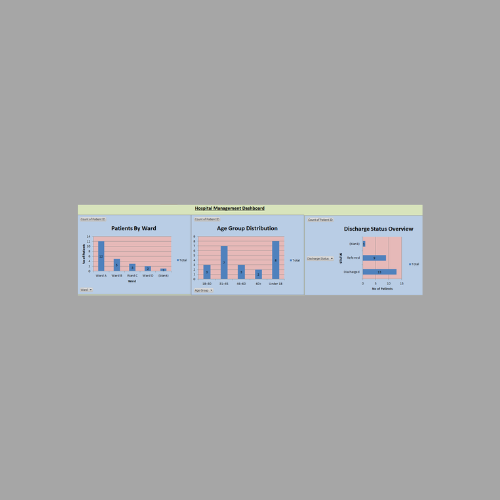
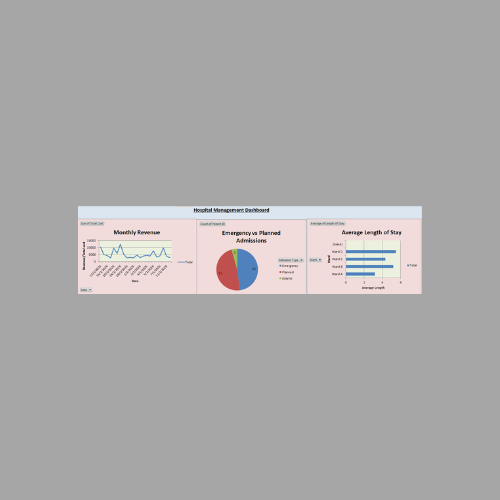
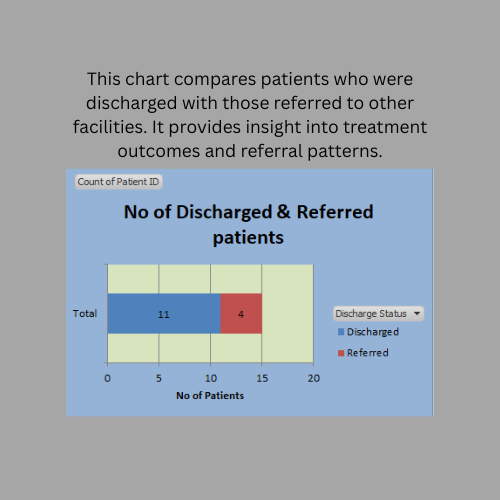
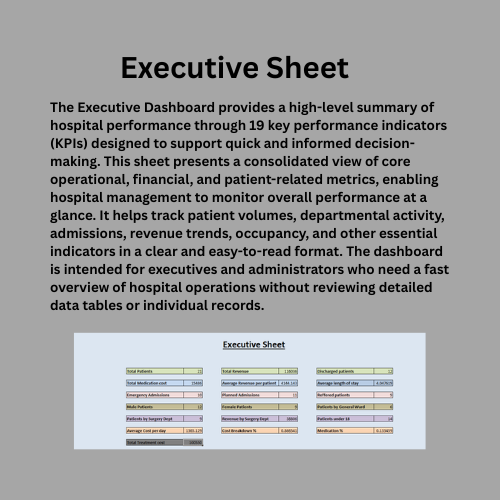
The Hospital Management Dashboard is a comprehensive Excel-based tool designed to help hospitals, clinics, and healthcare administrators monitor operational and financial performance efficiently. This interactive dashboard provides real-time insights into patient admissions, discharges, length of stay, departmental performance, and revenue metrics. With 19 KPI indicators and multiple dashboards, users can track total patients, total revenue, medication costs, discharge status, and average revenue per patient, among other key metrics.

Data is entered in a structured Input Data sheet with columns such as Date, Department, Ward, Patient ID, Admission Type, Age, Gender, Diagnosis, Treatment Cost, Medication Cost, Total Cost, Length of Stay, and Discharge Status. Once new records are added, all dashboards and KPI charts update automatically, eliminating manual calculations.

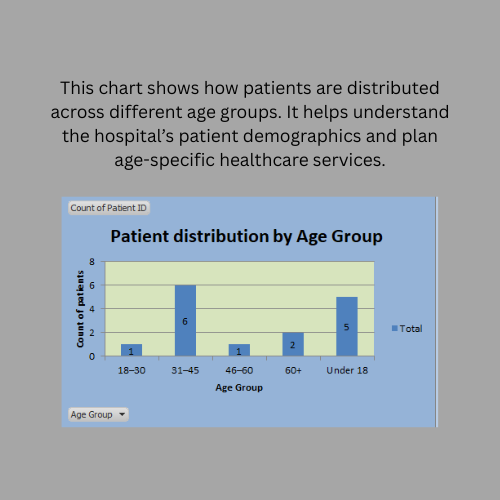
The dashboard also features interactive filters and slicers, allowing users to analyze data by department, ward, admission type, gender, and age group. This makes it easy to identify trends, evaluate performance, and support data-driven decision-making.

Ideal for hospital managers, finance teams, and healthcare analysts, this dashboard simplifies reporting, enhances operational efficiency, and ensures transparency in patient and cost management. No advanced Excel skills are required, making it accessible to professionals at all levels.

This tool is perfect for strategic planning, daily monitoring, and creating professional reports for management review.

This Best Practice includes
1 excel dashboard file (xlsm)

Acquire business license for $25.00

Add to cart

Add to bookmarks

Discuss

Further information

Gain instant visibility into hospital operational and financial performance.
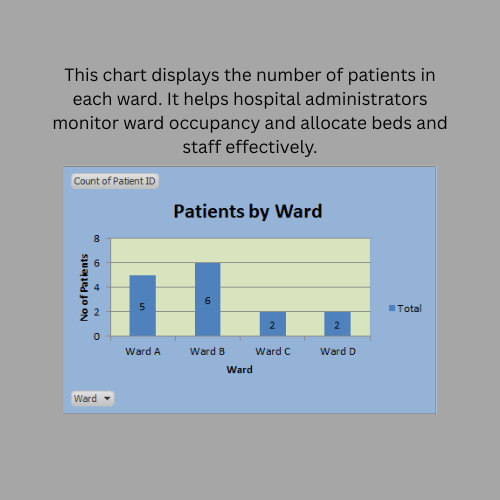
Monitor patient admissions, discharges, and ward utilization in one place.
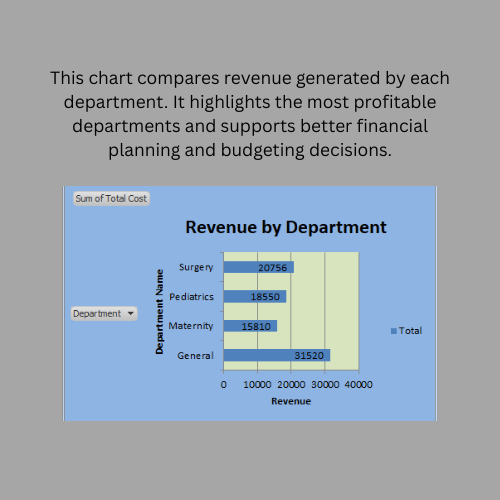
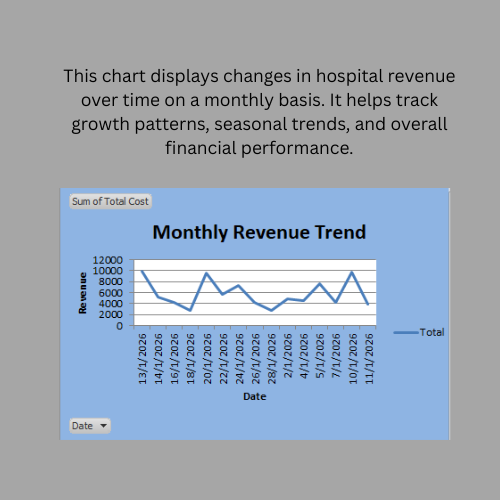
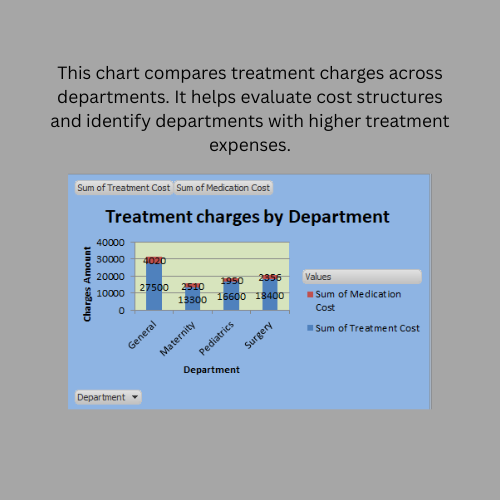
Track revenue, treatment costs, and medication expenses accurately.
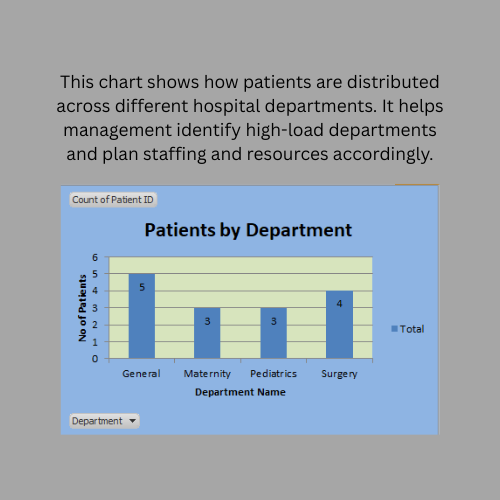
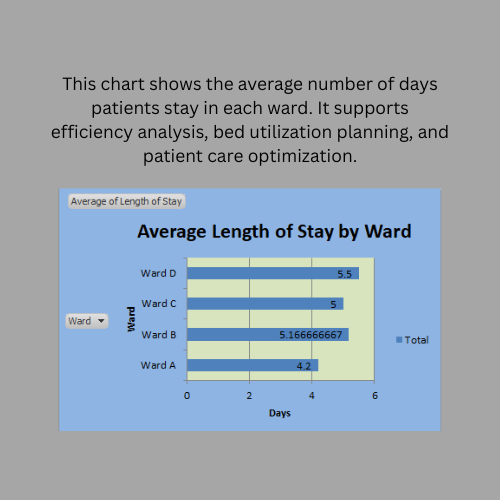
Analyze department-wise and ward-wise performance efficiently.
Support data-driven decision-making using structured KPI indicators.
Reduce manual reporting time with automated dashboard calculations.
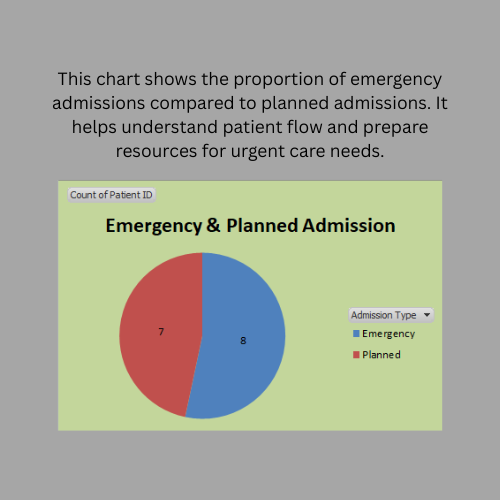
Identify trends in emergency vs. planned admissions.
Improve resource allocation and hospital planning.
Enhance transparency in patient and cost management.
Generate professional reports for management presentations.

Hospitals or clinics managing inpatient and outpatient data.
Facilities tracking patient admissions, discharges, and ward occupancy.
Institutions analyzing revenue, treatment, and medication costs.
Healthcare organizations seeking interactive dashboards for KPI monitoring.
Operations or finance teams needing structured data for reporting and decision-making.
Facilities requiring department-wise and ward-wise performance analysis.

Organizations without hospital or patient-related data.
Facilities that do not track admissions, treatments, or billing.
Use cases requiring real-time integration with hospital management systems.
Institutions relying exclusively on paper-based records with no digital data.
Projects needing advanced AI-driven predictive analytics beyond Excel dashboards.


0.0 / 5 (0 votes)

please wait...