Originally published: 17/11/2021 14:51
Publication number: ELQ-69355-1
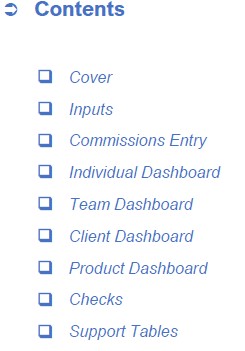
View all versions & Certificate
Publication number: ELQ-69355-1
View all versions & Certificate

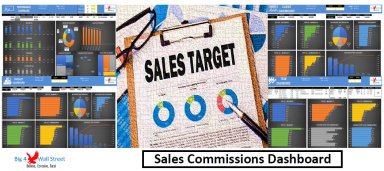
Sales Commissions Dashboard
This model will allow you to plan your commission structure and monitor the performance of your salespeople versus company targets by using several dashboards.
commissionssales commissionsexcelcommission structuredashboarddynamic dashboardfixed commissiontiered commission
Description
This model will allow you to plan your commission structure and monitor the performance of your salespeople versus company targets by using several dashboards (* make sure before purchase that your excel FILTER function is working properly).
A well-planned sales commission structure can help you attract and retain top employees. A clear commission plan will allow sales reps to understand more easily sales targets and their own total sales compensation.
A sales commission is the amount of money a salesperson earns based on the number of sales they have made. Usually but not always a commission plan is complemented with a base salary.
Several factors should be considered when planning a commission structure such as: budget allocation, commission levels, base salaries, and potential bonus rewards.
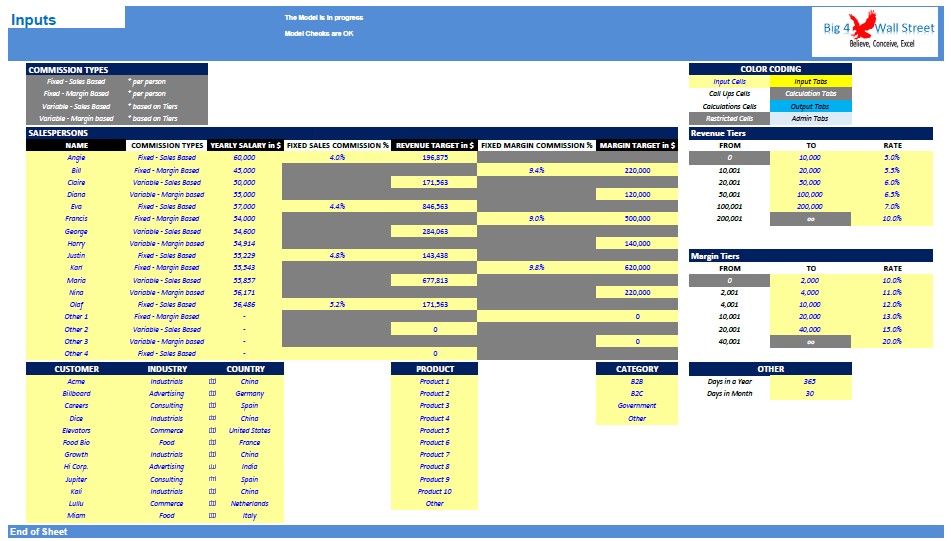
COMMISSIONS INPUTS
Common commission structures that the tool can accommodate include:
• Base Salary Plus Fixed Commission (on Sales or on Contribution Margin)
• Fixed Commission Only (on Sales or on Contribution Margin)
• Tiered Commission Plan (on Sales or on Contribution Margin)
• Base Salary plus Tiered Commission Plan (on Sales or on Contribution Margin)
In the model inputs you can set the commission types (Fixed Sales Based, Fixed Margin Based, Variable Sales Based, Variable Margin based).
After selecting for each sales rep, the commission type, you can start populating the non-gray areas such as yearly salary, and then the commission rate if you chose a fixed commission type.
In case you choose a variable commission type you will have to populate the revenue or margin tiers for the sales team. You can also set the revenue and margin target for each rep.
Other inputs include the customers details (such as name, industry, and country), product name, and product category.
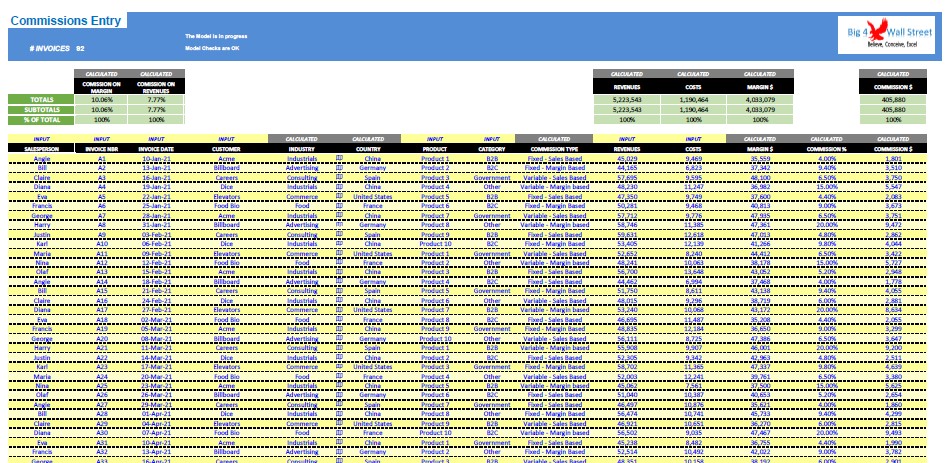
Moving on to the commission’s entry tab, the user can start populating the columns which are marked with an “INPUT” sign.
You can go to the end of the list and start typing the sales rep’s name, the invoice number, invoice date, customer name, product, category, revenues, and costs if any. The remaining columns are calculated automatically, as well as the following dashboards.
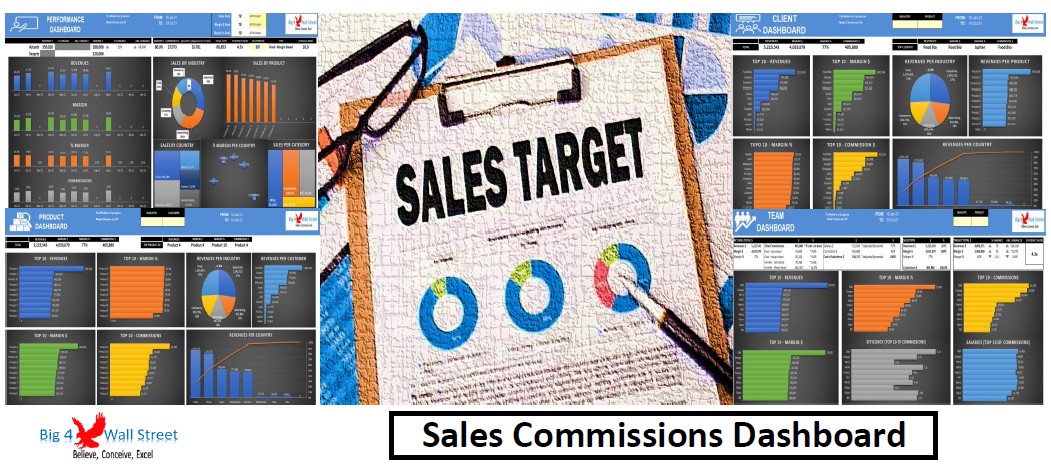
DASHBOARDS
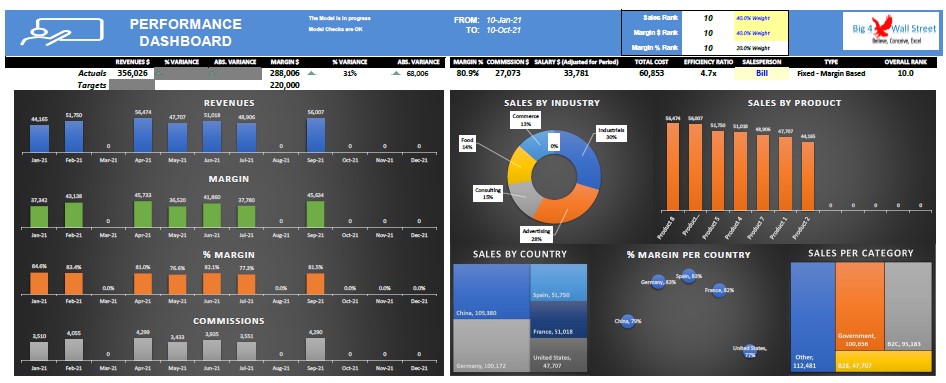
In the “Dashboard Rep” you can select the sales rep and the dashboard will be updated with his performance. You can set the weight for the Sales rank and the Margin rank, to get the overall sales rep rank. You can see the variance versus the target set on an individual rep level.
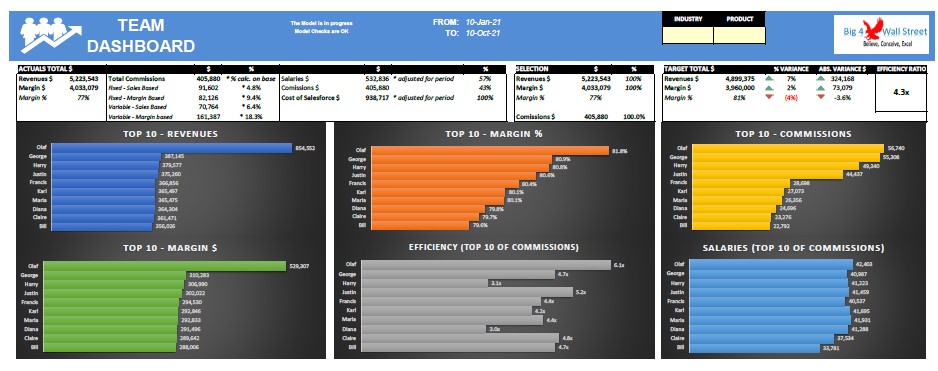
In the “Dashboard Team” the user can select the industry and / or product, and the dashboard will provide you with the ranking of the salespersons. If you leave these cells empty, the dashboard will be updated for all industries and products. Additionally, you can see the variance versus the target set on a company level.
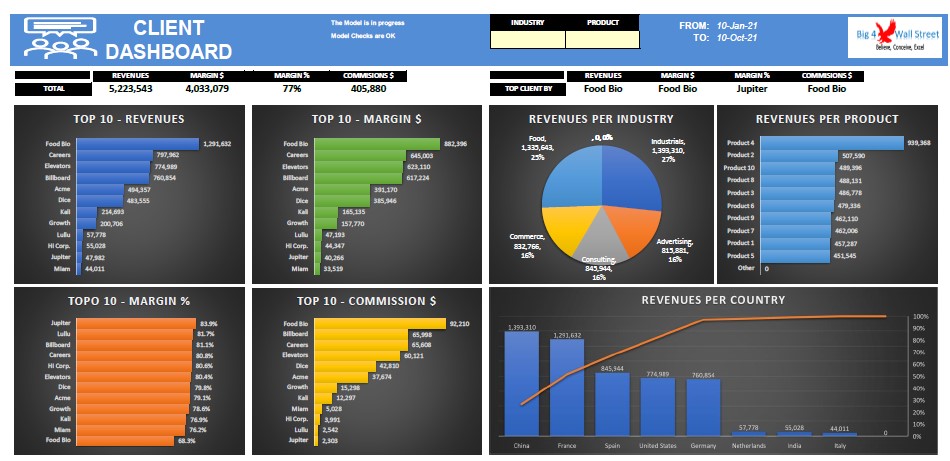
In the “Dashboard Client” the user can select the industry and / or product, and the dashboard will provide you with the ranking of the clients. If you leave these cells empty, the dashboard will be updated for all industries and products. Furthermore, you can see the aggregated levels of revenues, margins, and commissions, as well as the leading company for the selection.
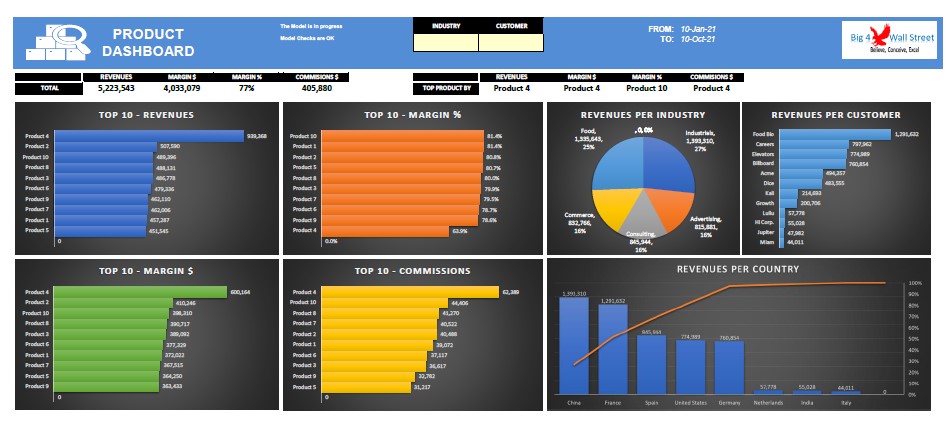
In the “Dashboard Product” the user can select the industry and / or customer, and the dashboard will provide you with the ranking of the products. If you leave these cells empty, the dashboard will be updated for all industries and customers. You can see the aggregated levels of revenues, margins, and commissions, as well as the leading company for the selection.
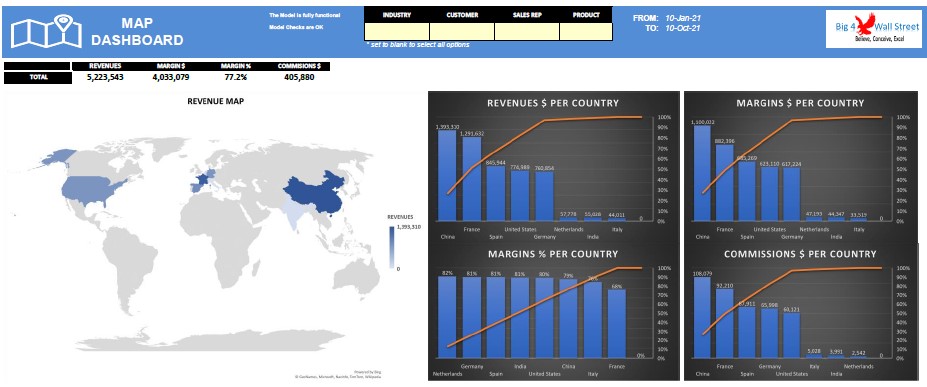
In the “Dashboard Map” the user can select the industry and or customer and or sales rep, and or product, and the dashboard will provide a map of the sales and a ranking of countries by revenues, margins, and commissions. If you leave these cells empty, the dashboard with the entire dataset.
Each dashboard is independent from each other and can be viewed as a standalone dashboard.
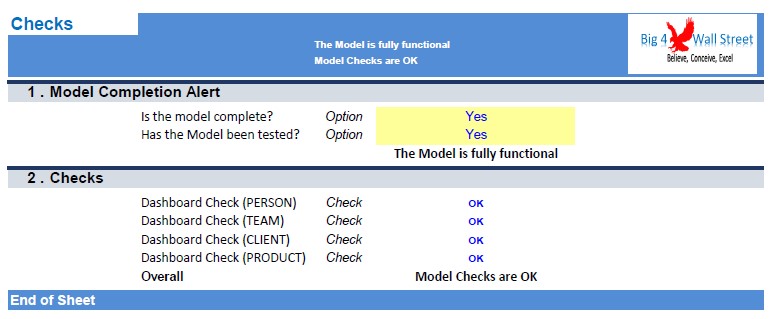
Finally, the checks tab where the most critical checks are aggregated. Whenever you see an error message in any page, you should consult this page to see where the error is coming from.
There is a description of the color coding of the model in the inputs tab. Inputs are always depicted with a yellow fill and blue letters, calculations and call up are depicted with white fill and black characters. Restricted cells are in grey.
There is also a color coding for the various tabs of the model. Yellow tabs are mostly assumptions tabs, grey tabs are calculations tabs, blue tabs are outputs tabs (that is effectively dashboards) and finally light blue tabs are admin tabs (for example: the cover page, contents, and checks).
This model will allow you to plan your commission structure and monitor the performance of your salespeople versus company targets by using several dashboards (* make sure before purchase that your excel FILTER function is working properly).
A well-planned sales commission structure can help you attract and retain top employees. A clear commission plan will allow sales reps to understand more easily sales targets and their own total sales compensation.
A sales commission is the amount of money a salesperson earns based on the number of sales they have made. Usually but not always a commission plan is complemented with a base salary.
Several factors should be considered when planning a commission structure such as: budget allocation, commission levels, base salaries, and potential bonus rewards.
COMMISSIONS INPUTS
Common commission structures that the tool can accommodate include:
• Base Salary Plus Fixed Commission (on Sales or on Contribution Margin)
• Fixed Commission Only (on Sales or on Contribution Margin)
• Tiered Commission Plan (on Sales or on Contribution Margin)
• Base Salary plus Tiered Commission Plan (on Sales or on Contribution Margin)
In the model inputs you can set the commission types (Fixed Sales Based, Fixed Margin Based, Variable Sales Based, Variable Margin based).
After selecting for each sales rep, the commission type, you can start populating the non-gray areas such as yearly salary, and then the commission rate if you chose a fixed commission type.
In case you choose a variable commission type you will have to populate the revenue or margin tiers for the sales team. You can also set the revenue and margin target for each rep.
Other inputs include the customers details (such as name, industry, and country), product name, and product category.
Moving on to the commission’s entry tab, the user can start populating the columns which are marked with an “INPUT” sign.
You can go to the end of the list and start typing the sales rep’s name, the invoice number, invoice date, customer name, product, category, revenues, and costs if any. The remaining columns are calculated automatically, as well as the following dashboards.
DASHBOARDS
In the “Dashboard Rep” you can select the sales rep and the dashboard will be updated with his performance. You can set the weight for the Sales rank and the Margin rank, to get the overall sales rep rank. You can see the variance versus the target set on an individual rep level.
In the “Dashboard Team” the user can select the industry and / or product, and the dashboard will provide you with the ranking of the salespersons. If you leave these cells empty, the dashboard will be updated for all industries and products. Additionally, you can see the variance versus the target set on a company level.
In the “Dashboard Client” the user can select the industry and / or product, and the dashboard will provide you with the ranking of the clients. If you leave these cells empty, the dashboard will be updated for all industries and products. Furthermore, you can see the aggregated levels of revenues, margins, and commissions, as well as the leading company for the selection.
In the “Dashboard Product” the user can select the industry and / or customer, and the dashboard will provide you with the ranking of the products. If you leave these cells empty, the dashboard will be updated for all industries and customers. You can see the aggregated levels of revenues, margins, and commissions, as well as the leading company for the selection.
In the “Dashboard Map” the user can select the industry and or customer and or sales rep, and or product, and the dashboard will provide a map of the sales and a ranking of countries by revenues, margins, and commissions. If you leave these cells empty, the dashboard with the entire dataset.
Each dashboard is independent from each other and can be viewed as a standalone dashboard.
Finally, the checks tab where the most critical checks are aggregated. Whenever you see an error message in any page, you should consult this page to see where the error is coming from.
There is a description of the color coding of the model in the inputs tab. Inputs are always depicted with a yellow fill and blue letters, calculations and call up are depicted with white fill and black characters. Restricted cells are in grey.
There is also a color coding for the various tabs of the model. Yellow tabs are mostly assumptions tabs, grey tabs are calculations tabs, blue tabs are outputs tabs (that is effectively dashboards) and finally light blue tabs are admin tabs (for example: the cover page, contents, and checks).
This Best Practice includes
1 Excel and 2 PDF
Further information
This model will allow you to plan your commission structure and monitor the performance of your salespeople versus company targets by using several dashboards
* make sure before purchase that your excel FILTER function is working properly
