Originally published: 16/08/2024 12:02
Last version published: 24/12/2024 10:11
Publication number: ELQ-40344-4
View all versions & Certificate
Last version published: 24/12/2024 10:11
Publication number: ELQ-40344-4
View all versions & Certificate

Three-Statement Financial Model with Financial Ratios
Financial ratios are crucial tools for evaluating a company’s financial health and performance.
financial modelthree statement modelfinancial ratioprojectioncurrent ratioliquidity ratioprofitability ratio
Description
Three Statement Financial Model Template and Financial Ratios
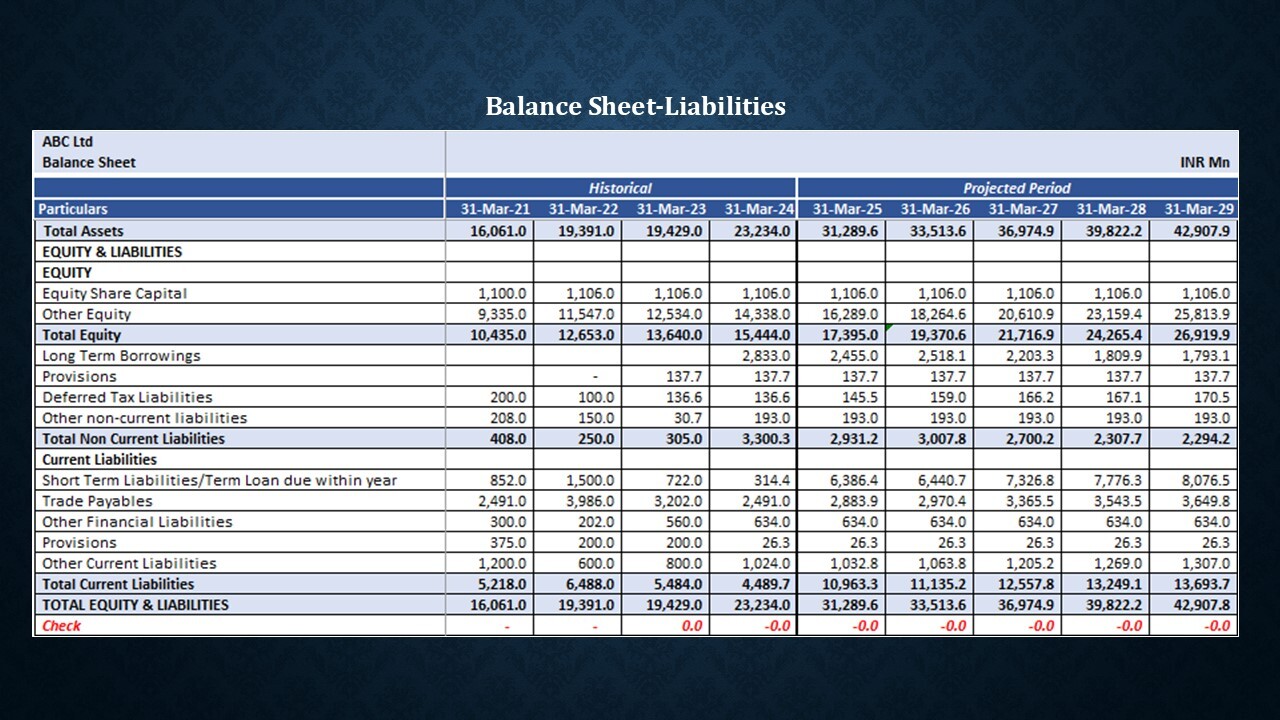
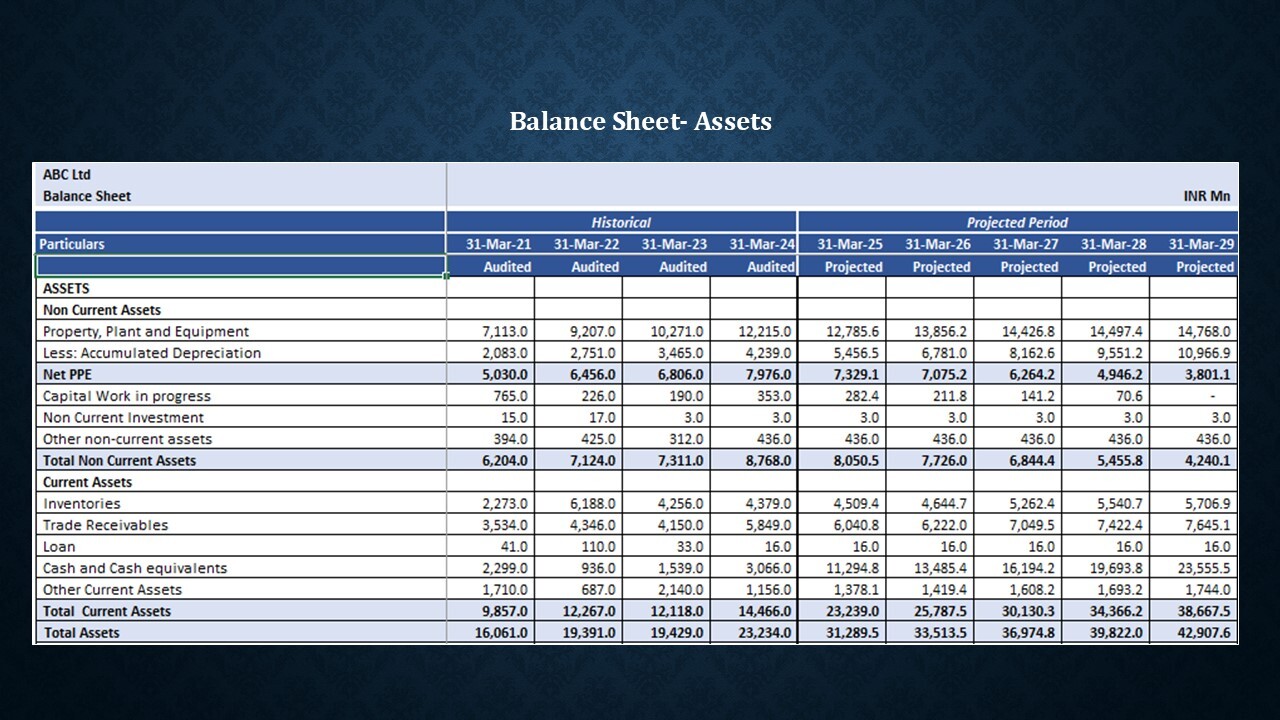
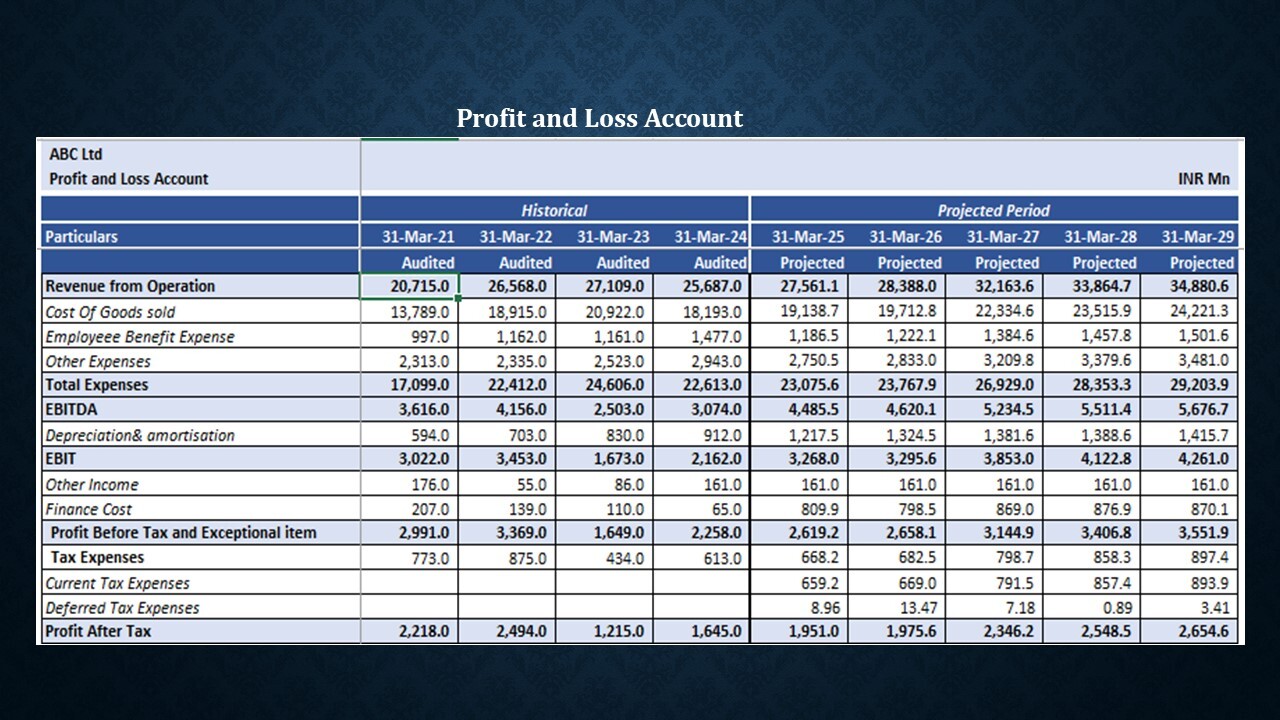
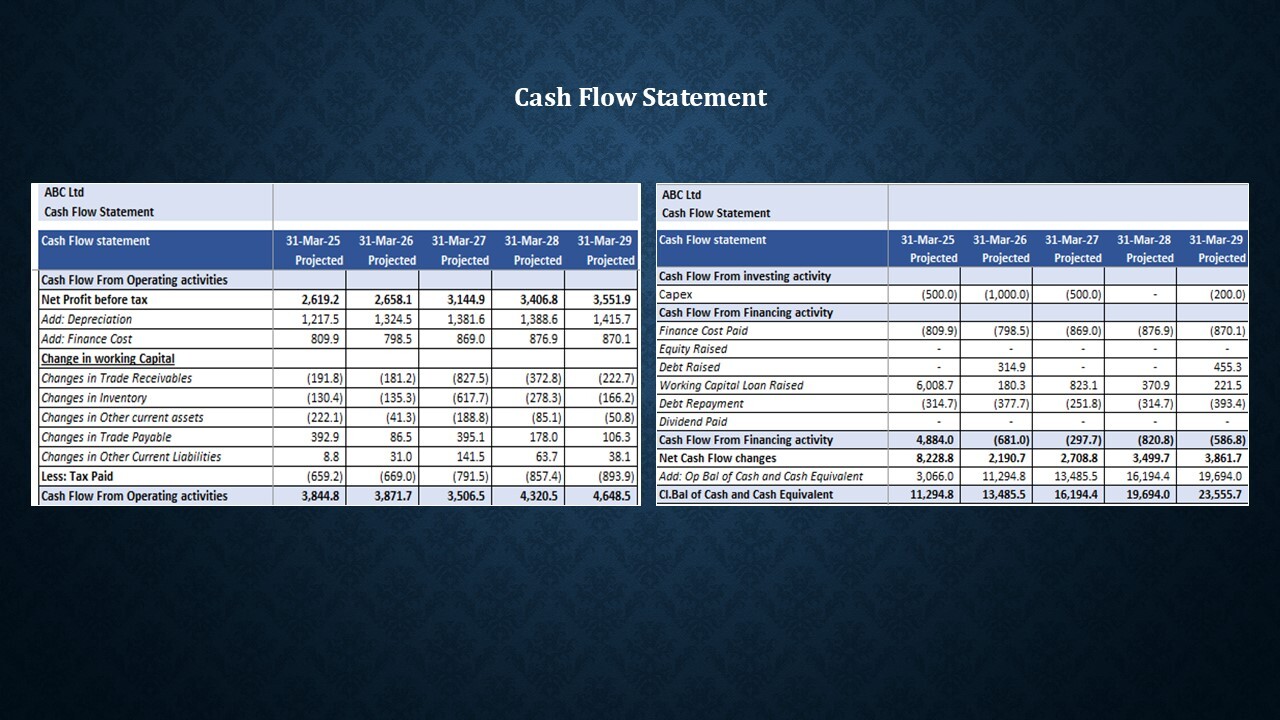
A Three Statement Financial Model Template is a robust tool designed to forecast a company's financial performance by integrating and projecting three fundamental financial statements: the Income Statement, the Balance Sheet, and the Cash Flow Statement. This model serves as a comprehensive framework for financial planning, analysis, and decision-making, providing a clear and consolidated view of a company's financial health and future performance.This file contains a comprehensive three-statement financial model, incorporating the Balance Sheet, Profit and Loss Account, Cash Flow Statement, and additional supporting schedules, outlined as follows:
Three Statement Financial Model Template and Financial Ratios
A Three Statement Financial Model Template is a robust tool designed to forecast a company's financial performance by integrating and projecting three fundamental financial statements: the Income Statement, the Balance Sheet, and the Cash Flow Statement. This model serves as a comprehensive framework for financial planning, analysis, and decision-making, providing a clear and consolidated view of a company's financial health and future performance.This file contains a comprehensive three-statement financial model, incorporating the Balance Sheet, Profit and Loss Account, Cash Flow Statement, and additional supporting schedules, outlined as follows:
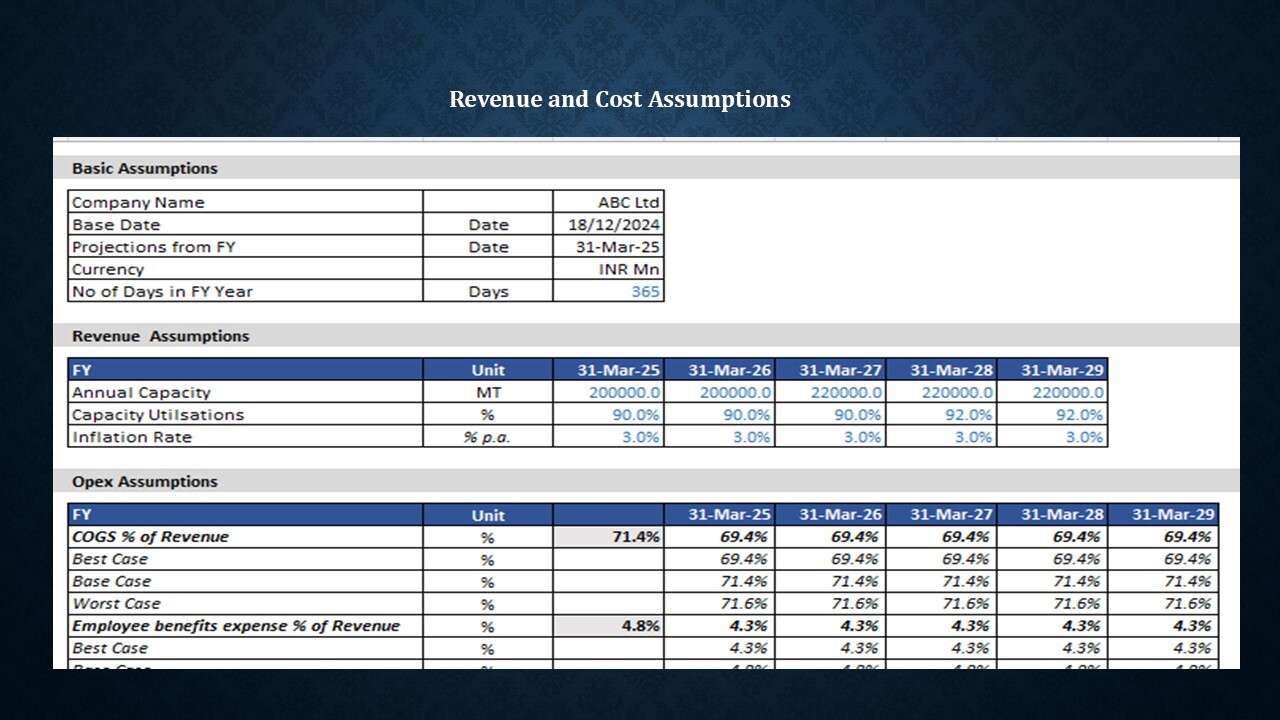
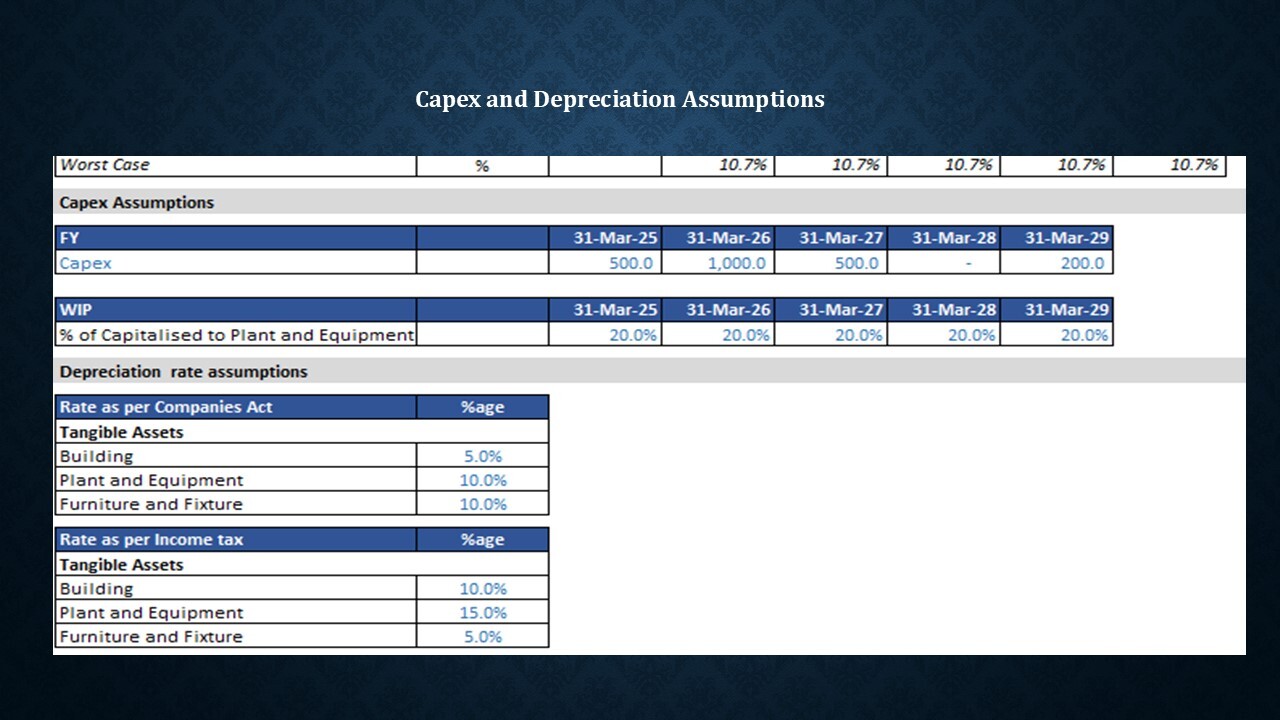
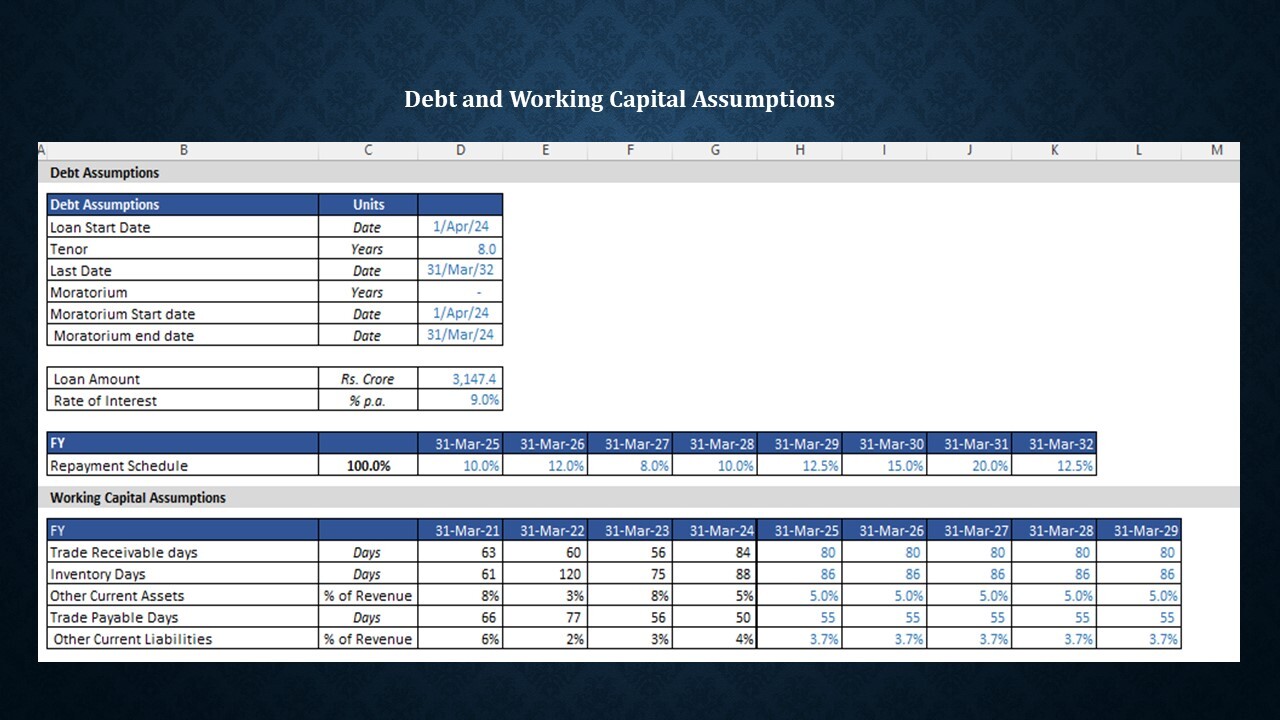
- Input (Assumption) Tab: This section consolidates key assumptions related to revenue projections, operating costs, capital expenditures (Capex), depreciation rates, debt structure, working capital, and tax rate assumptions.
- Balance Sheet and Profit and Loss Account: The Balance Sheet and Profit and Loss Account are constructed based on the historical data from the past four years, along with other assumptions derived from the supporting schedules. A five-year financial projection is provided, supported by both vertical and horizontal analysis for deeper insight.
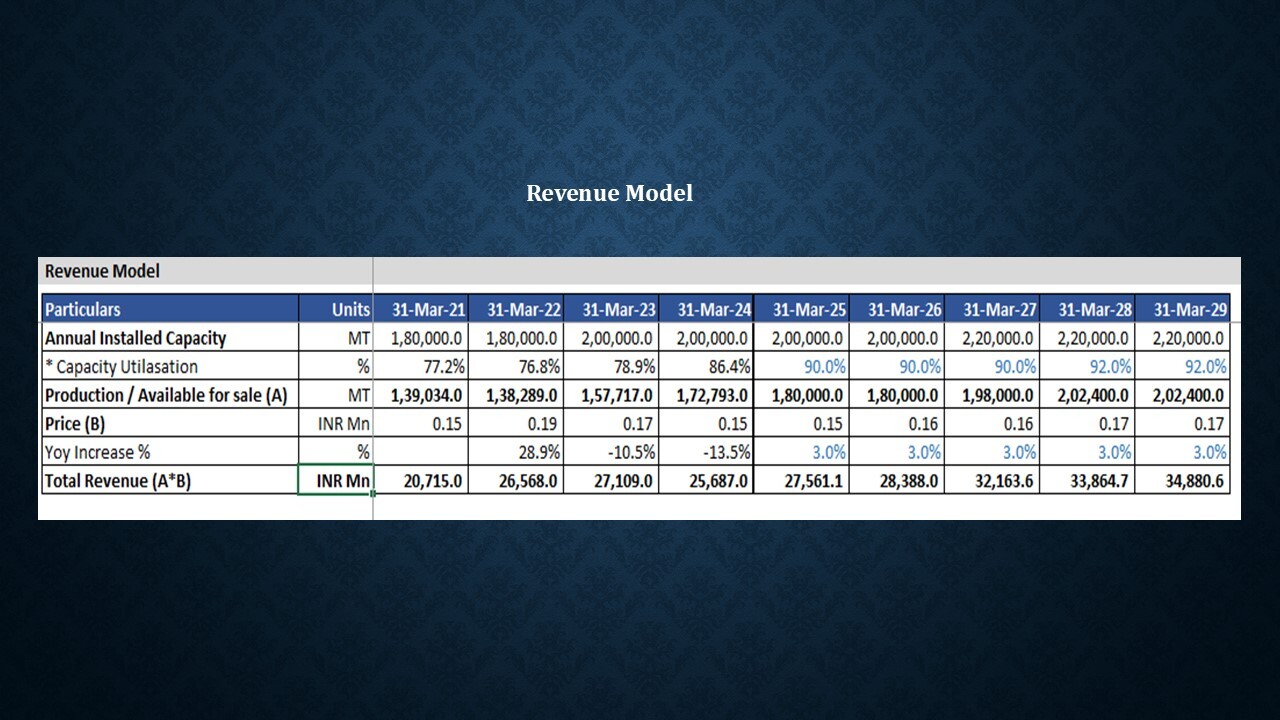
- Revenue Model Tab: This tab includes data on annual capacity, utilization, and pricing, from which revenue is projected. The revenue projections are directly linked to the Profit and Loss Account.
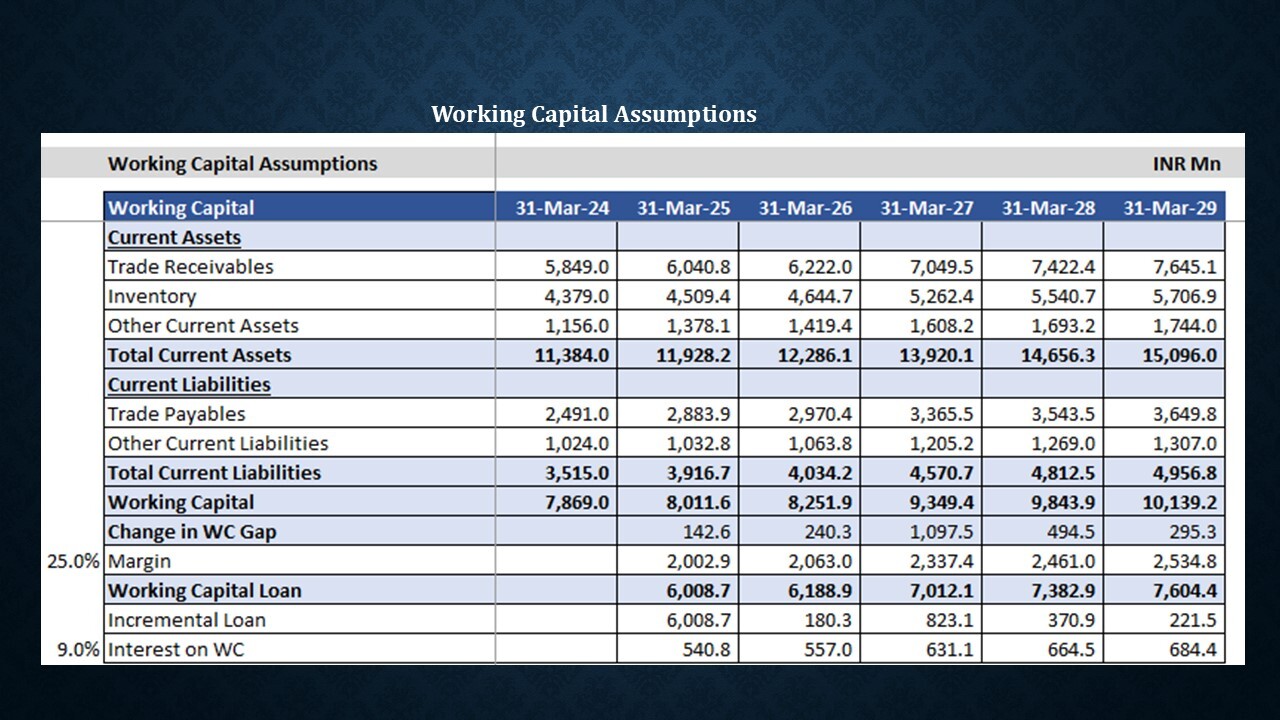
- Working Capital Schedule: This schedule outlines the calculation of current assets such as trade receivables, inventory, and other current assets, based on days outstanding. It also forecasts current liabilities, including trade payables and other liabilities. Additionally, projections for working capital loans are included.
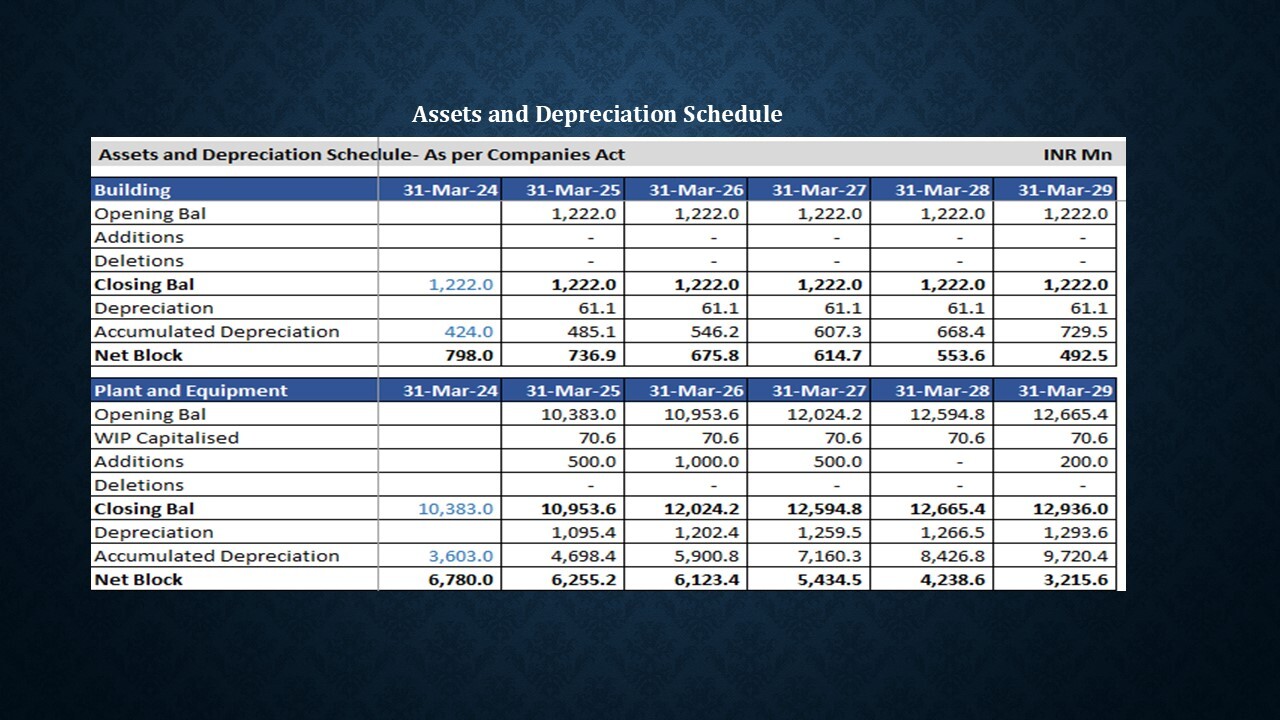
- Asset Schedules: Individual asset schedules are prepared and consolidated into the total Property, Plant, and Equipment (PPE). The PPE schedule is split into two parts: one for PPE and depreciation as per the Companies Act, and another for tax-related calculations in accordance with applicable tax laws.
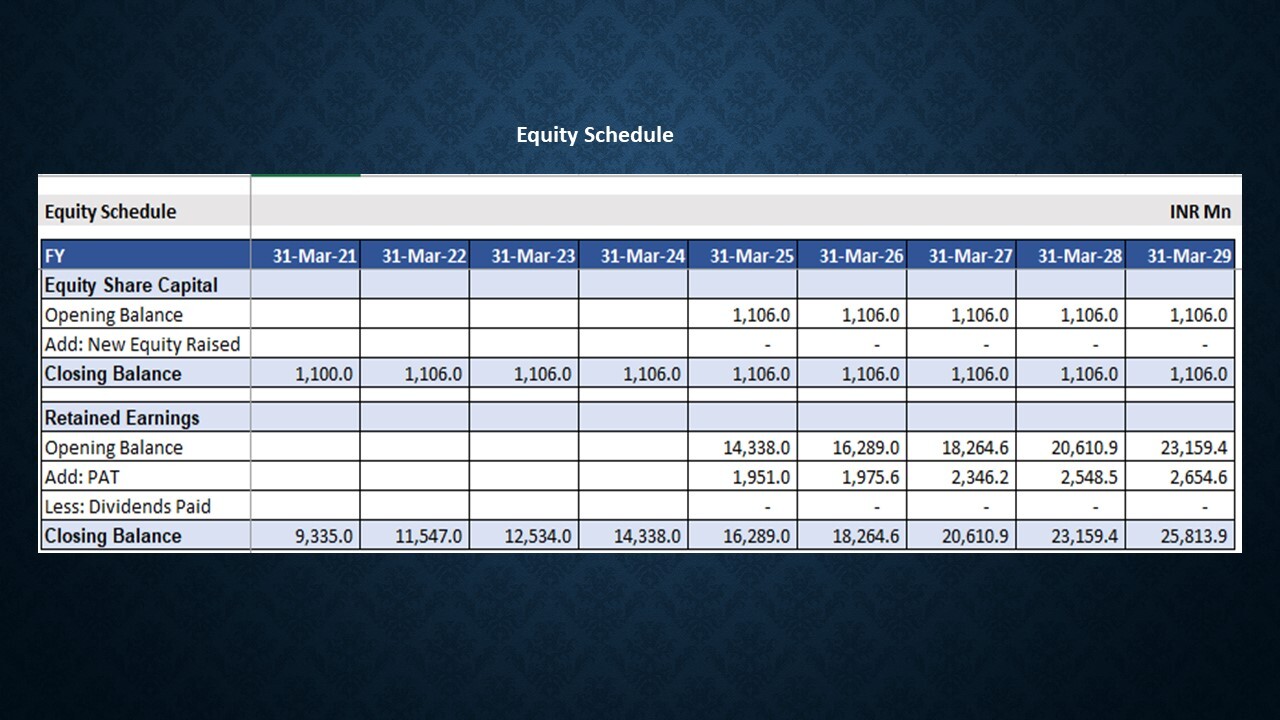
- Equity Schedule: This schedule reflects the breakdown of share capital, retained earnings, and other equity components. Profit after tax is linked to retained earnings/other equity, with the corresponding impact reflected in the Balance Sheet.
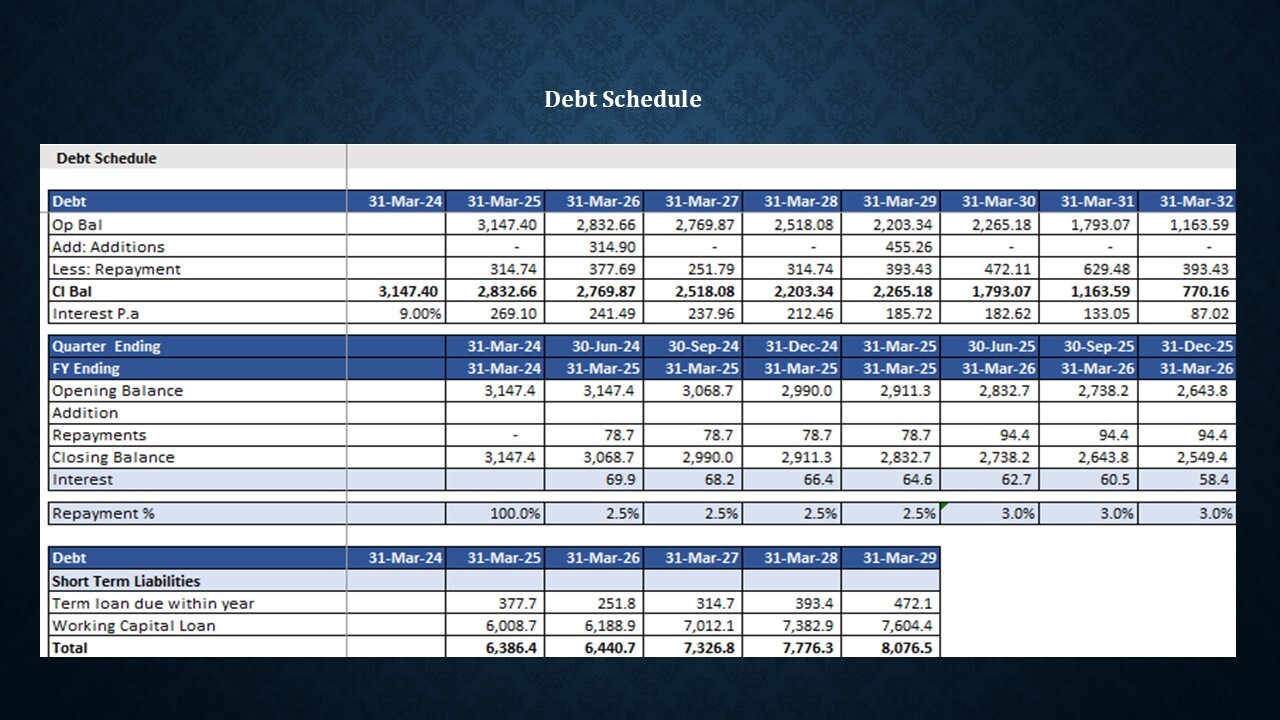
- Debt Schedule: The debt schedule captures loan additions, repayments, and calculates quarterly loan repayment schedules, which are subsequently reflected in the annual repayment tab.
- Tax Calculation: Taxes are calculated on taxable income, adjusted for depreciation and various factors such as carried-forward business losses, unabsorbed depreciation.
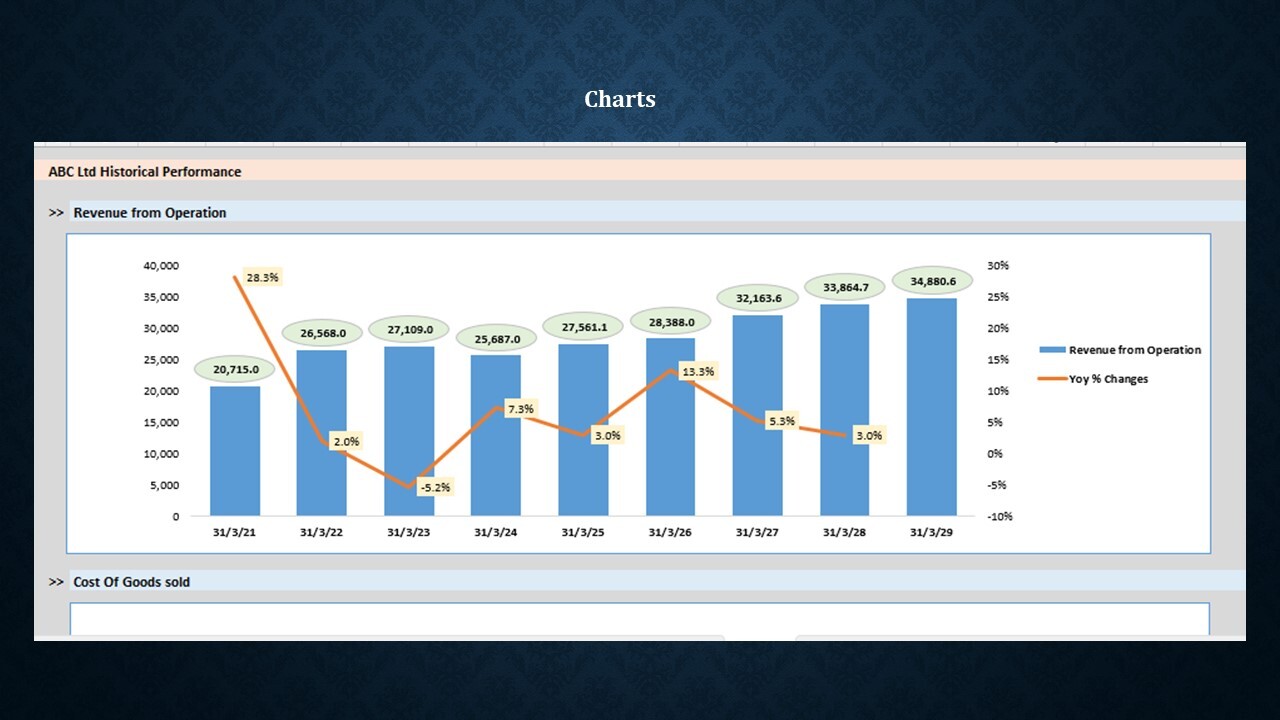
- Charts:Visual representations are provided for key metrics, including Revenue, COGS,EBITDA, EBIT, PAT, and Total Debt, along with their respective marginpercentages.
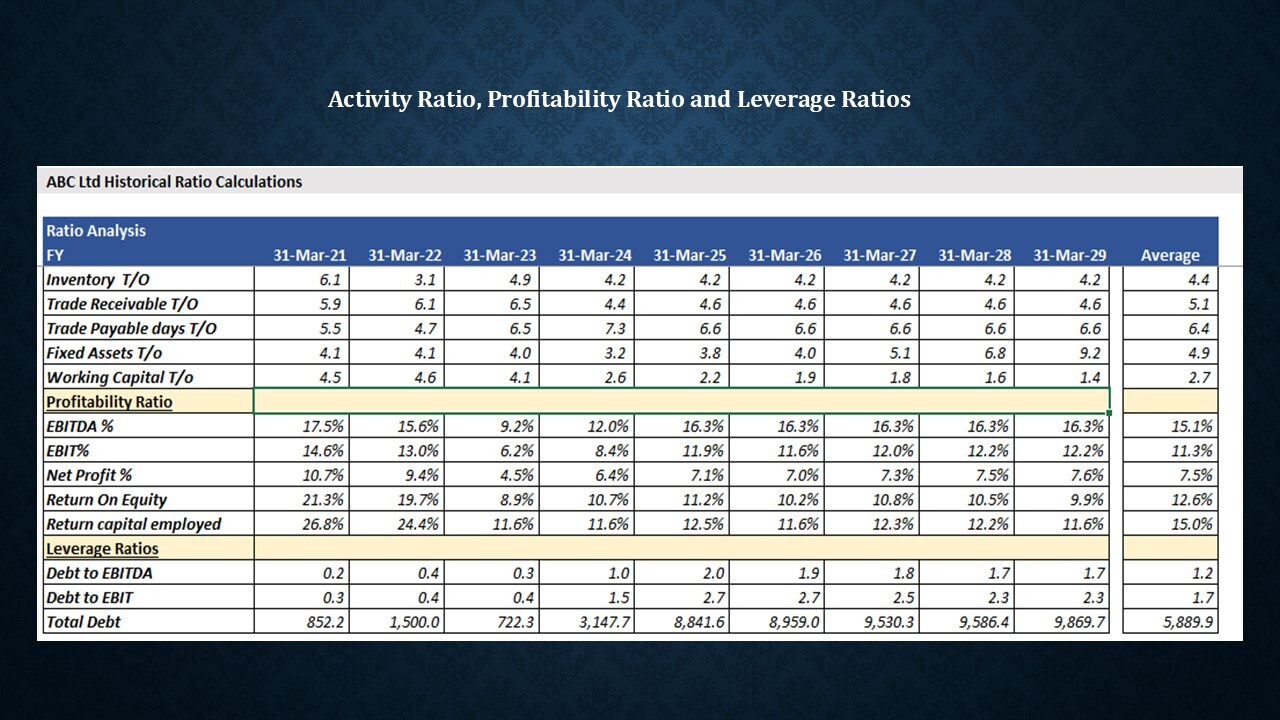
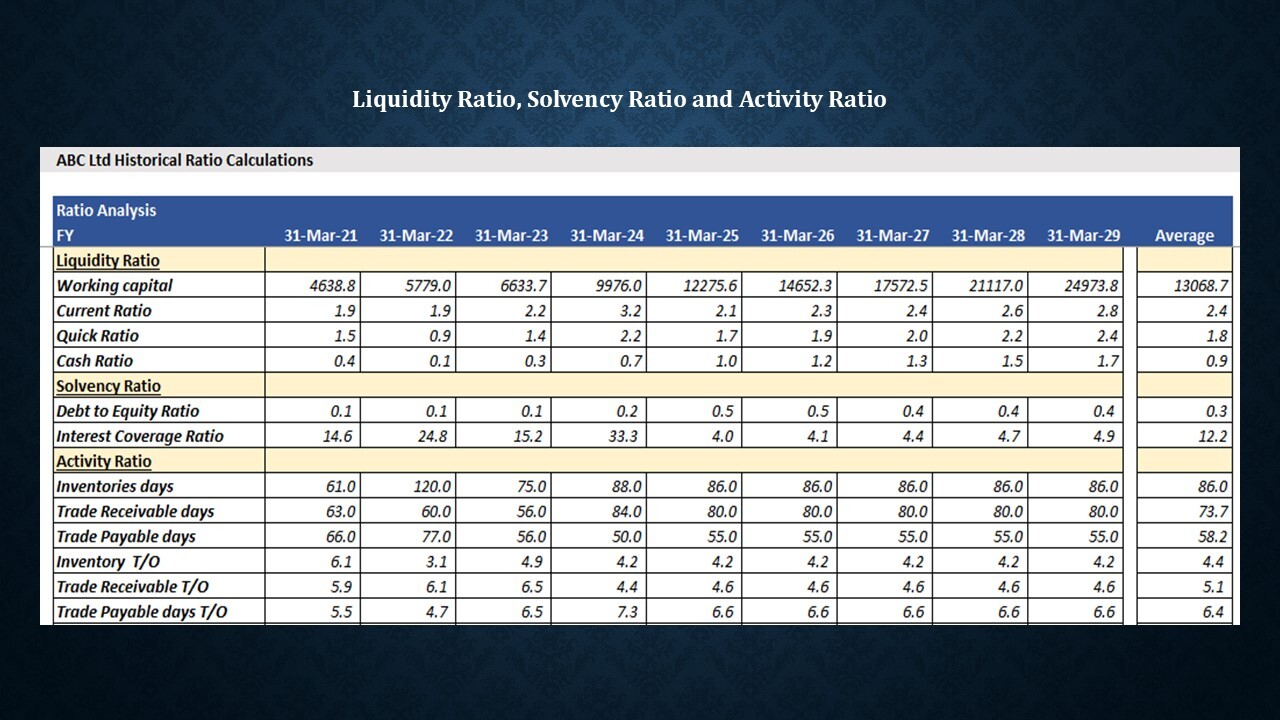
- Financial Ratios:Financial ratios are analytical tools derived from the financial statements that provide insights into a company's performance, efficiency, profitability, and financial stability. Key financial ratios include:
- Current Ratio: Measures a company’s ability to cover short-term liabilities with short-term assets. Formula: Current Assets / Current Liabilities.
- Quick Ratio (Acid-Test Ratio): Provides a stricter measure of liquidity by excluding inventory from current assets. Formula: (Current Assets - Inventory) / Current Liabilities.
- Gross Margin: Indicates the percentage of revenue remaining after COGS, reflecting operational efficiency. Formula: (Revenue - COGS) / Revenue.
- Operating Margin: Measures the percentage of revenue left after deducting operating expenses. Formula: Operating Income / Revenue.
- Net Profit Margin: Shows the percentage of revenue that translates into net income after all expenses. Formula: Net Income / Revenue.
- Inventory Turnover: Indicates how often inventory is sold and replaced over a period. Formula: COGS / Average Inventory.
- Accounts Receivable Turnover: Measures how efficiently a company collects revenue from its receivables. Formula: Revenue / Average Accounts Receivable.
- Debt-to-Equity Ratio: Assesses the proportion of debt used relative to equity. Formula: Total Debt / Total Equity.
- Interest Coverage Ratio: Measures a company's ability to meet interest payments on its debt. Formula: EBIT / Interest Expense.
This Best Practice includes
1 Excel file
