
Originally published: 24/04/2024 08:49
Publication number: ELQ-28357-1
View all versions & Certificate
Publication number: ELQ-28357-1
View all versions & Certificate

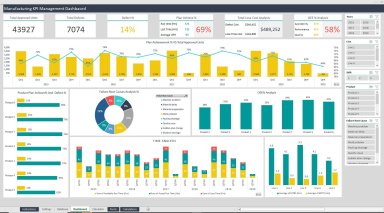
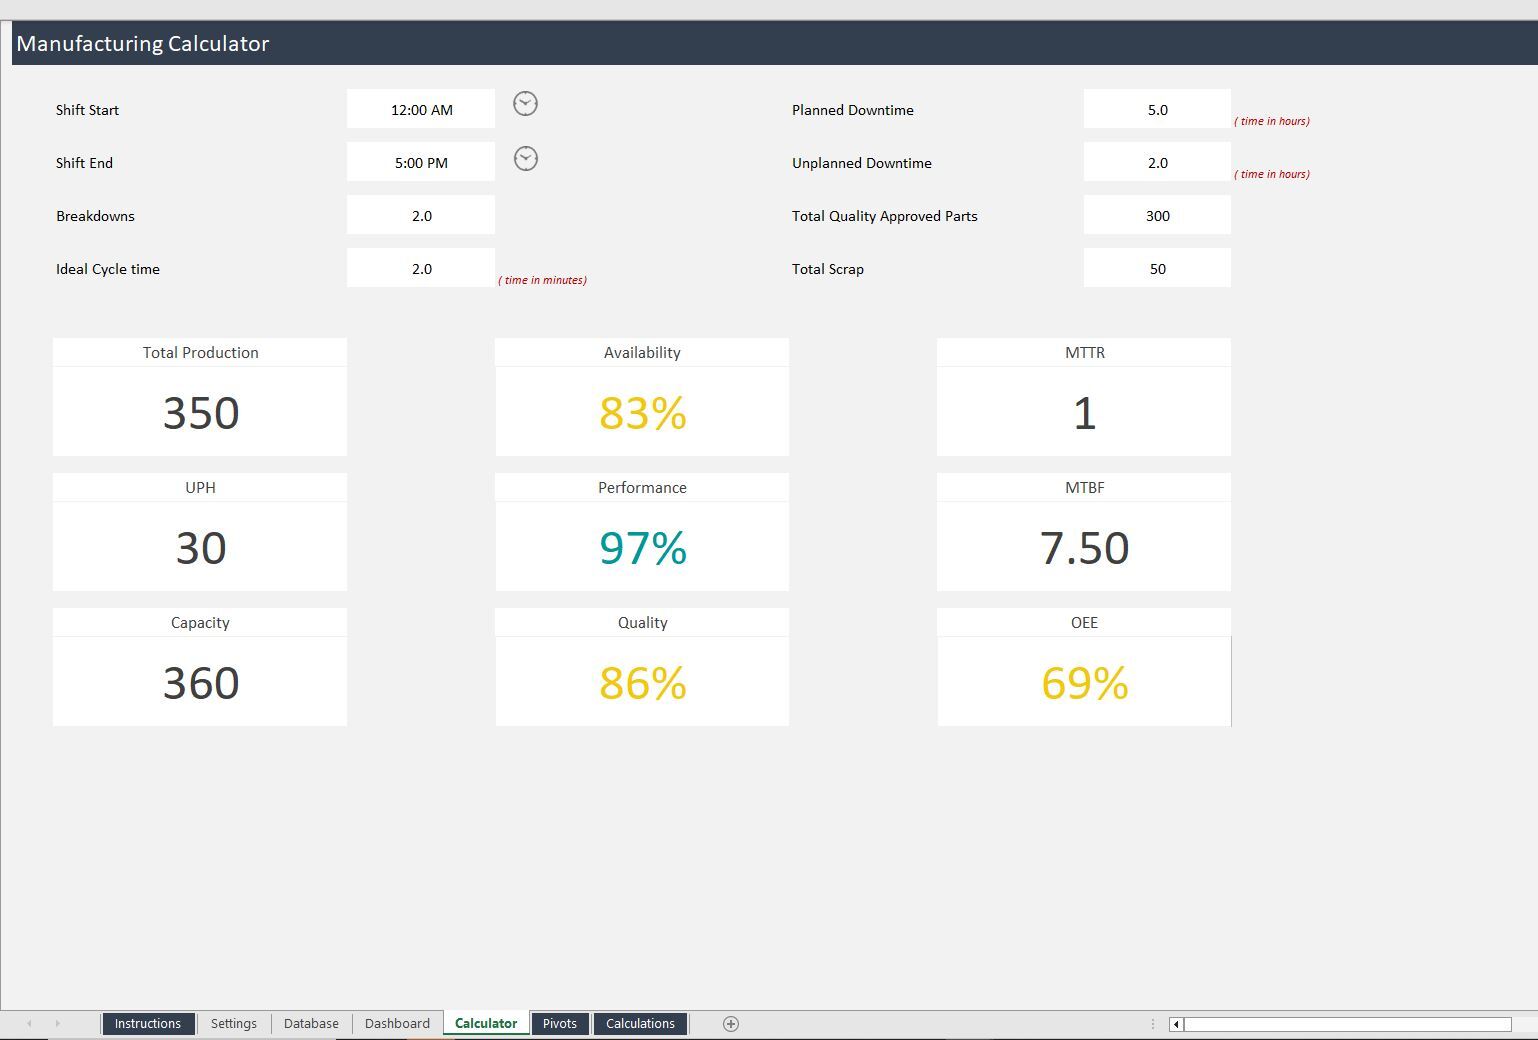
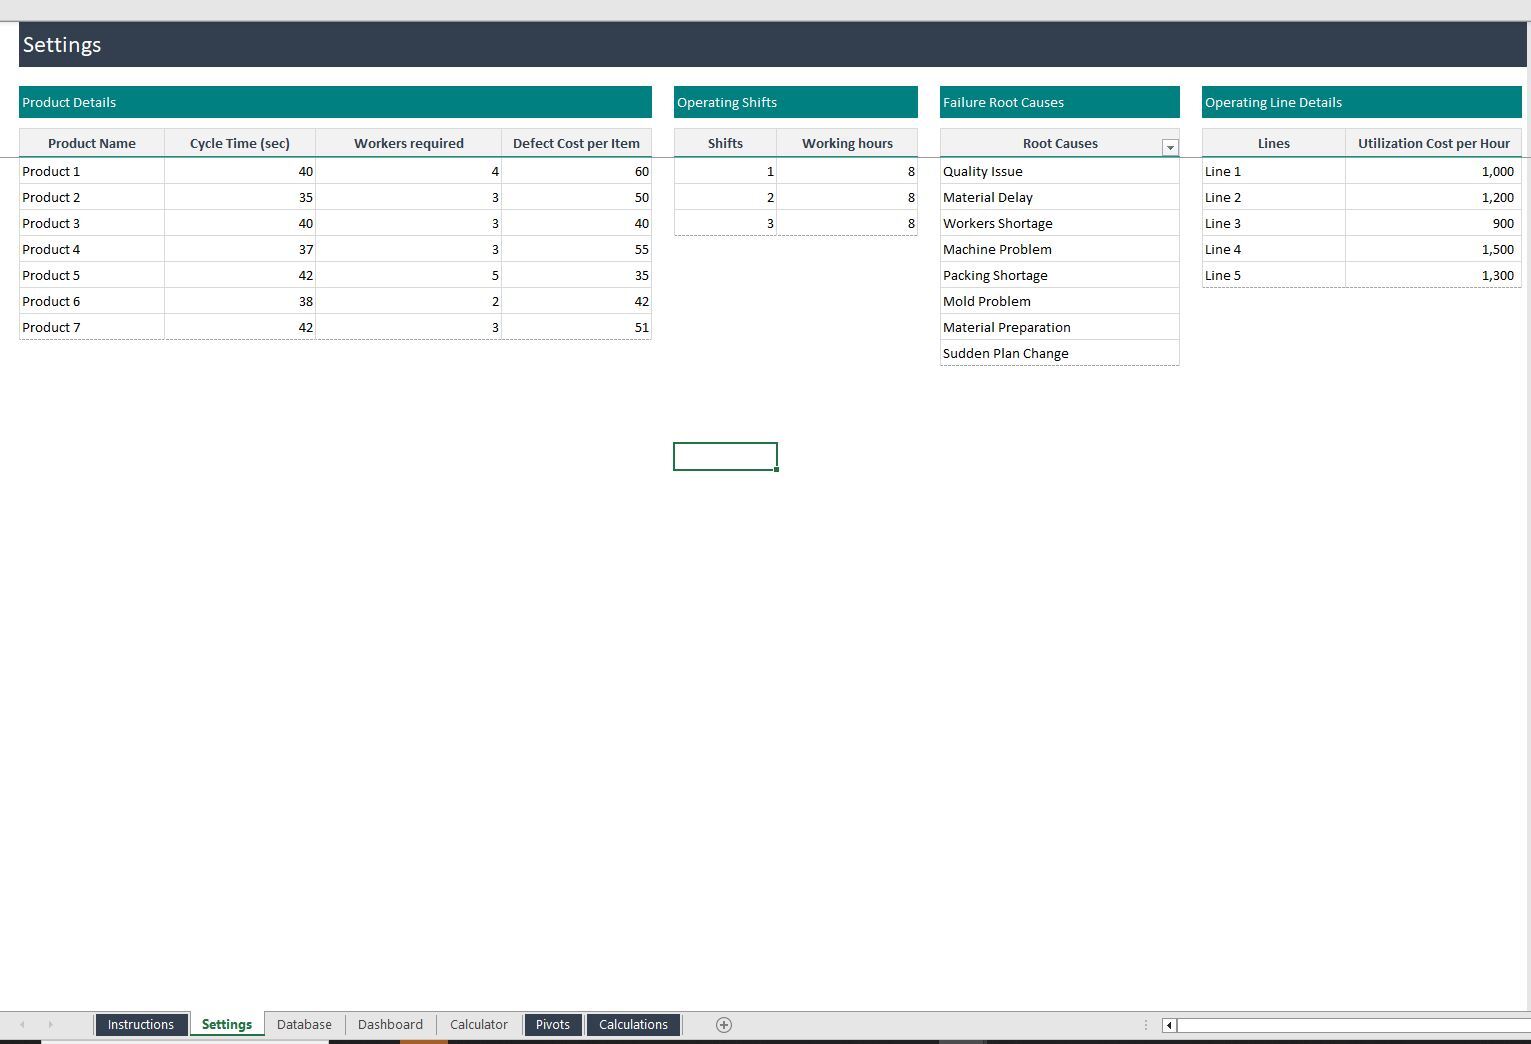
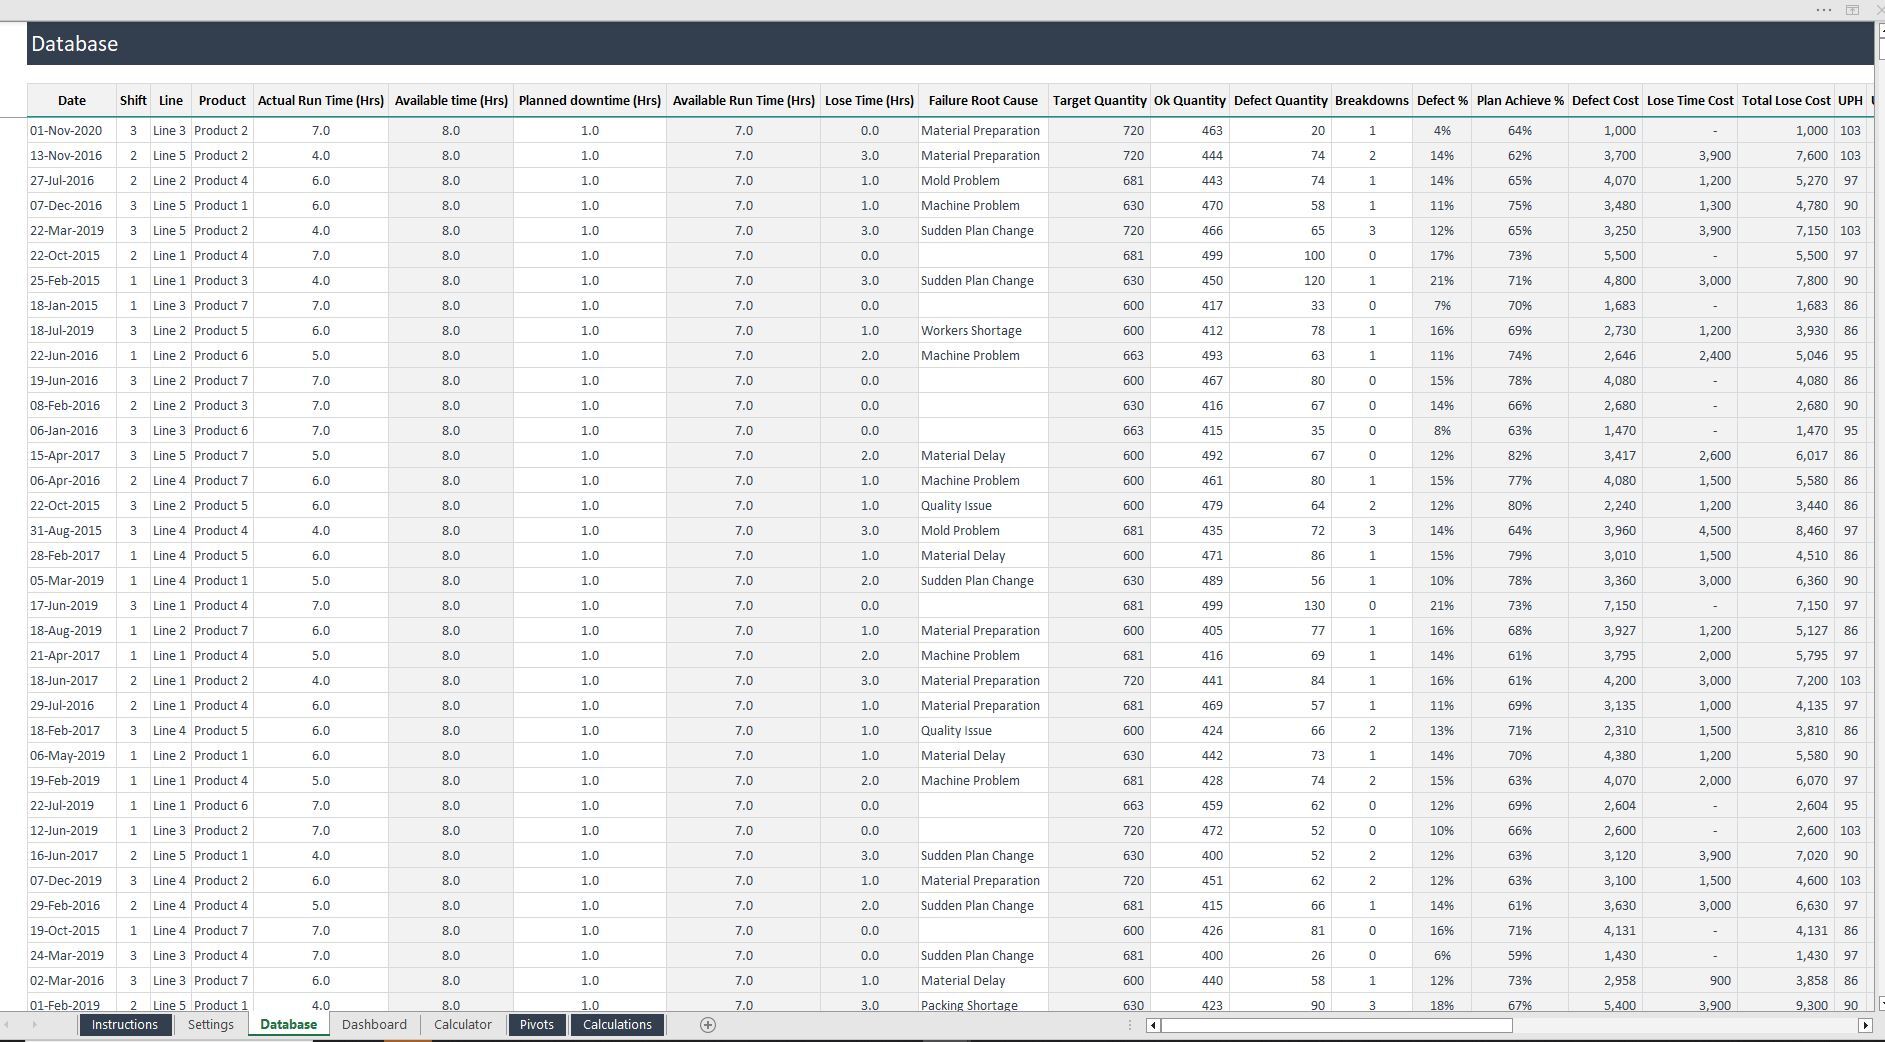
Manufacturing KPI Management Excel Dashboard
A manufacturing key performance indicator (KPI) is a clearly defined metric used to track, analyze, and improve production processes.
Our online platform provides a wide range of engaging and useful templates that cater to various needs.Follow 86
