

Originally published: 12/03/2024 08:43
Last version published: 17/04/2025 15:32
Publication number: ELQ-95464-2
View all versions & Certificate
Last version published: 17/04/2025 15:32
Publication number: ELQ-95464-2
View all versions & Certificate

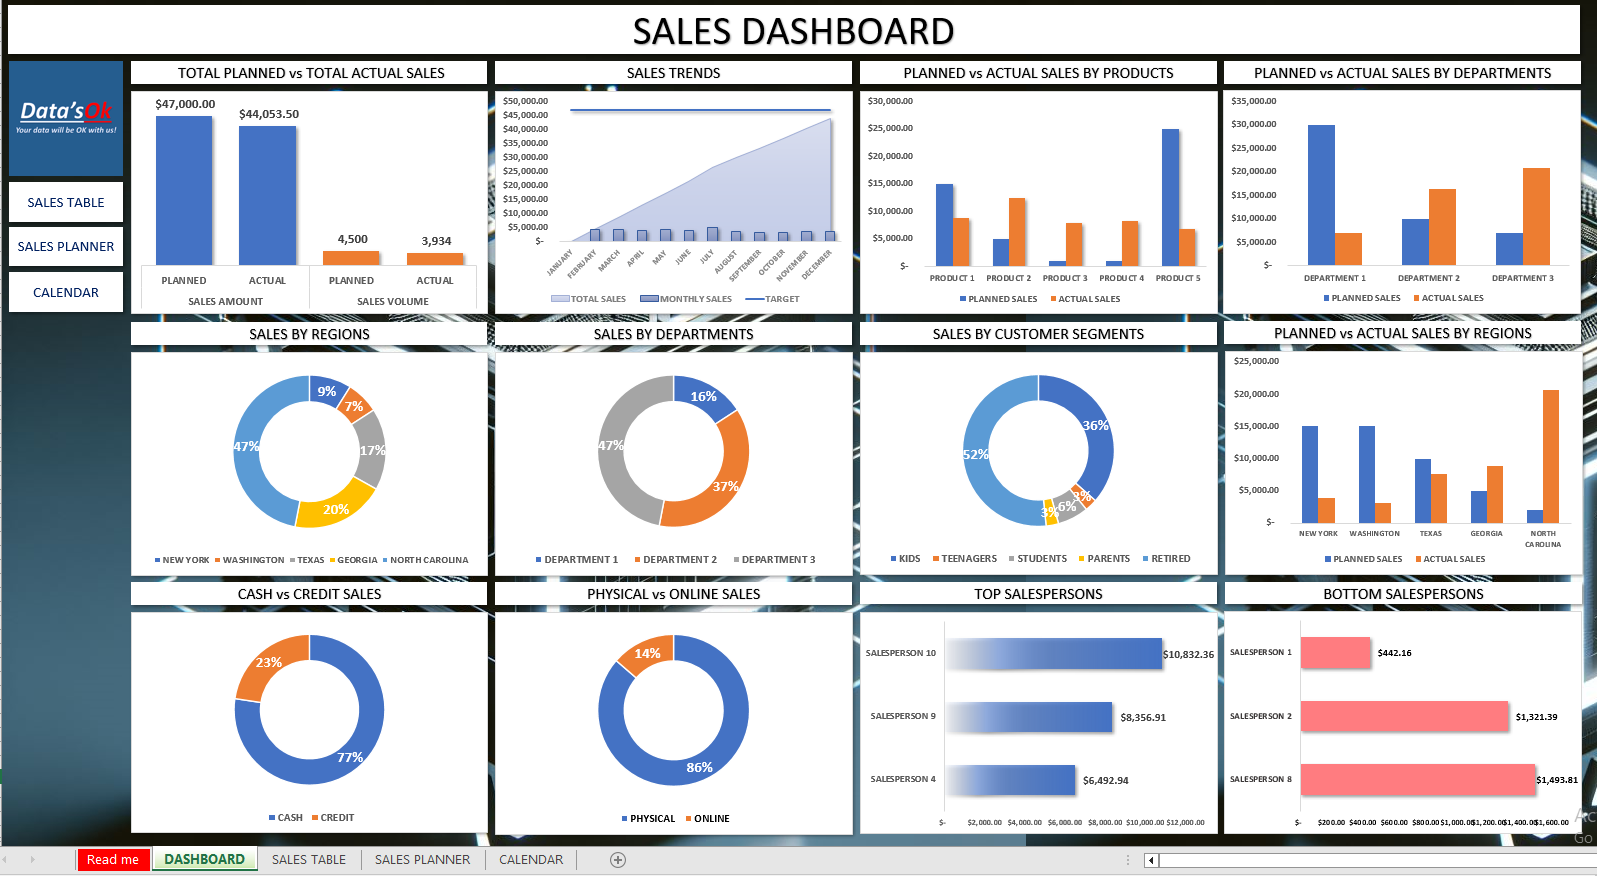
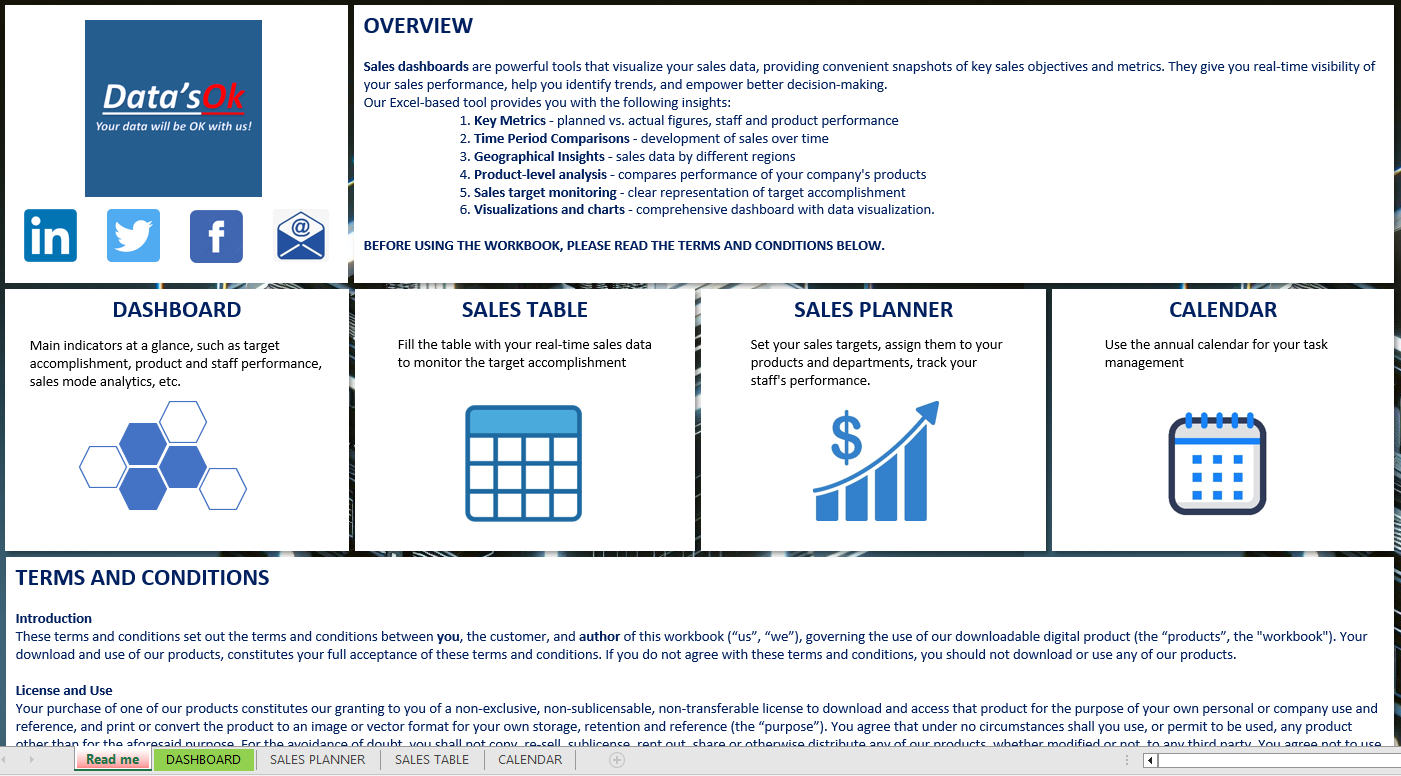
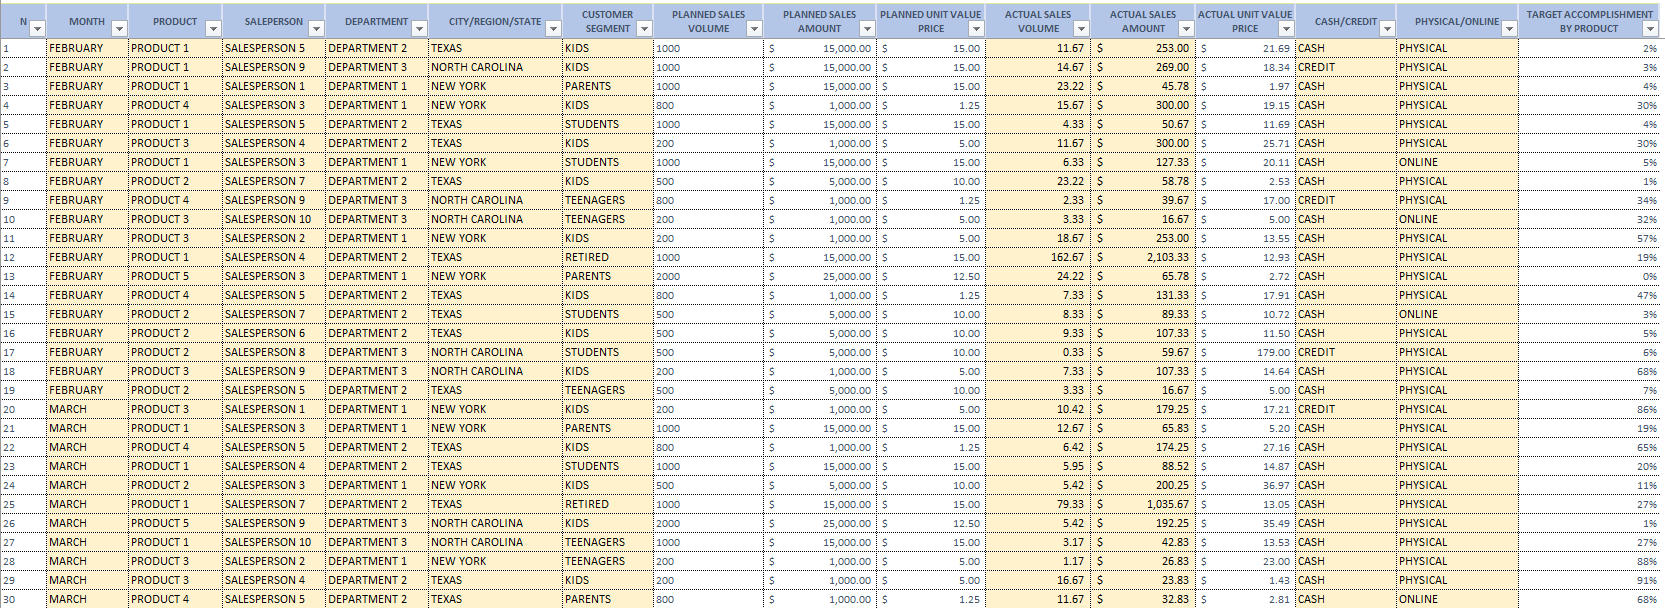
Data'sOk Sales Dashboard
Sales dashboards are powerful tools that visualise your sales data, providing convenient snapshots of key sales objectives and metrics.
