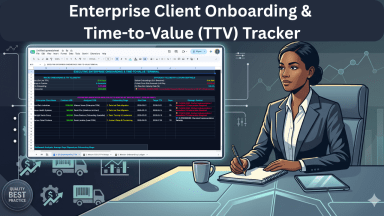
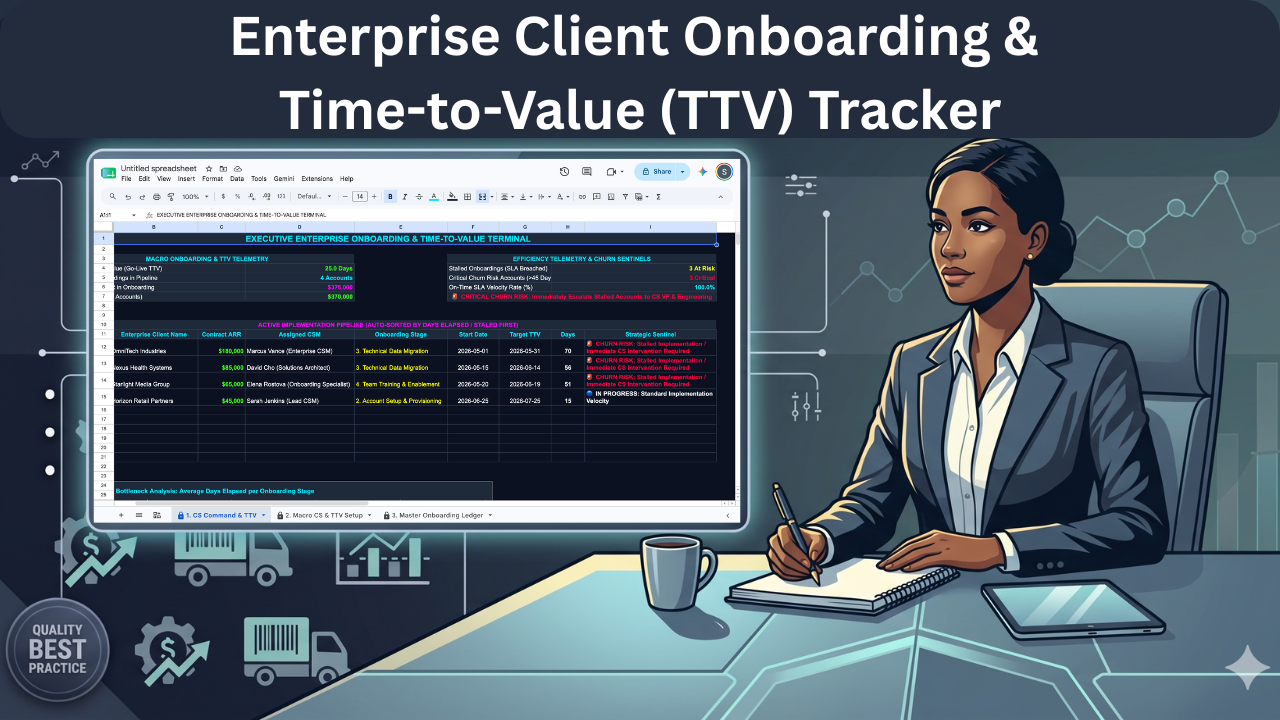
Enterprise Client Onboarding & Time-to-Value (TTV) Tracker — CS Implementation Dashboard
Originally published: 13/07/2026 20:31
Publication number: ELQ-59671-1
View all versions & Certificate
certified

Enterprise Client Onboarding & Time-to-Value (TTV) Tracker — CS Implementation Dashboard

Reduce customer churn and optimize Time-to-Value (TTV) with a dark-mode implementation ledger that isolates client onboarding bottlenecks in real time.

Description

In enterprise B2B software, the post-sale handoff is a notoriously high-risk operational checkpoint. Sales teams celebrate closing a major, high-dollar contract, but if Customer Success (CS) and implementation teams take months to provision accounts, migrate legacy data, and get users trained, executive frustration spikes. Long onboarding cycles destroy customer sentiment and represent the single greatest leading indicator of first-year churn. Yet, leadership usually has zero mathematical visibility into why deployments are stalling—whether it’s client-side legal delays, custom data migration bottlenecks, or slow user onboarding.


To solve this, scaling SaaS brands routinely spend $5,000 to $15,000+ annually on specialized client onboarding platforms or try to build complex, over-customized Jira ticketing workflows that customer success managers find tedious to update.


The Enterprise Client Onboarding & Time-to-Value (TTV) Tracker completely replaces that software overhead. Built natively and exclusively for Google Sheets, it delivers an institutional-grade implementation tracking engine. Wrapped in a professional, cybernetic dark-mode interface with high-contrast neon accents, it translates chaotic post-sale deployments into an executive CS command center:


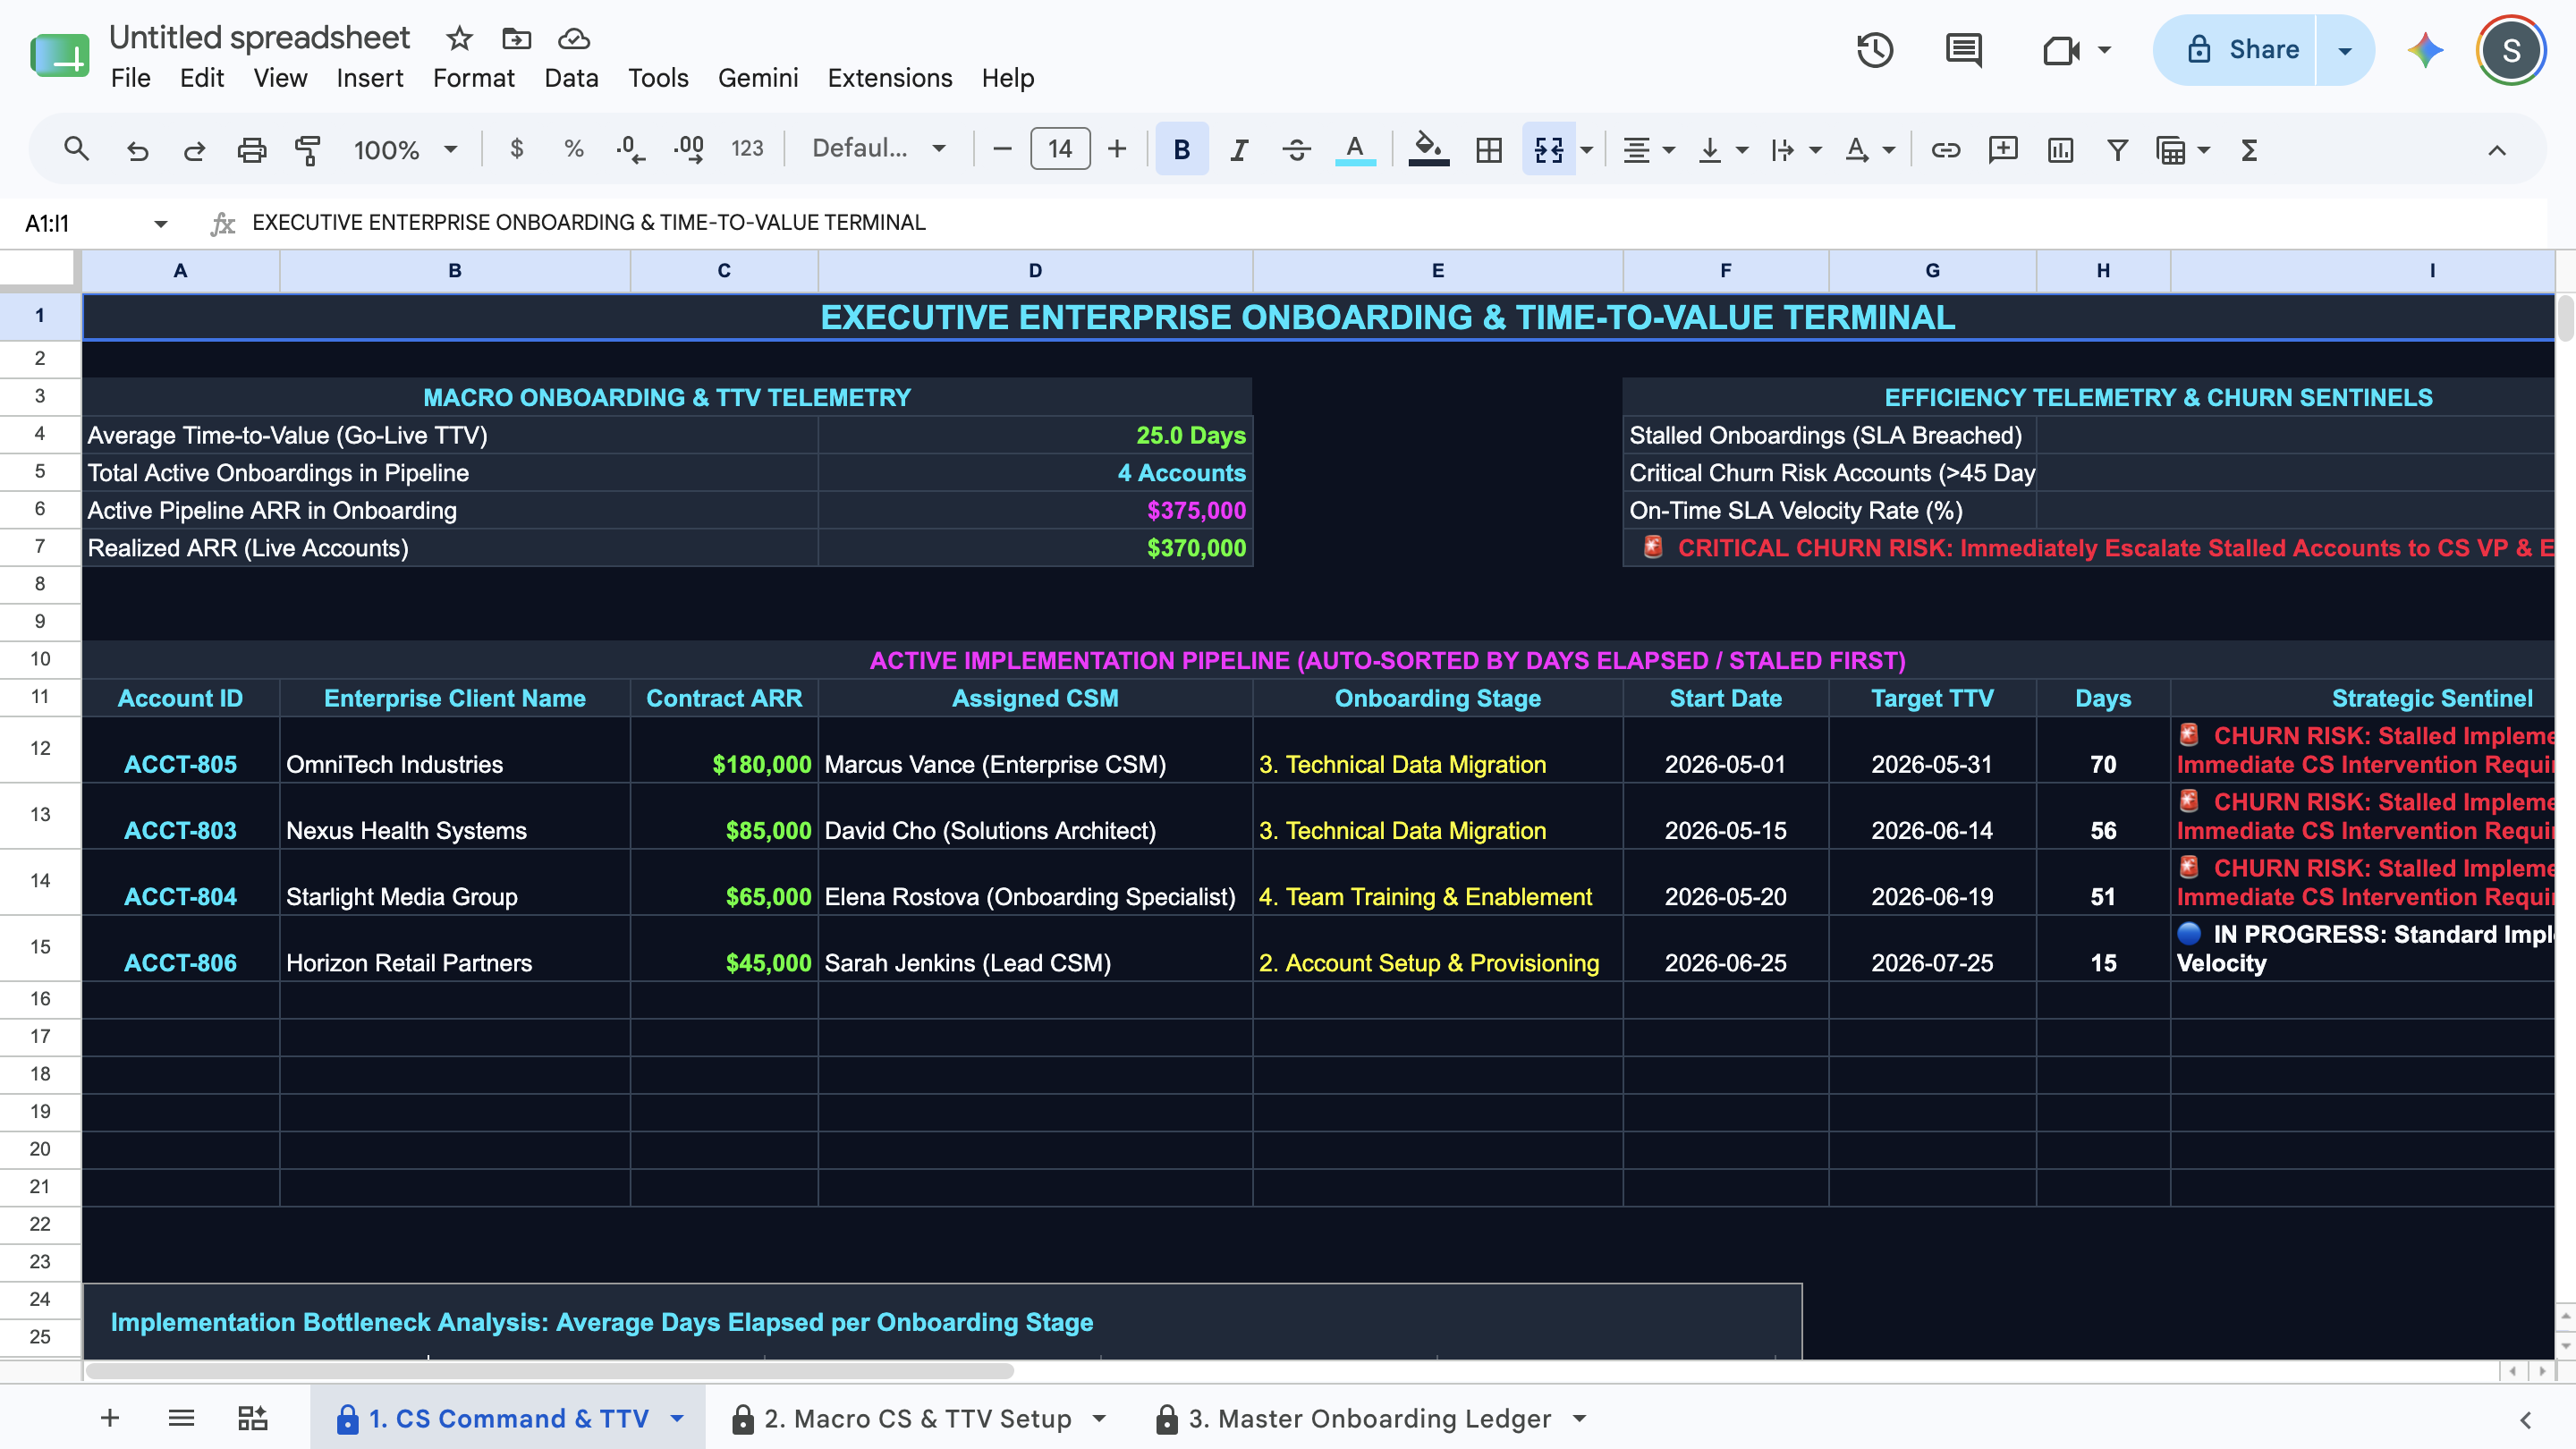
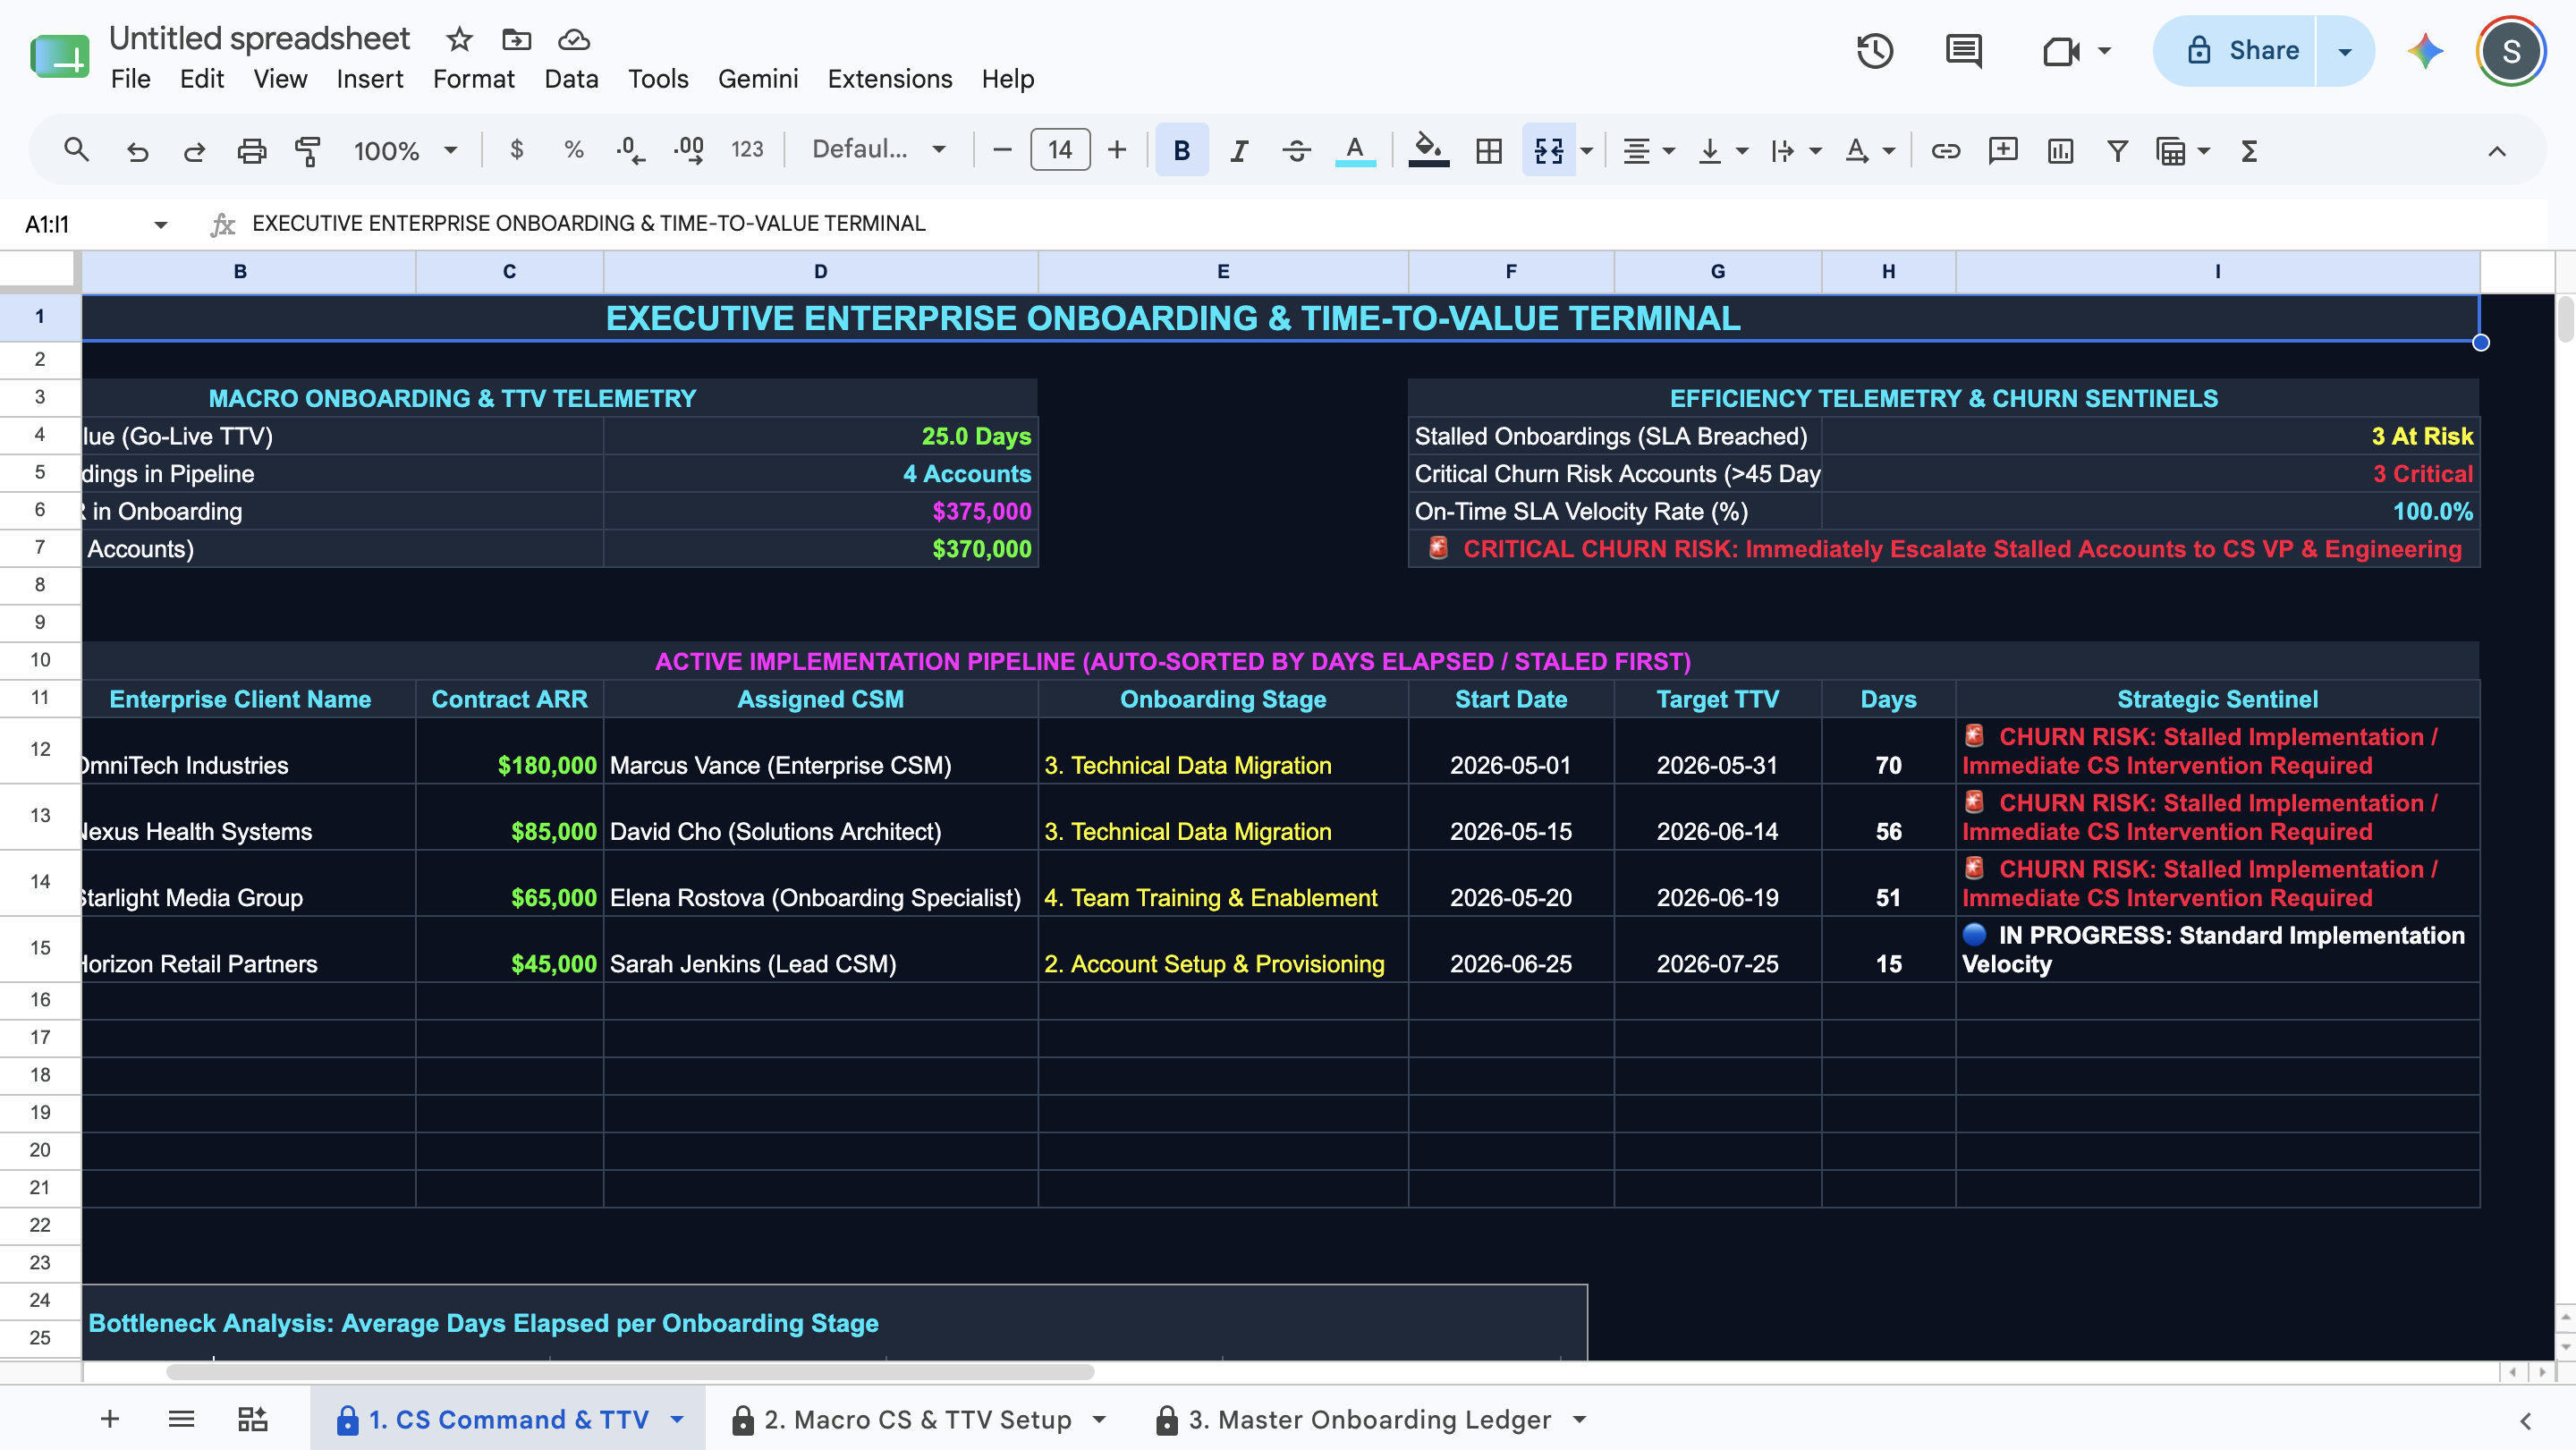
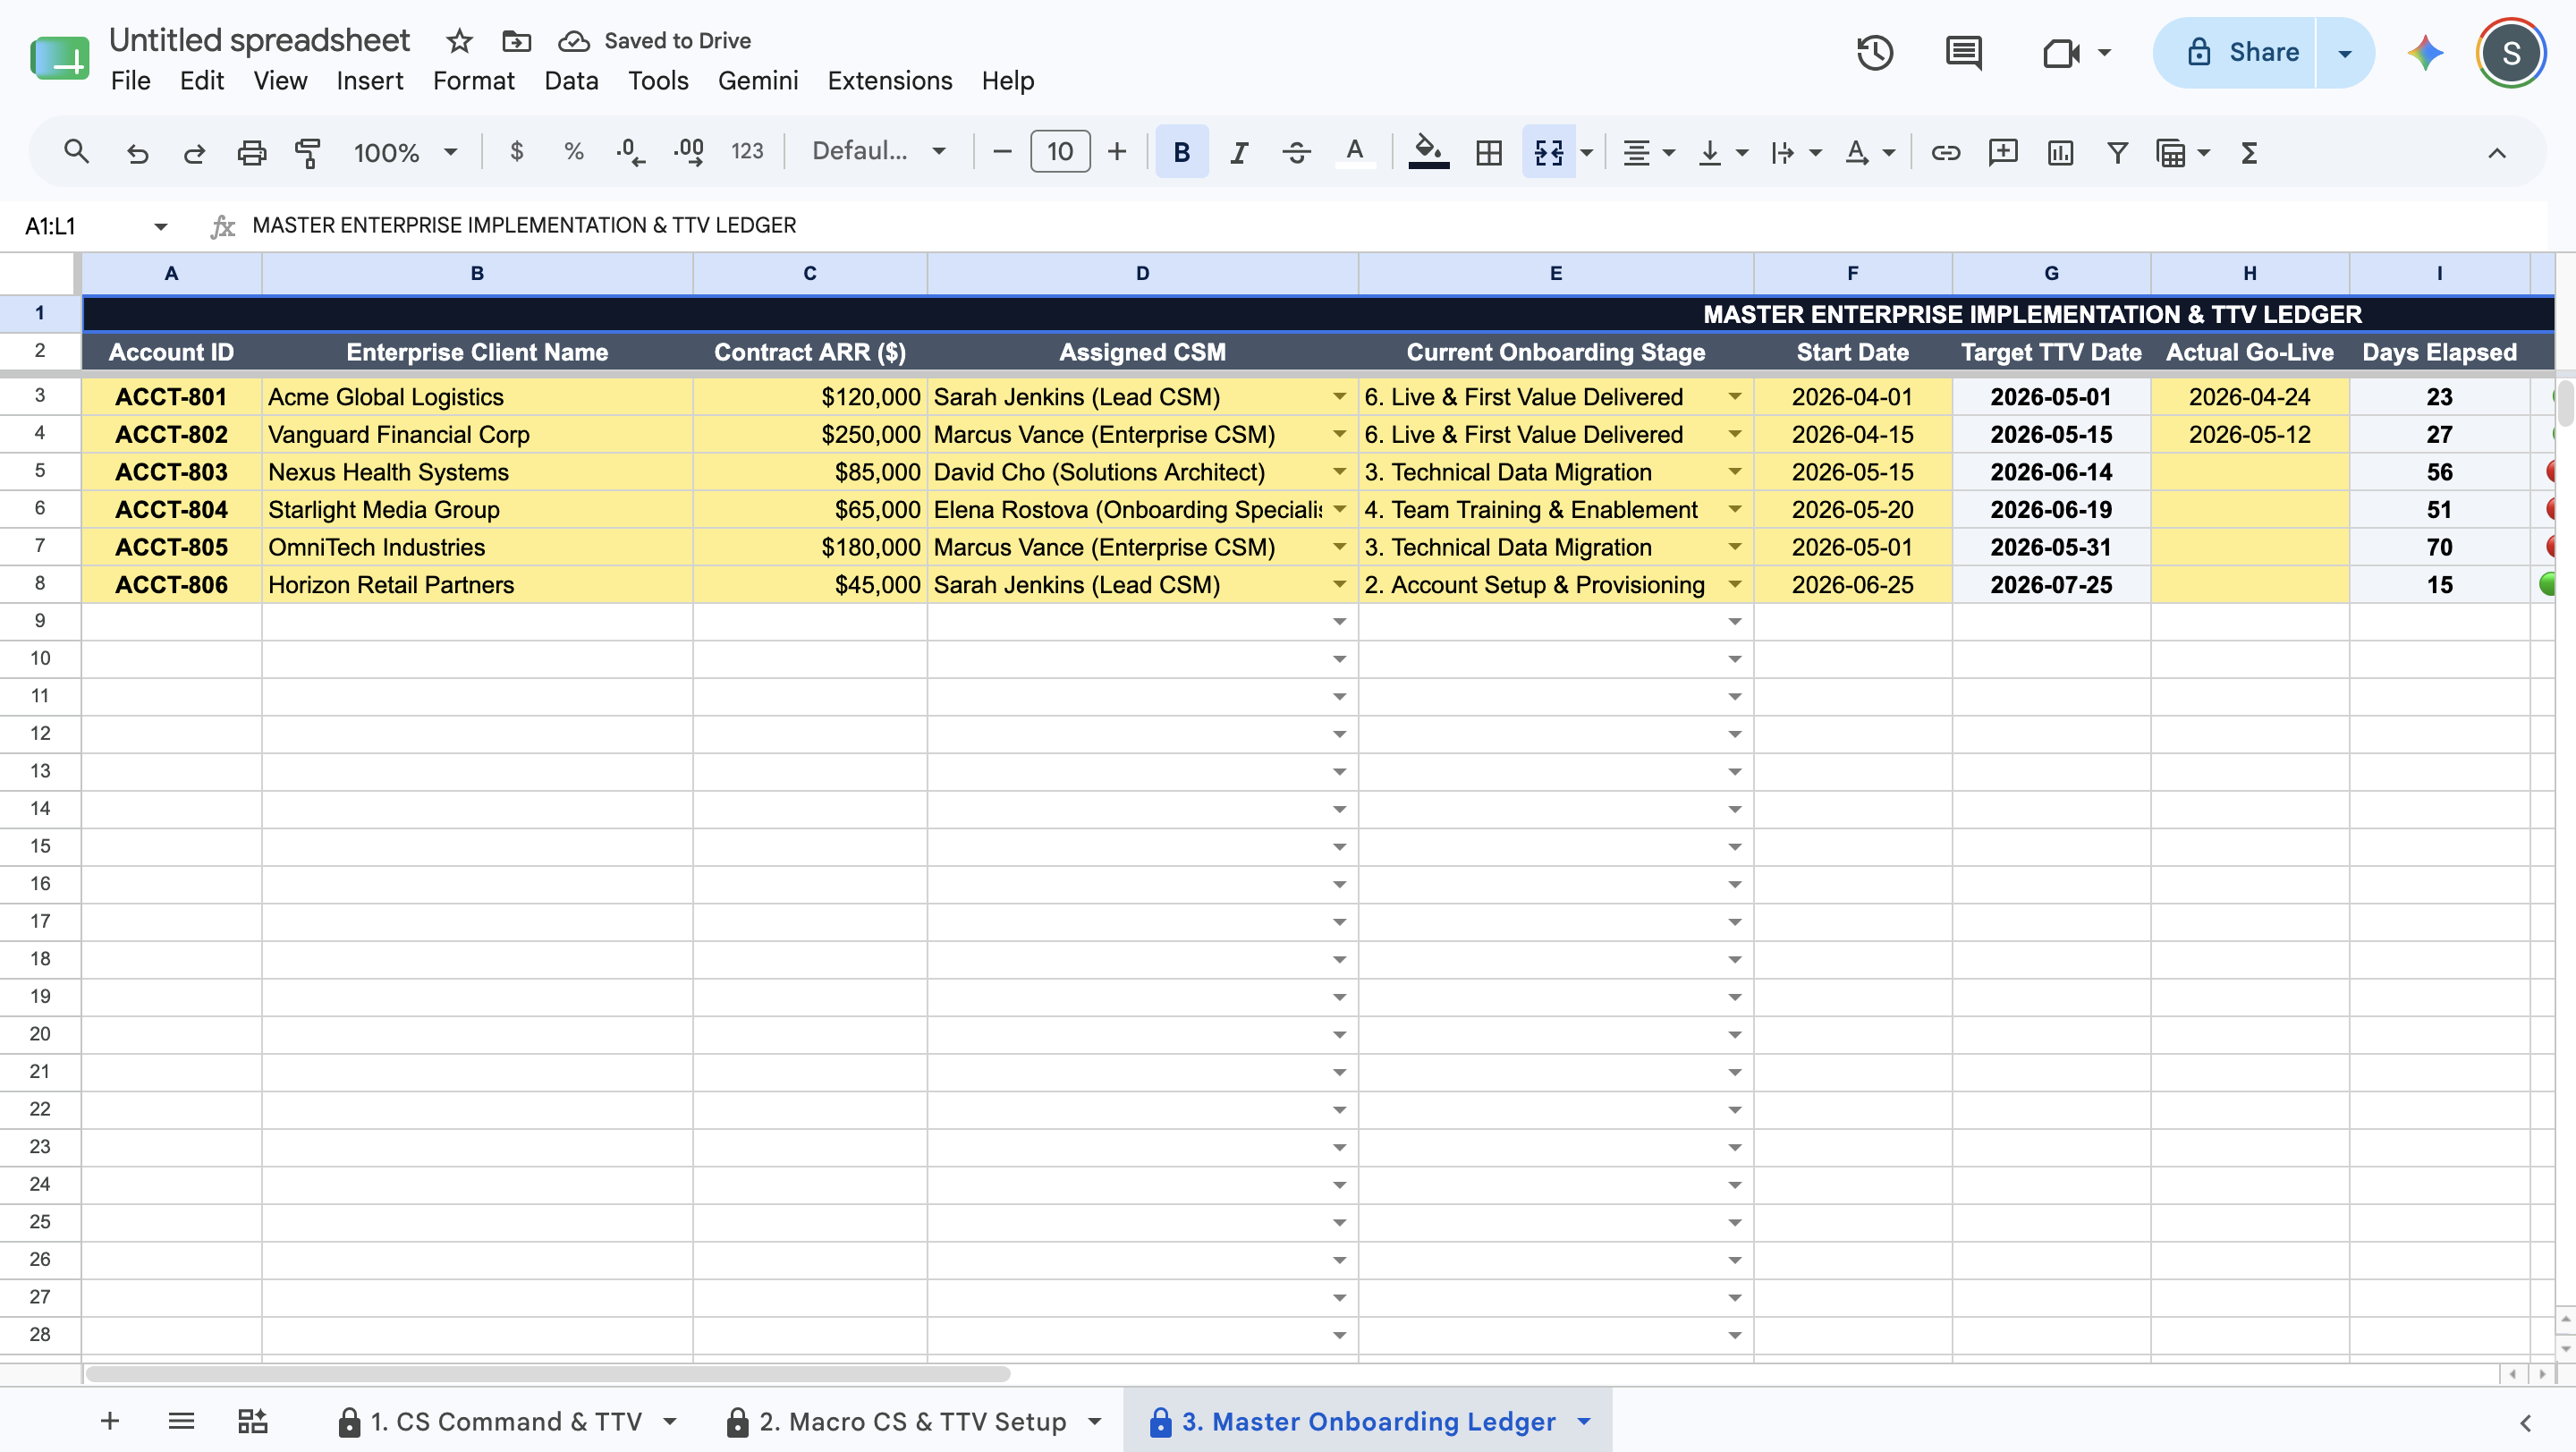
  • Granular Onboarding Lifecycle Ledger: Centralize your implementation pipeline. Track every account by its unique ID, client name, contract Annual Recurring Revenue (ARR), assigned CSM, and current implementation stage, while capturing contract signatures, target milestones, and live workspace URLs.

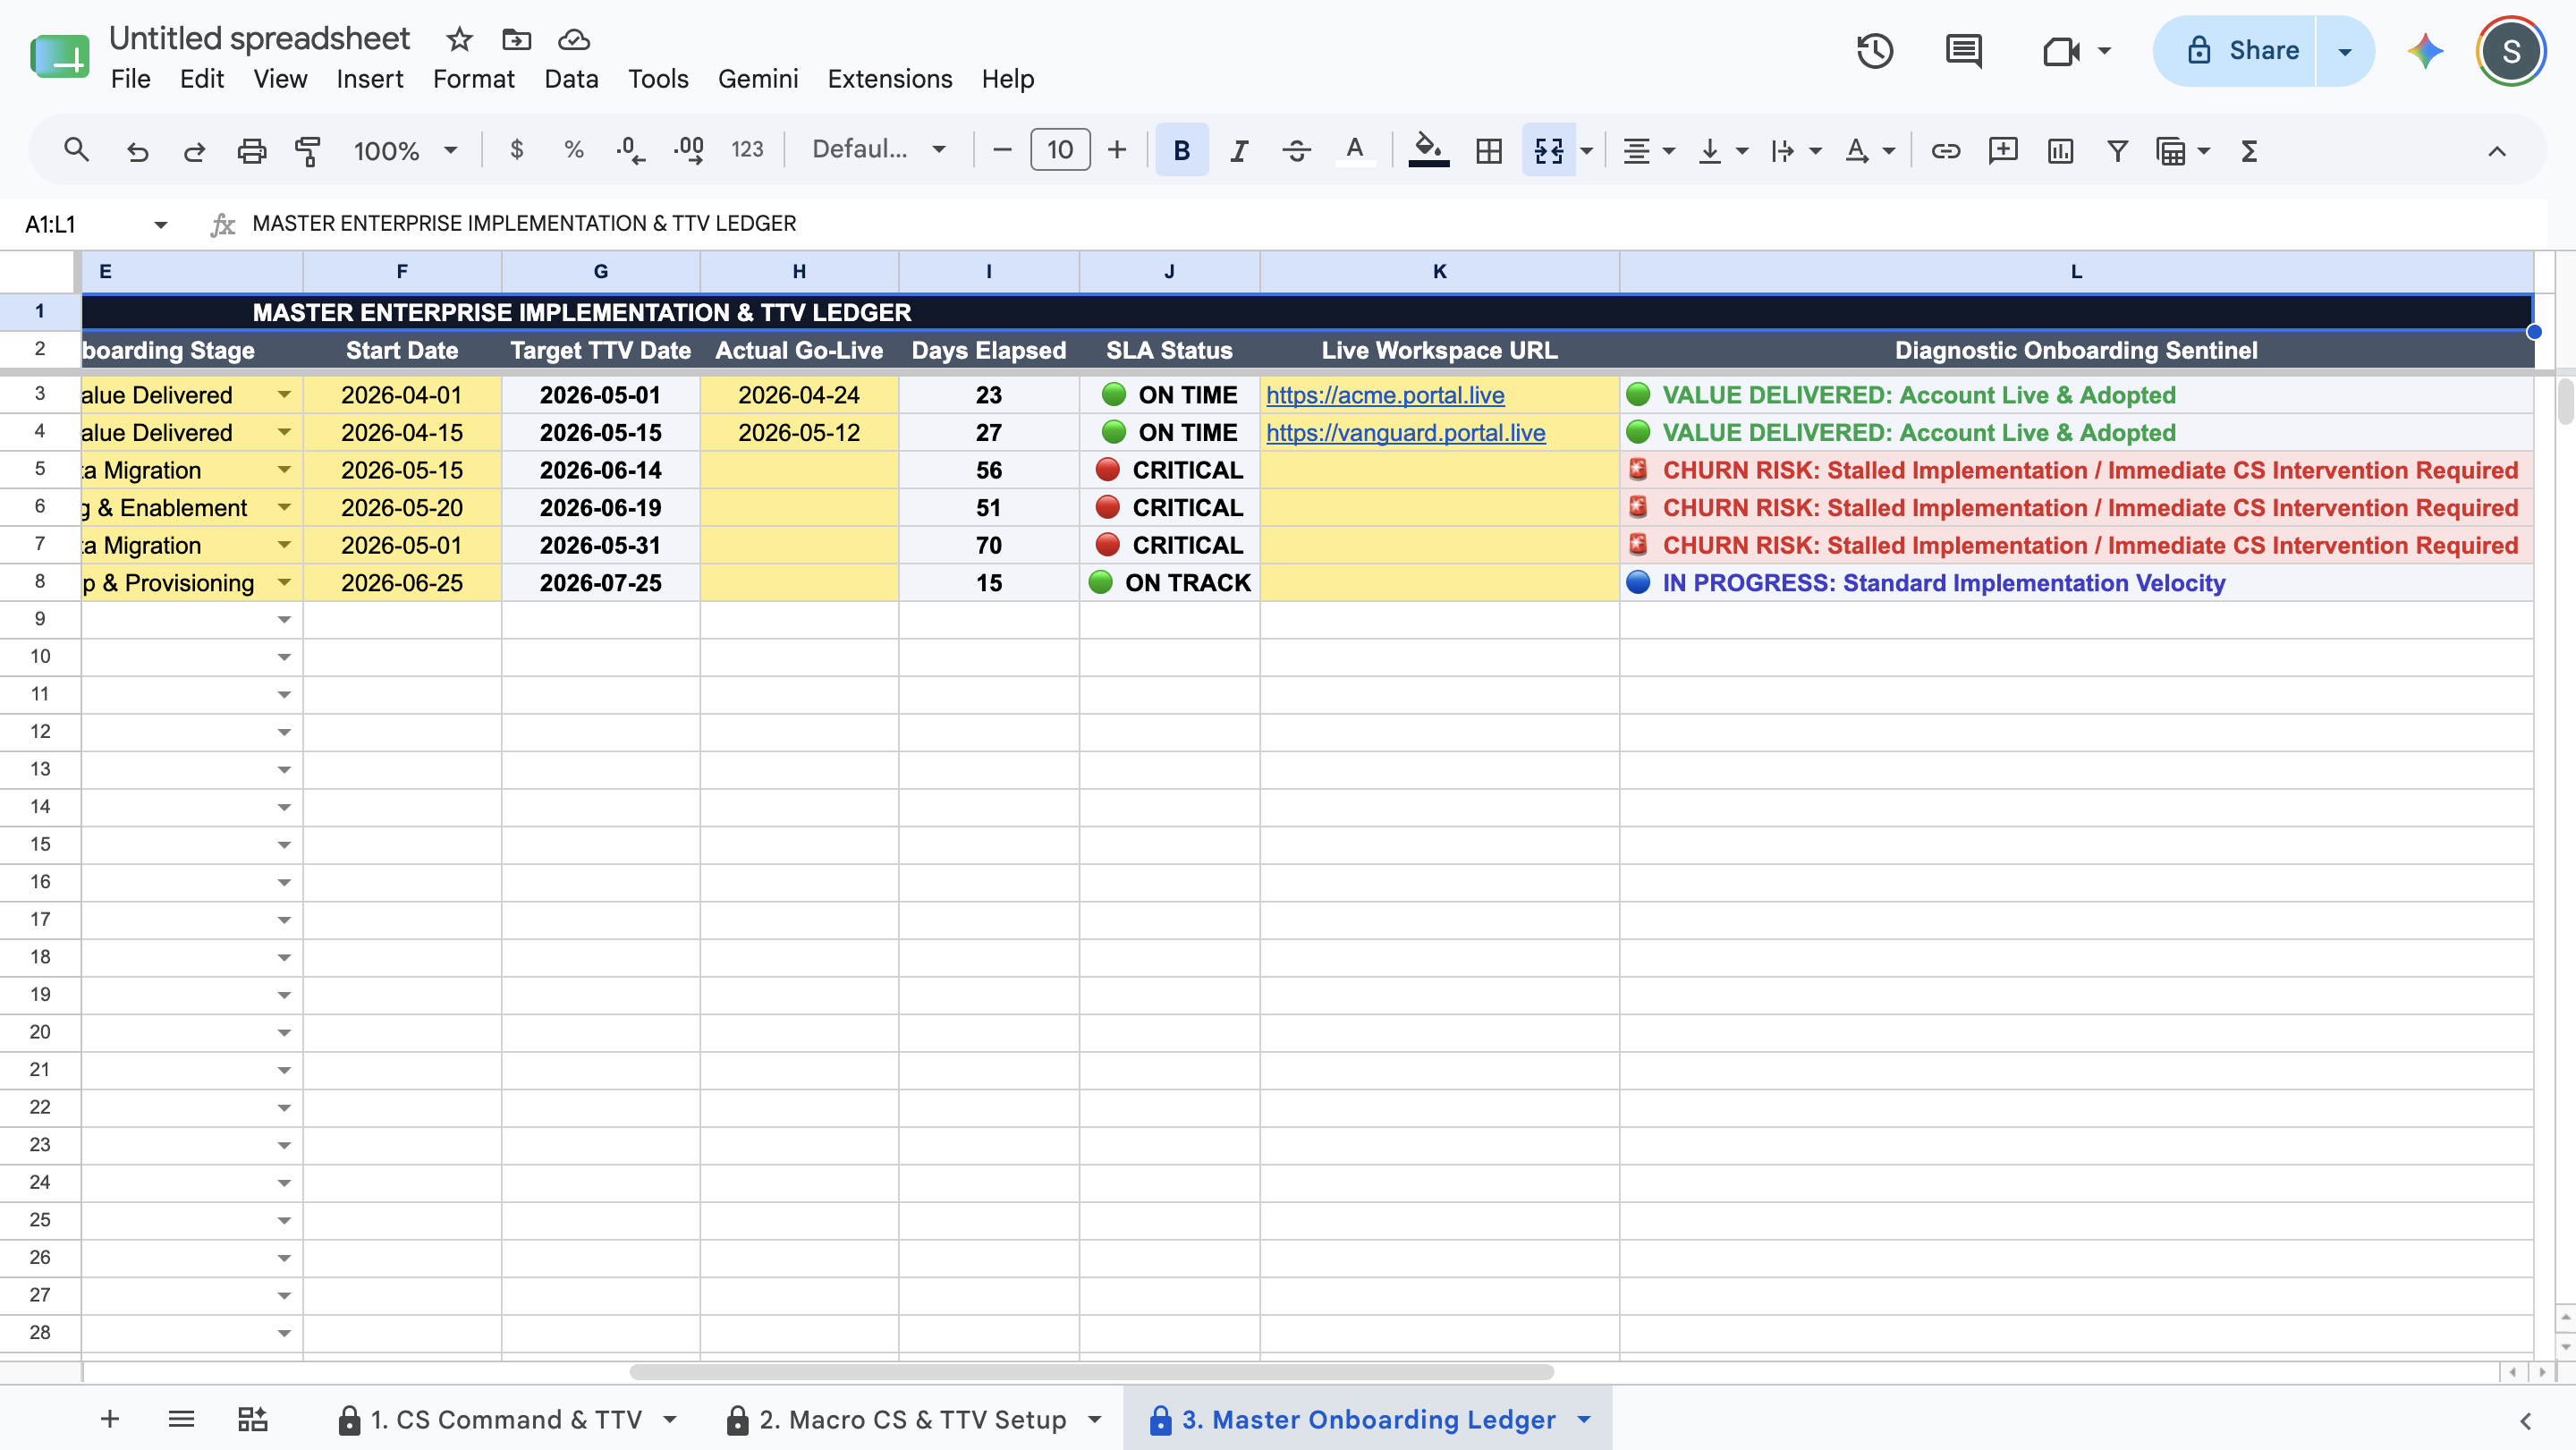
  • The Stalled Account Churn Sentinel: Protect your net revenue retention. The system continuously evaluates your active onboarding lifecycles against your custom macro deadlines. If an active client implementation gets stuck in development past your critical threshold, the dashboard instantly flashes a high-visibility alarm: 🚨 CRITICAL CHURN RISK: Immediately Escalate Stalled Accounts to CS VP & Engineering.

  • Automated TTV and SLA Tracking Math: Eliminate date calculation guesswork. The ledger dynamically generates precise target completion dates and tracks running days elapsed anchored against calendar parameters, instantly categorizing accounts by their active service level agreement status (🟢 ON TRACK, 🟡 AT RISK, or 🔴 CRITICAL).

  • Dynamic Stalled Deployments Prioritization Matrix: Maintain immediate visibility over accounts in danger. The dashboard bypasses manual list sorting by leveraging an automated background query array that dynamically filters out completed implementations and lists active, in-flight deployments—automatically ranking them by days elapsed so your oldest, most stalled accounts are forced to the top.

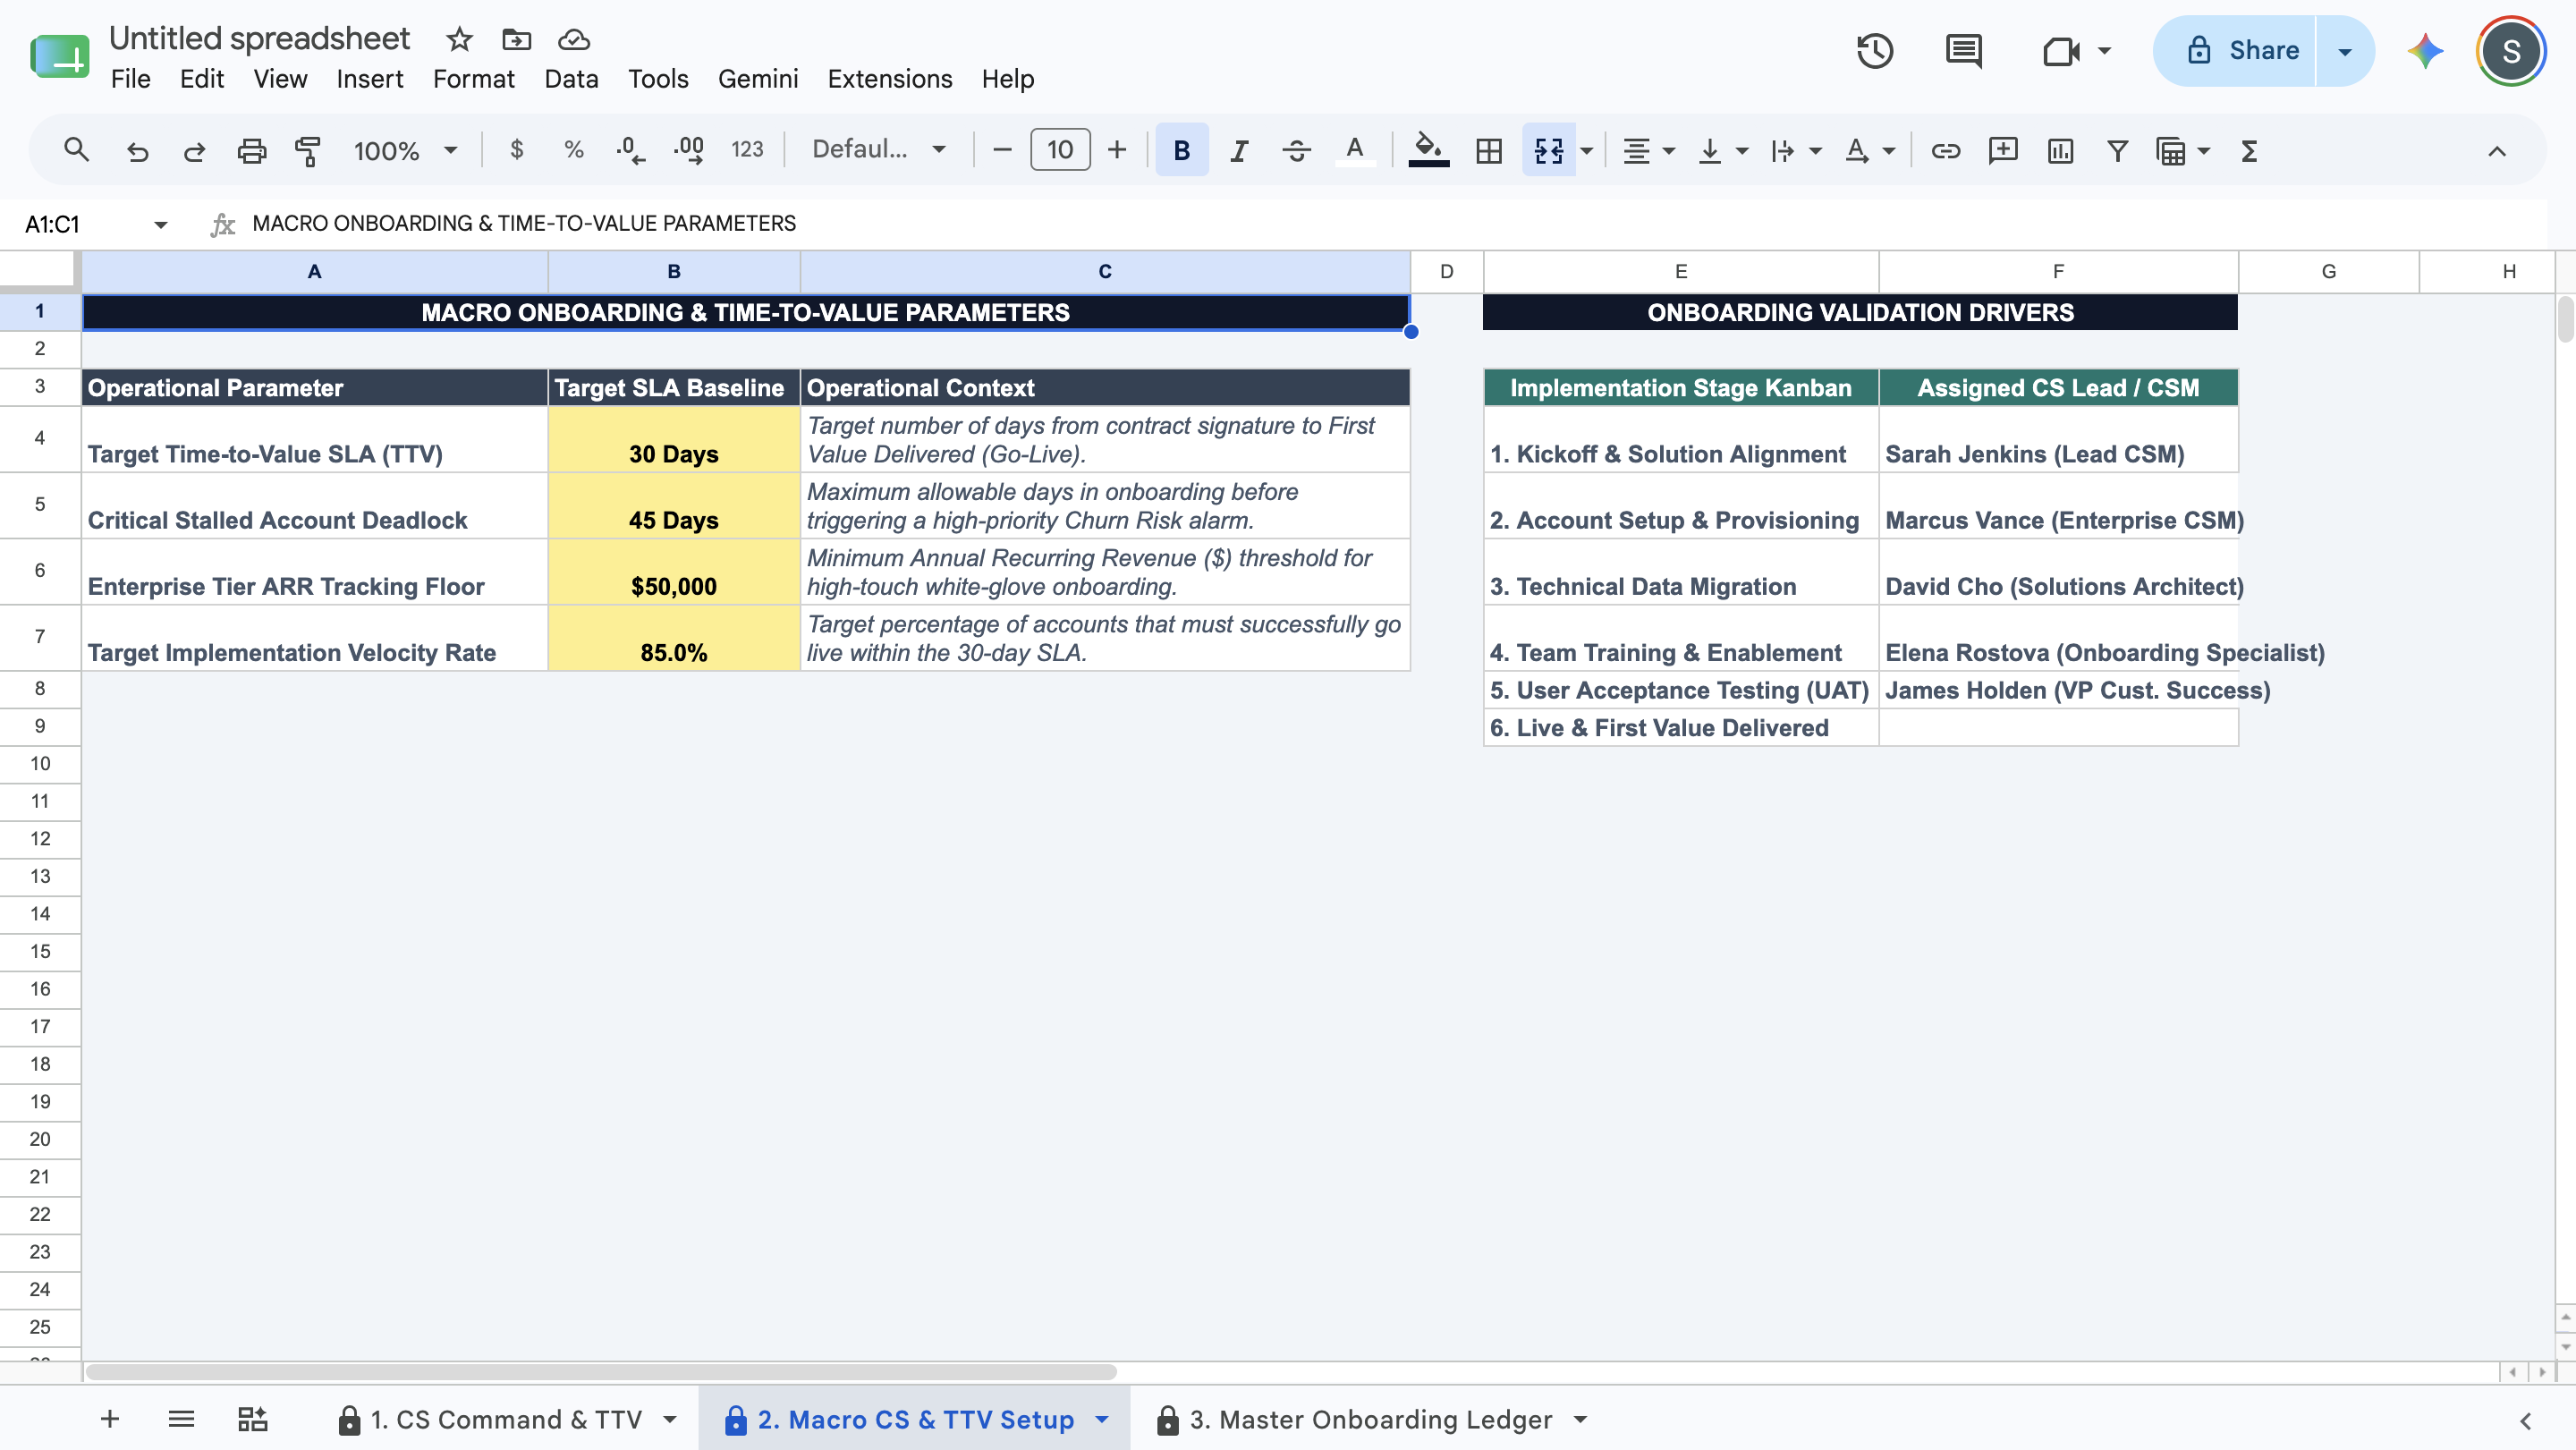
  • Macro Revenue & Capacity Telemetry: Track true post-sale efficiency indicators in real time. Instantly evaluate your historical average Time-to-Value (TTV) in days, total active accounts in pipeline, active pipeline ARR currently locked in onboarding, realized live ARR, and your overall On-Time SLA Velocity Rate.

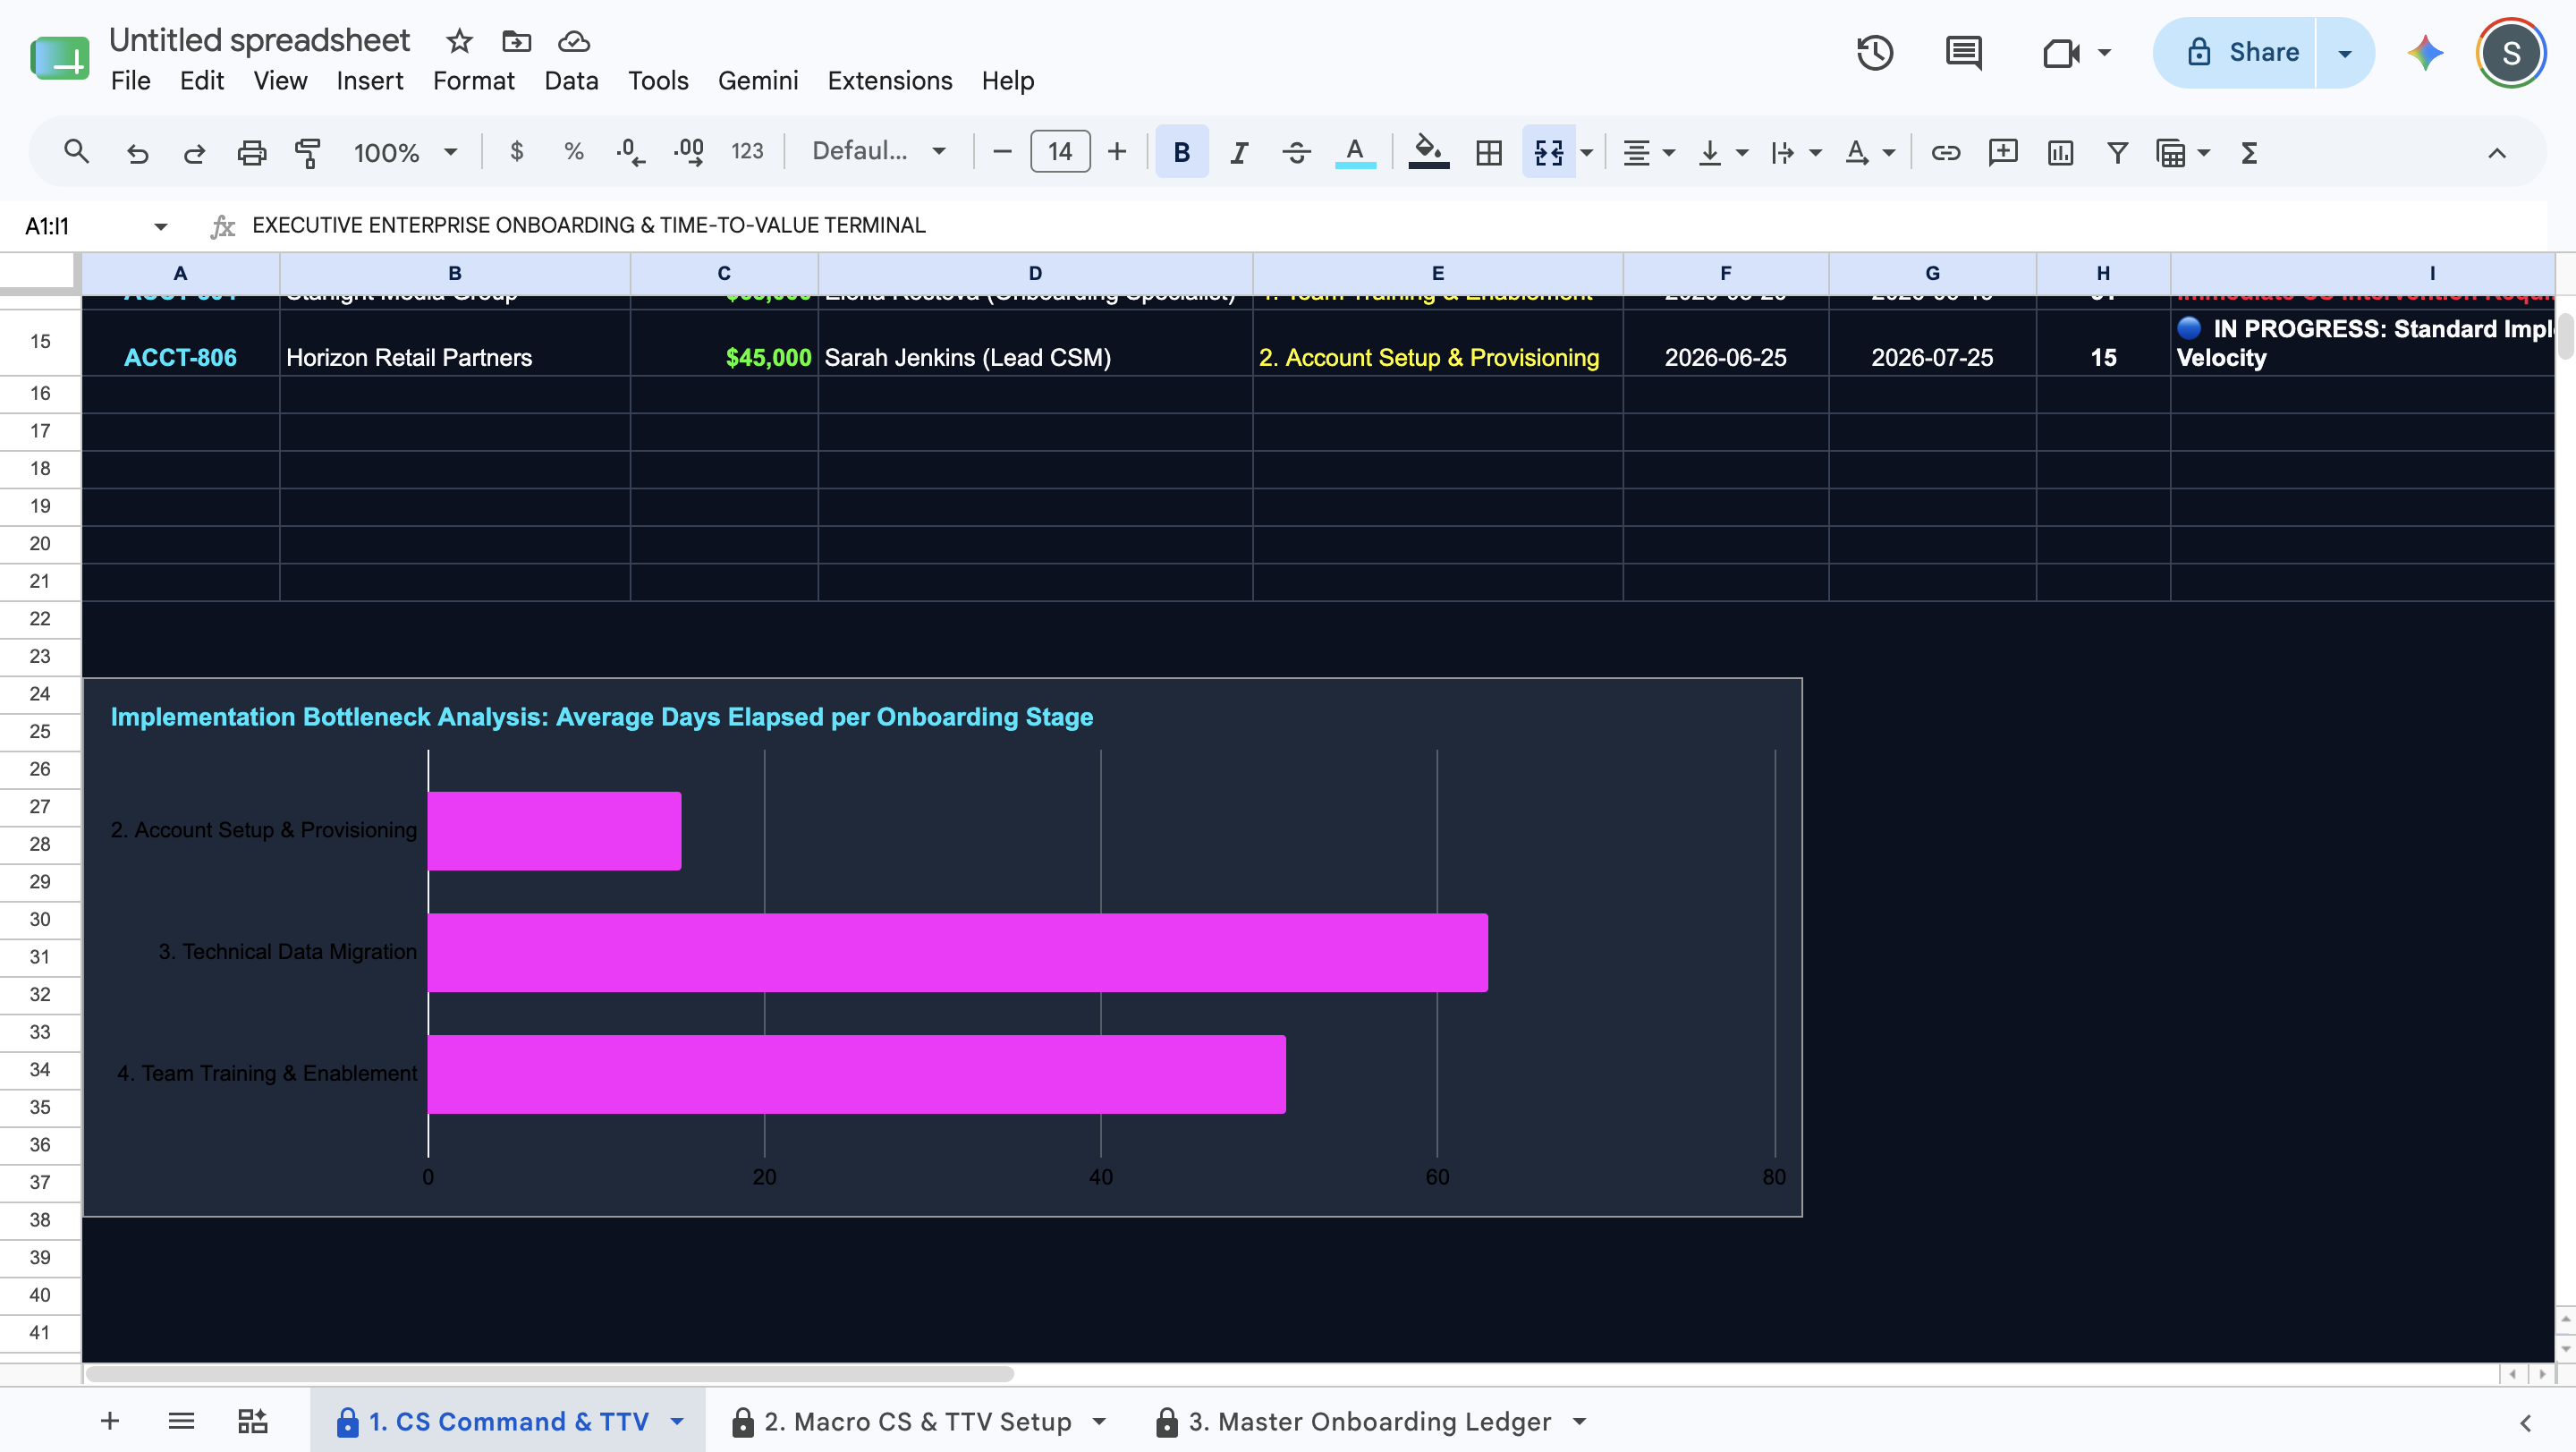
  • Visual Implementation Bottleneck Analysis Chart: Drive strategic engineering and resource planning instantly. The integrated dark-mode bar chart automatically computes the historical mathematical mean of days spent per onboarding stage, showing leadership exactly which phase—such as technical data migration or team training—is delaying client launch timelines.

  • Digitally Shrink-Wrapped Architecture: Engineered strictly as a cloud-native Google Sheet. Only the soft yellow (#FEF08A) input cells are unlocked. Your master query matrices, automated date mathematics, and portfolio telemetry indicators are entirely protected to guarantee zero formula corruption.


Stop guessing why your implementations are running late, risking post-sale churn, or letting operational bottlenecks stall your hard-earned ARR. Establish complete mathematical control over your client onboarding lifecycle, maintain an elite implementation velocity, and export grid-free PDF retention summaries directly from your web browser.

This Best Practice includes
1 Google Sheet, 1 User Guide

Acquire business license for $19.00 $1.90

Add to cart

Add to bookmarks

Discuss

Further information

Centralize and monitor enterprise post-sale implementations across contract size, assigned CSMs, and milestone stages.

Automatically aggregate and tie top-of-funnel customer contract parameters directly to down-funnel implementation lifecycle states.

Compute live velocity metrics including exact running days elapsed, target completion dates, and historical baseline Time-to-Value (TTV) averages.

Protect recurring revenue by triggering high-visibility churn sentinels on stalled accounts that breach critical implementation timeframes.

Isolate systemic operational bottlenecks by automatically calculating and charting the mathematical mean of days spent in each onboarding stage.

Export a clean, grid-free PDF customer success roadmap memorandum to align VPs, account executives, and operational leaders.

VPs of Customer Success, Directors of Implementation, and Operations Managers managing high-touch enterprise software onboarding pipelines.

RevOps and Customer Success Operations professionals who need a clean, structured ledger to track post-sale deployment velocity and map revenue go-live timelines.

Scaling B2B tech startups, bootstrapped SaaS companies, and technical service agencies looking to optimize onboarding efficiency without recurring software taxes.

Consumer-facing B2C digital applications or low-touch self-serve software products requiring automated, programmatic user analytics.

Highly custom hardware deployment environments requiring field service engineers to log localized hardware installation steps and shipping logistics manually.

Users seeking a standard Microsoft Excel (.xlsx) file workbook (This asset is built natively and exclusively for Google Sheets to optimize its real-time multi-variable sorting, automatic data validation clearing, and background query matrix sorting).


0.0 / 5 (0 votes)

please wait...