Originally published: 04/01/2022 13:20
Publication number: ELQ-66115-1
View all versions & Certificate
Publication number: ELQ-66115-1
View all versions & Certificate

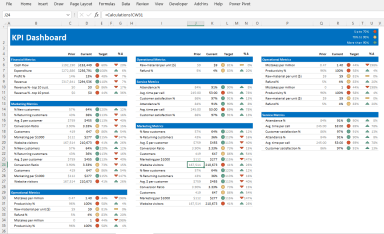
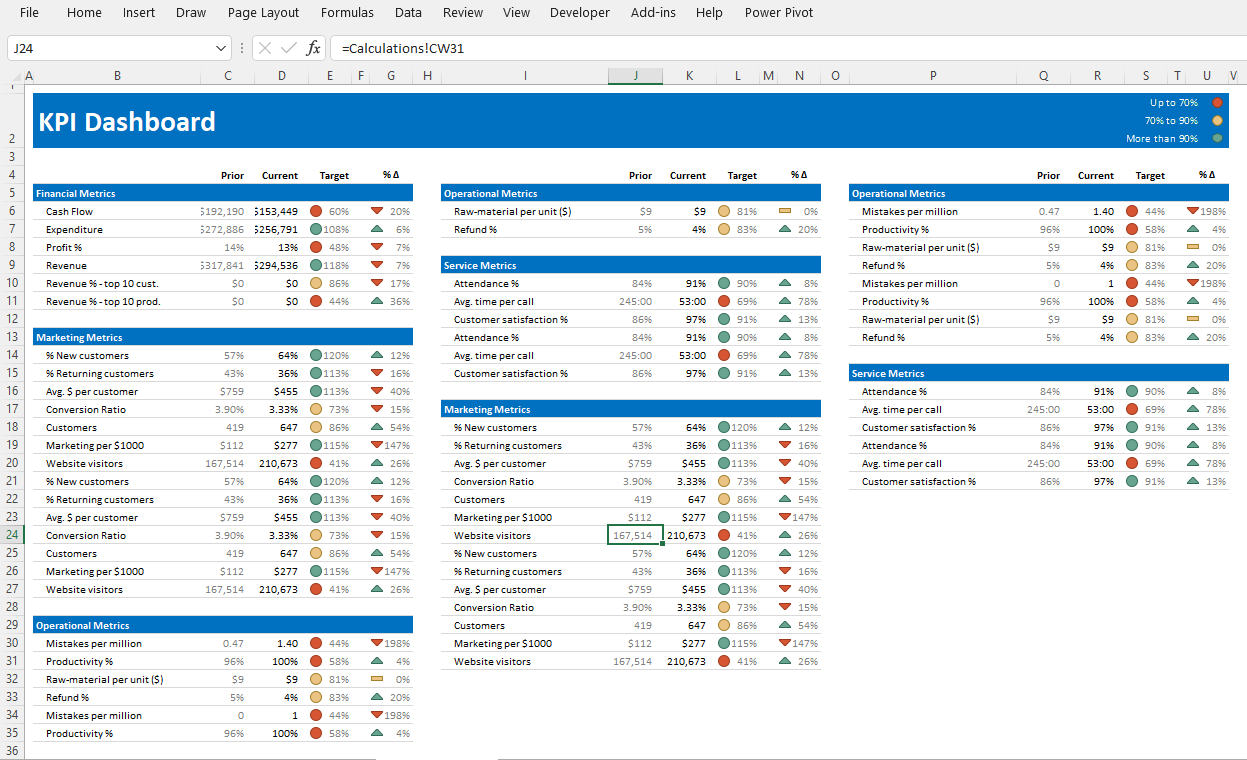
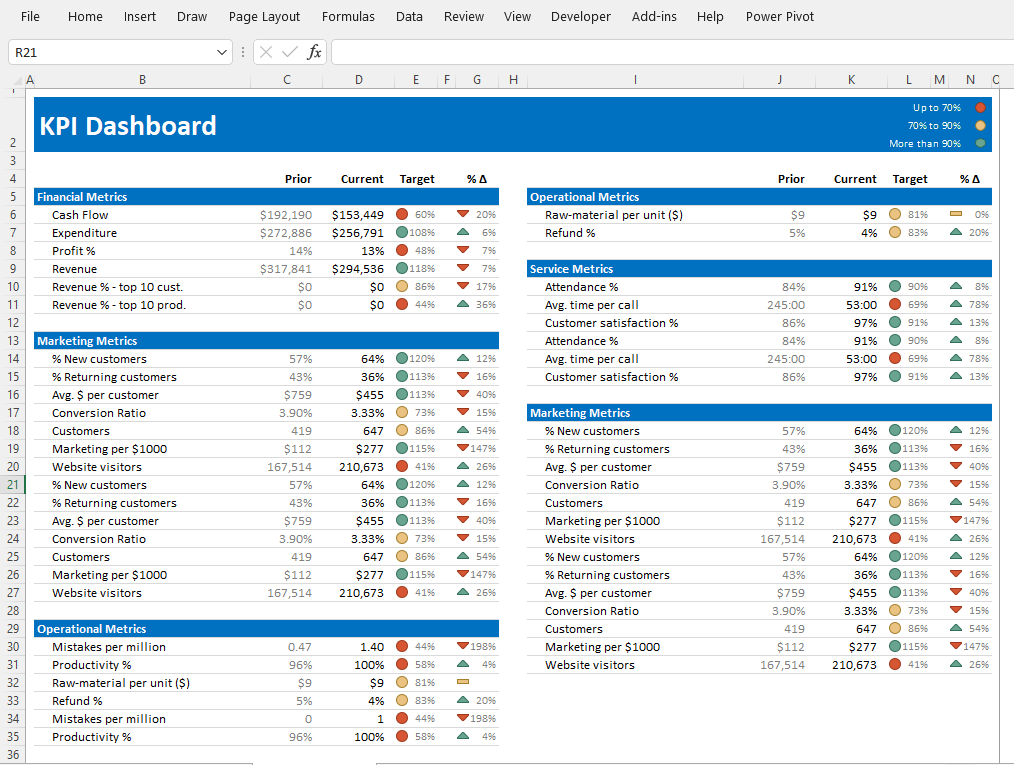
KPI Dashboard in Microsoft Excel
KPI Dashboard in Microsoft Excel
Founder & CEO - Excel Basement, Microsoft MVP (Excel) 2025, MCT, MSOM, Excel & POWER BI Trainer & Consultant, MBA (MIS), Emerging Data ScientistFollow 464
