
Solar PV C&I Model
Originally published: 18/05/2026 15:27
Publication number: ELQ-29185-1
View all versions & Certificate
certified

Solar PV C&I Model

Solar PV C&I Model — Evaluate a Commercial or Industrial Solar PV Project in Any of 8 Markets, Including Tax Shield and Optional BESS

Description
If you develop, finance or advise on commercial and industrial solar PV projects, you know the problem: the financial logic is fundamentally different from utility-scale. The revenue is not a PPA or a FiT — it is a bill saving. The incentive is not a grant — it is a tax shield from depreciation, and it works differently in every country. CAPEX per kWp is lower but so are the tariffs. Self-consumption is high but varies by site. No standard utility-scale model handles this correctly.

This model does.

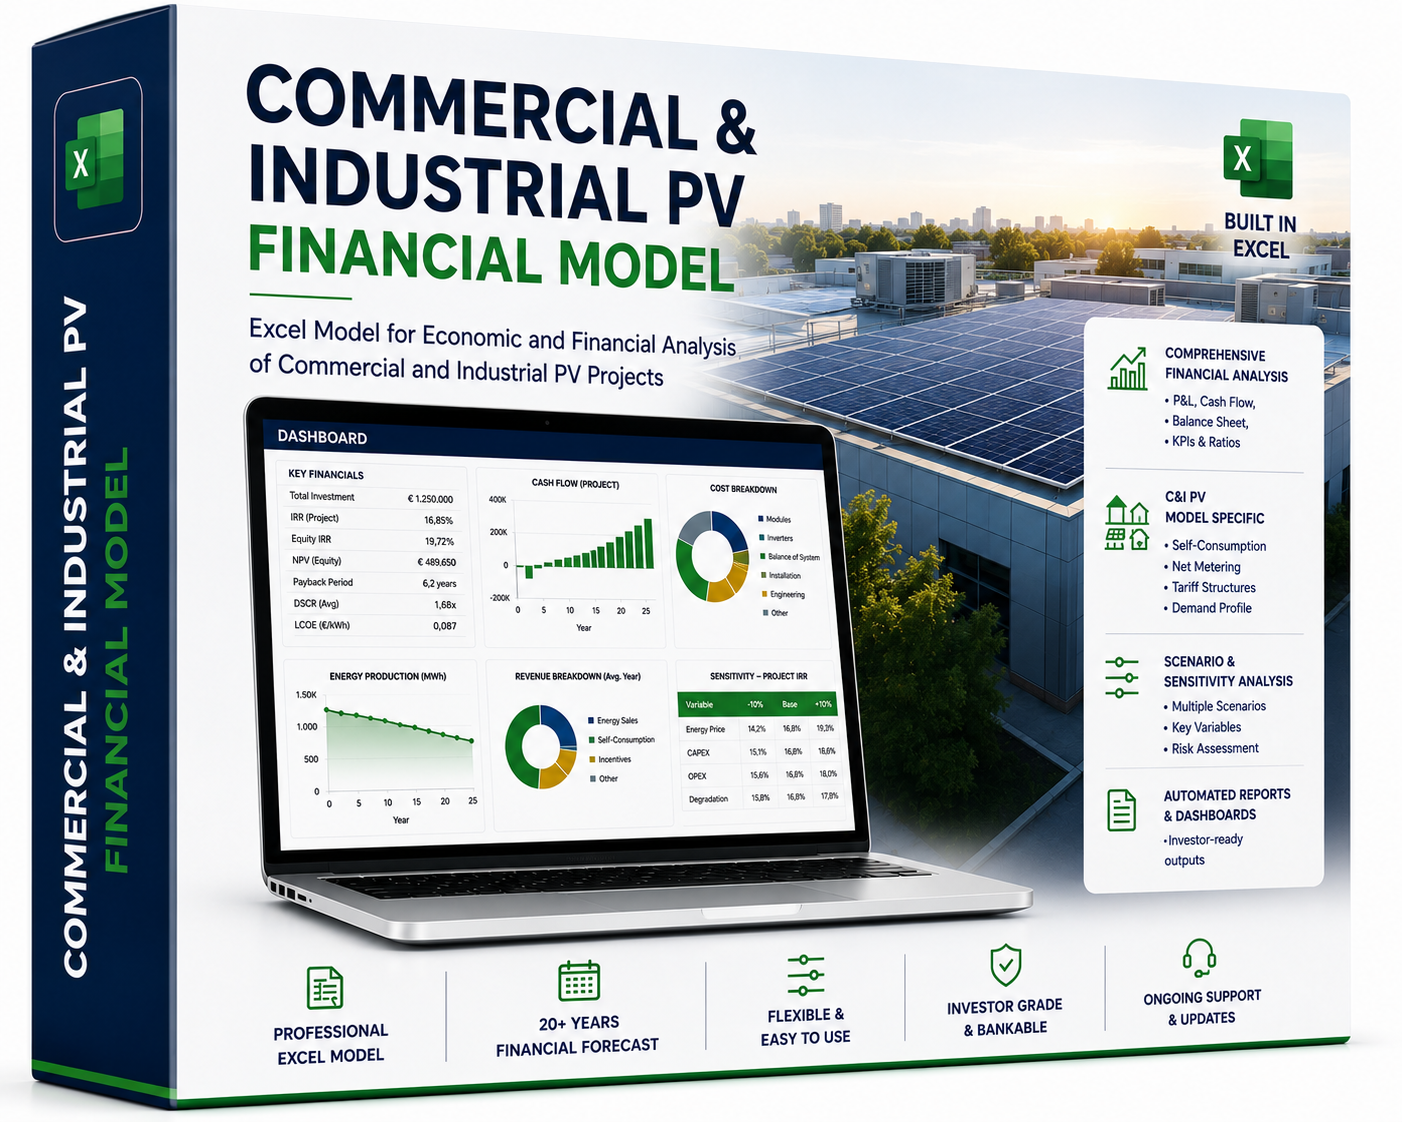
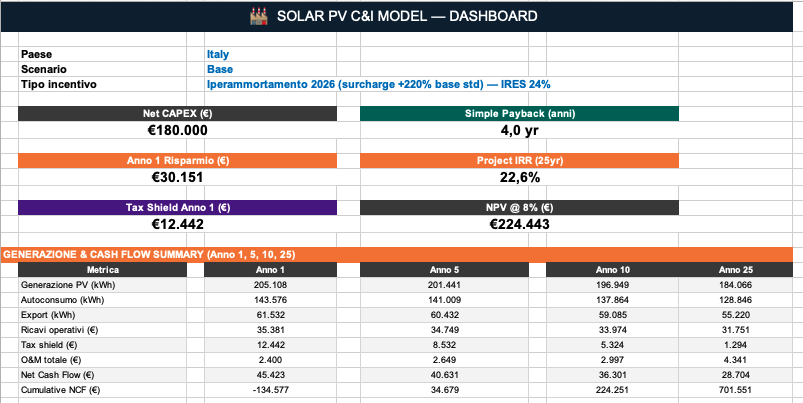
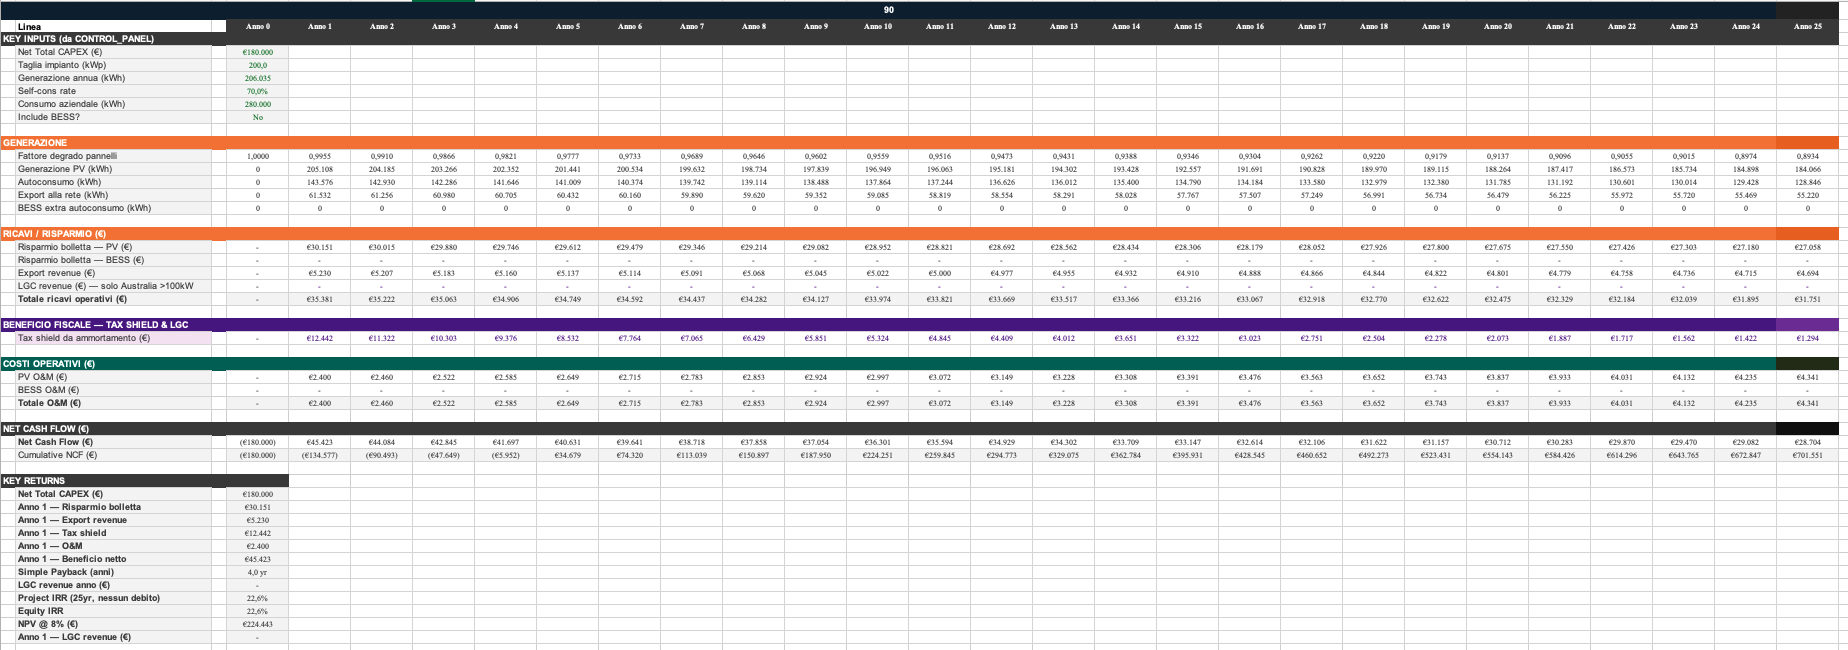
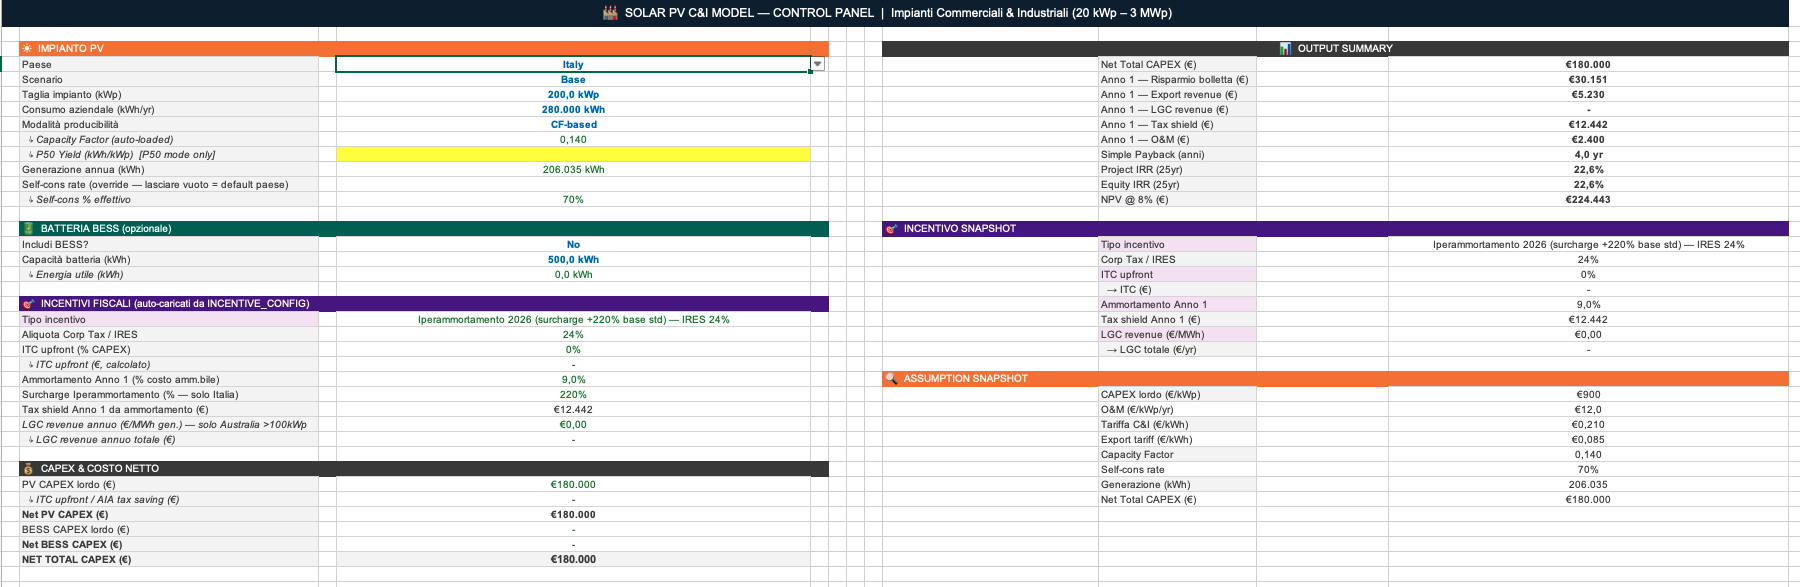
Open it, select your country and scenario, enter the plant size in kWp, the company's annual consumption and the expected self-consumption rate — and every output updates automatically. Simple payback, Project IRR, NPV, annual bill saving, export revenue, tax shield year by year. A full 25-year equity cash flow with panel degradation, O&M escalation and the correct depreciation mechanics for your market. Ready to present to a CFO, a board or a financing partner.


What makes it different from a generic C&I spreadsheet
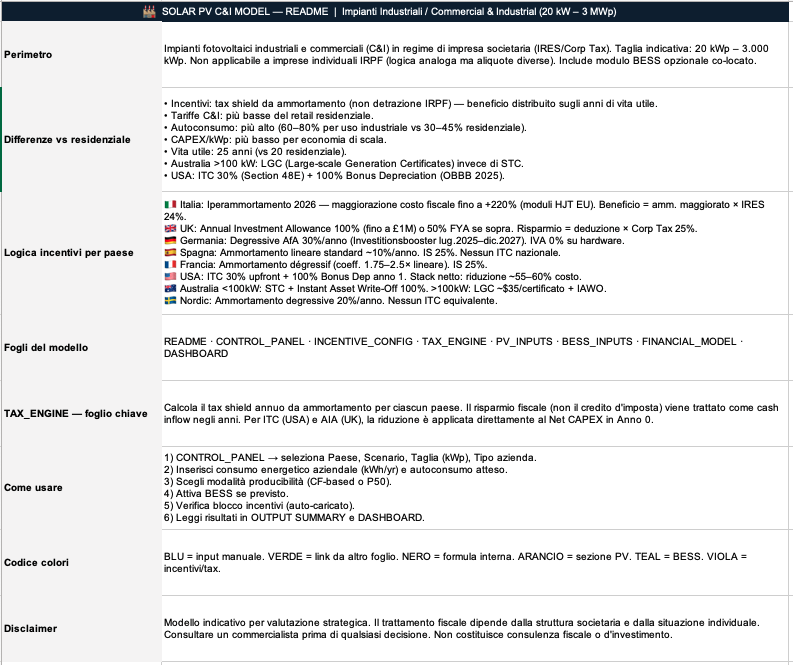
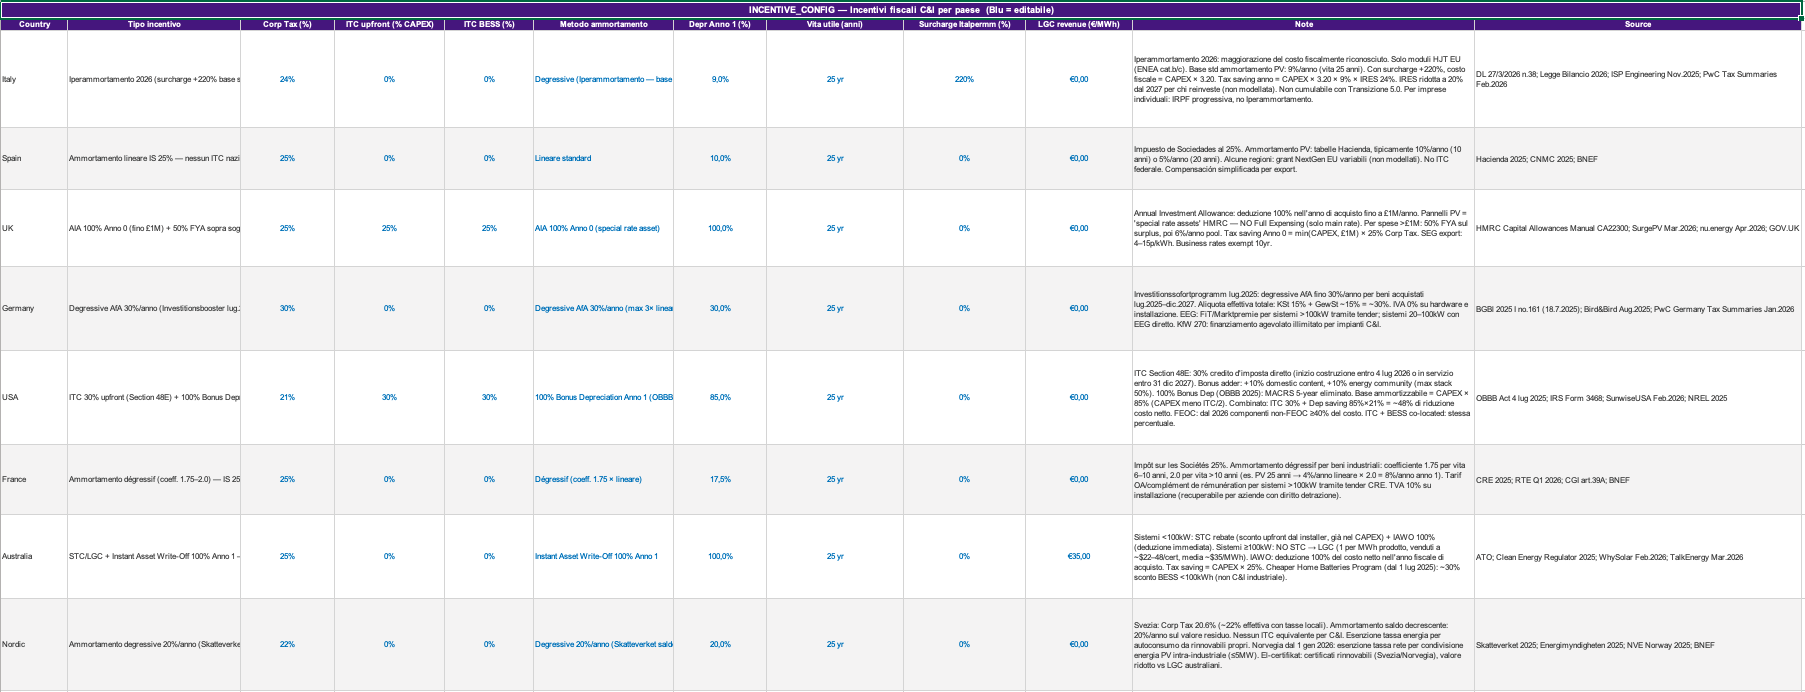
The tax incentive engine is the core differentiator. Each of the 8 countries has a completely different corporate tax treatment of solar PV investment, and the model handles each one correctly. Italy's Iperammortamento 2026 applies a surcharge of up to +220% on the depreciable cost base for HJT EU modules, with the tax saving calculated on the enhanced base at IRES 24%. The UK's Annual Investment Allowance gives a 100% deduction in year zero up to £1M, with a 50% First Year Allowance on the surplus, directly reducing net CAPEX in Anno 0. Germany's Investitionsbooster allows 30% degressive AfA per year on assets acquired between July 2025 and December 2027, with zero VAT on hardware and installation. The USA stacks ITC Section 48E at 30% upfront with 100% Bonus Depreciation under the OBBB Act 2025 on 85% of the depreciable base, producing a combined net cost reduction of approximately 55-60%. France uses coefficients dégressifs of 1.75-2.0x the straight-line rate. Australia handles the split between STC rebate for sub-100kW plants and LGC certificates at approximately €35/MWh for larger installations, alongside Instant Asset Write-Off. Nordic markets apply 20% degressive amortisation on the declining balance under Skatteverket rules.

All of this is pre-loaded and pre-calibrated. You do not need to build the tax logic — you need to enter your project data and read the result.

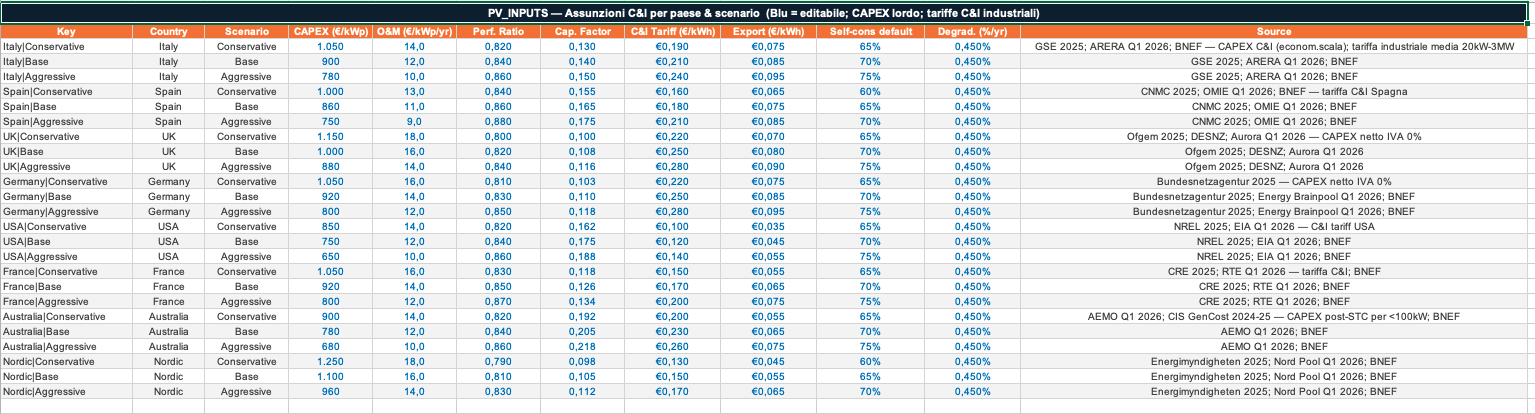
The revenue model reflects how C&I projects actually earn money. Bill saving on self-consumed energy uses country-specific C&I industrial tariffs, not retail household rates. Export revenue uses separate export tariffs by country and scenario. Self-consumption rates default to country benchmarks — 65-75% for industrial use — but can be overridden for site-specific analysis. Panel degradation at 0.45% per year and O&M escalation at 2.5% per year are applied across the 25-year horizon.

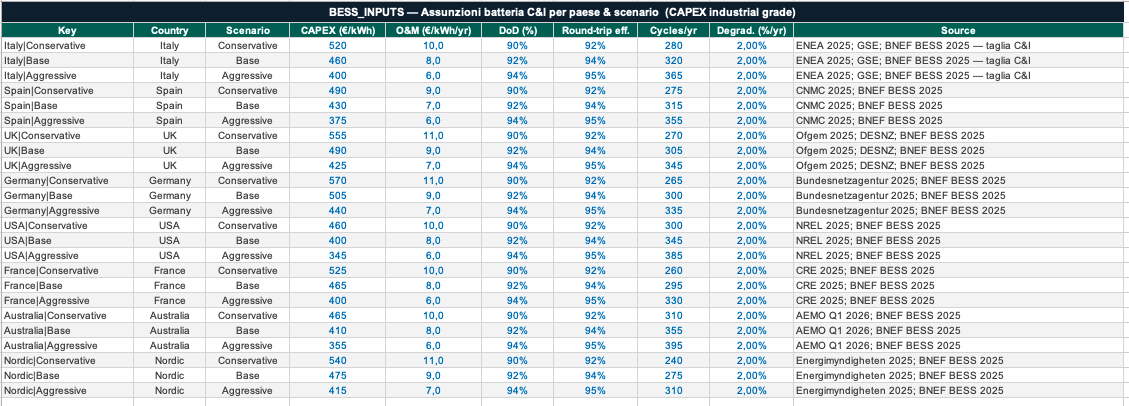
The optional BESS module evaluates co-located battery storage with a single toggle. BESS CAPEX, O&M, round-trip efficiency, cycles and degradation are loaded automatically by country and scenario from a dedicated table calibrated at industrial-grade sizing, and the additional bill saving from increased self-consumption is calculated separately.


Who this is for
Industrial and commercial developers evaluating rooftop or ground-mounted PV for corporate clients. Financial advisors and ESCo teams preparing business cases for C&I customers. CFOs and energy managers assessing the financial case for self-generation. M&A teams running quick-turn valuations on C&I solar assets where the tax treatment is a material component of the return.


Workbook: README · CONTROL_PANEL · INCENTIVE_CONFIG · TAX_ENGINE · PV_INPUTS · BESS_INPUTS · FINANCIAL_MODEL · DASHBOARD.


For custom versions, country extensions or specific requests, contact us at [email protected]

This Best Practice includes
1 Excel Model, 1 PDF Guide

Acquire business license for $107.00

Add to cart

Add to bookmarks

Discuss

Further information

This model enables developers, advisors and corporate energy managers to evaluate the financial viability of a commercial or industrial solar PV project across 8 international markets, capturing the full corporate tax incentive mechanics specific to each country. It calculates bill savings on self-consumed energy using country-specific C&I tariffs, export revenue on grid-injected surplus, and annual tax shield from depreciation using the correct amortisation method and rate for each market — straight-line, degressive or ITC-based. It produces Project IRR, NPV and simple payback from a full 25-year equity cash flow with panel degradation and O&M escalation, and evaluates the incremental value of co-located BESS storage with country-calibrated assumptions across Conservative, Base and Aggressive scenarios.

This model is best suited to commercial and industrial solar PV projects in the 20 kWp–3 MWp range at early-stage feasibility or commercial evaluation, where the company operates under corporate tax — IRES, Corporation Tax, Körperschaftsteuer, Impôt sur les Sociétés or equivalent — and the tax shield from depreciation is a material component of the financial case. It works particularly well for Germany in the Investitionsbooster window (July 2025–December 2027), Italy with Iperammortamento 2026 eligible modules, and USA where the ITC plus Bonus Depreciation stack significantly compresses payback. It is also suited to sites where self-consumption is high — industrial processes running during daylight hours — and to projects considering co-located BESS to increase self-consumption further.

This model is designed for corporate entities under standard corporate tax regimes and is not suited to sole traders or individuals taxed under personal income tax schedules, where the incentive logic and applicable rates differ materially. It does not model debt financing — the cash flow is equity-based — and is therefore not appropriate as the primary tool for a leveraged project finance analysis. It should not be used as the sole basis for a tax planning decision: the specific incentive treatment depends on the corporate structure, the asset classification and individual circumstances, and must be validated with a qualified tax advisor before any investment decision. It is also not designed for utility-scale projects above 3 MWp, which have different tariff structures, grid connection costs and regulatory frameworks.


0.0 / 5 (0 votes)

please wait...