Originally published: 08/05/2025 08:15
Publication number: ELQ-32288-1
View all versions & Certificate
Publication number: ELQ-32288-1
View all versions & Certificate

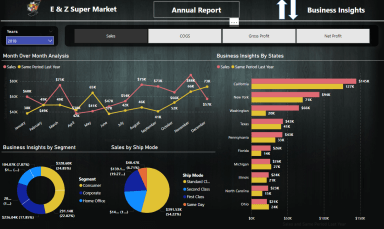
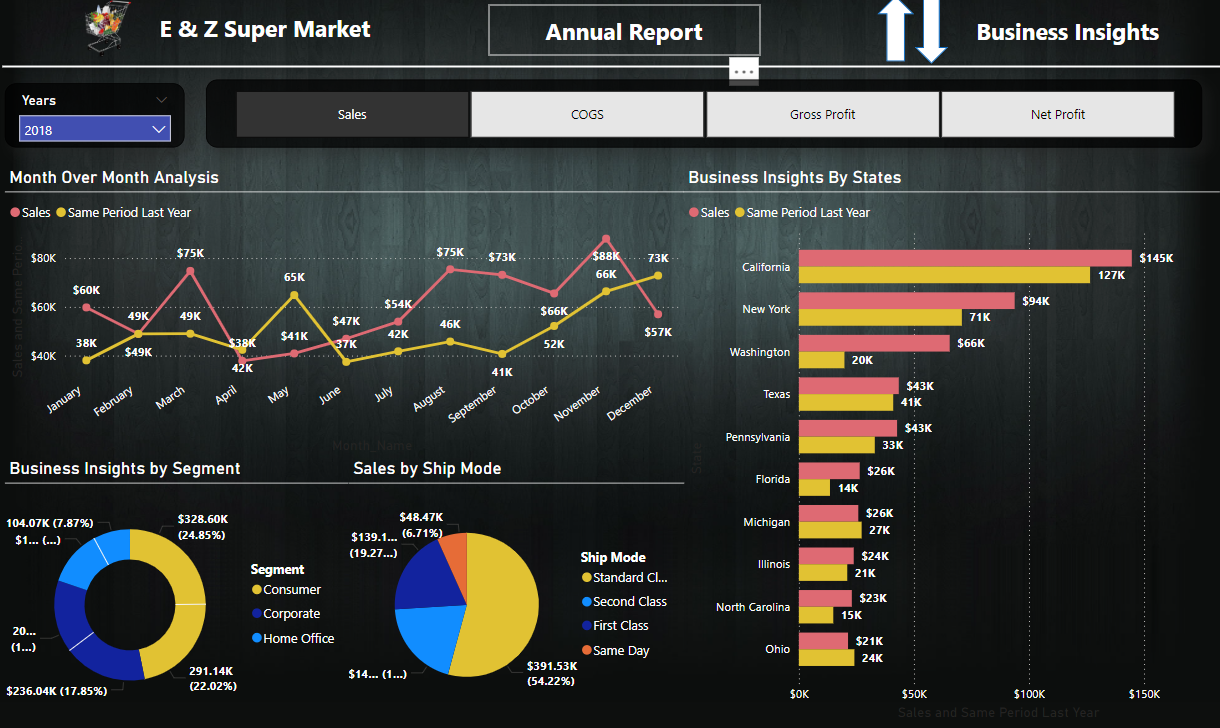
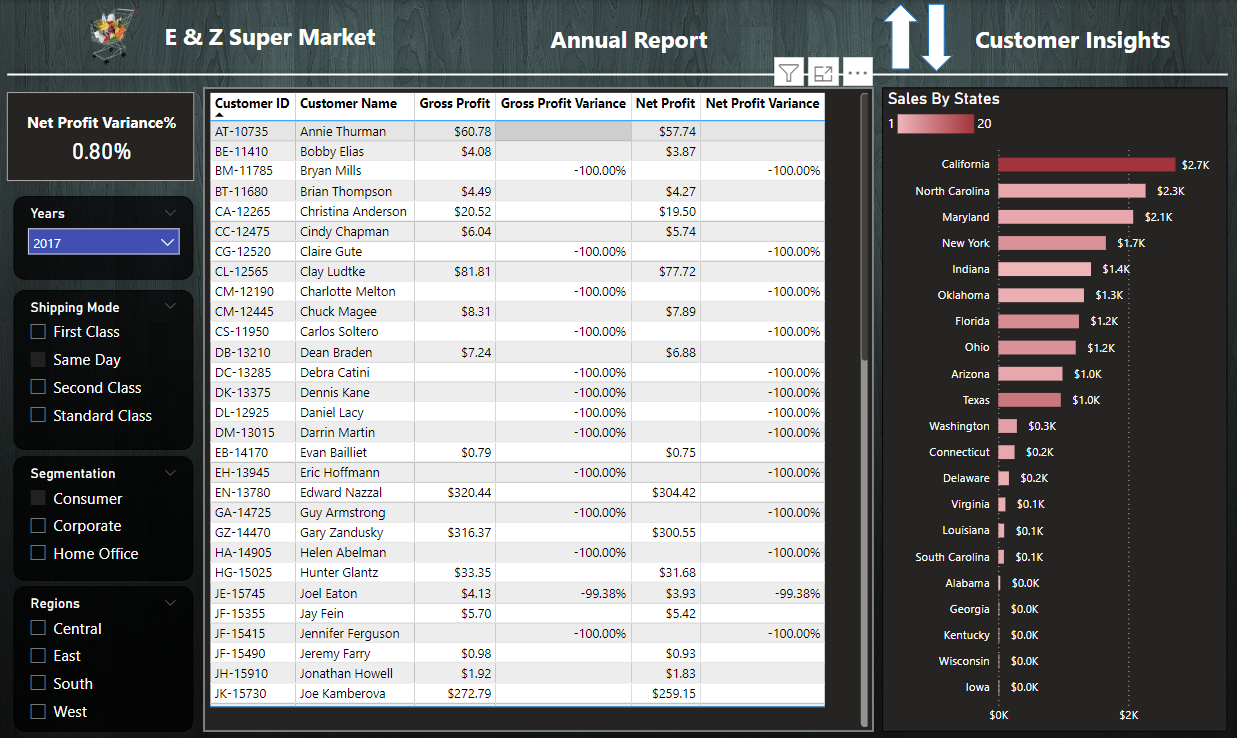
Power BI Dynamic Dashboard Report For Retail Stores
A dynamic Power BI dashboard delivering Key insights into retail store performance, sales trends, and key operational metrics.
Certified Microsoft Excel Expert. Skills on data Visualisation and Excel pivot. Also have strong command on complex excel formula functions.Follow
