
Publication number: ELQ-18369-1
View all versions & Certificate

Electronics Manufacturing Power BI Dashboard — 6 Pages | Production | Sales | Inventory | Maintenance | Energy | Supplie
A complete 6 page interactive Power BI dashboard designed specifically for electronics manufacturing companies.
Further information
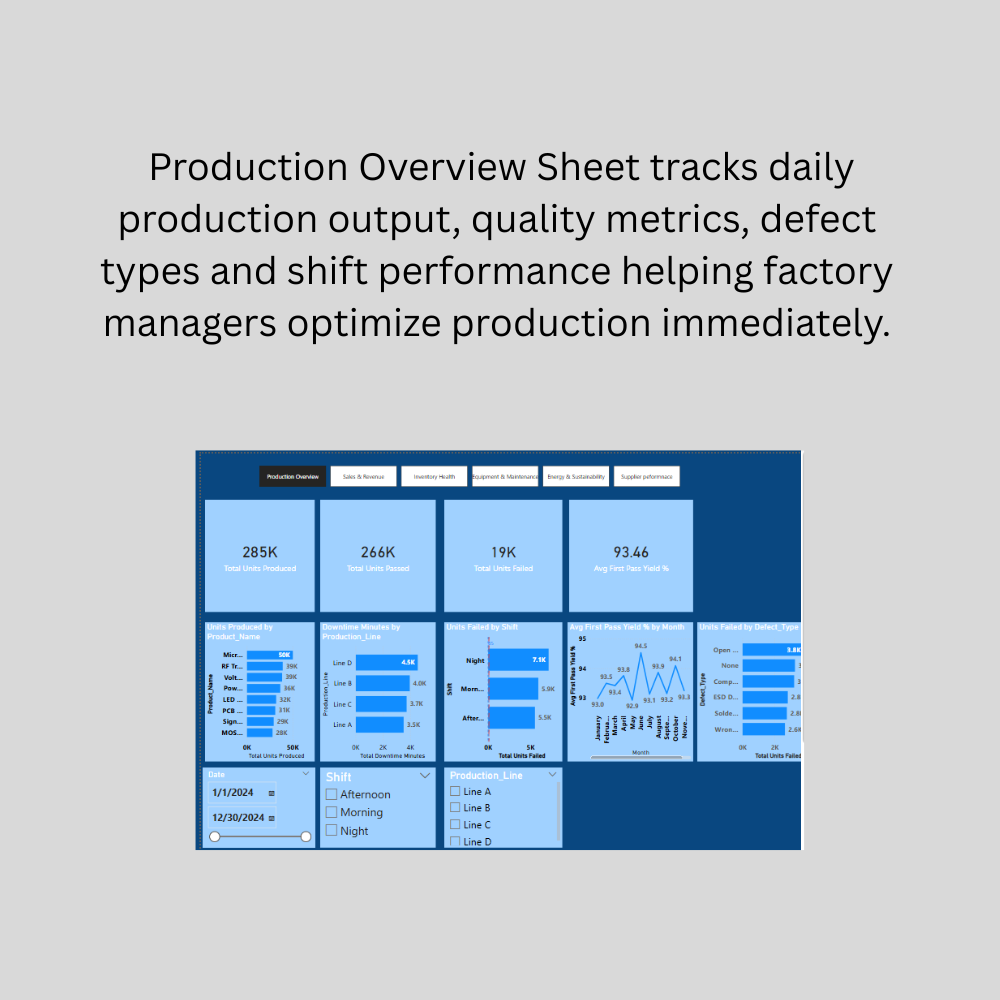
1. PRODUCTION EXCELLENCE
→ Monitor daily production output
→ Identify quality issues immediately
→ Reduce defect rates
→ Improve First Pass Yield %
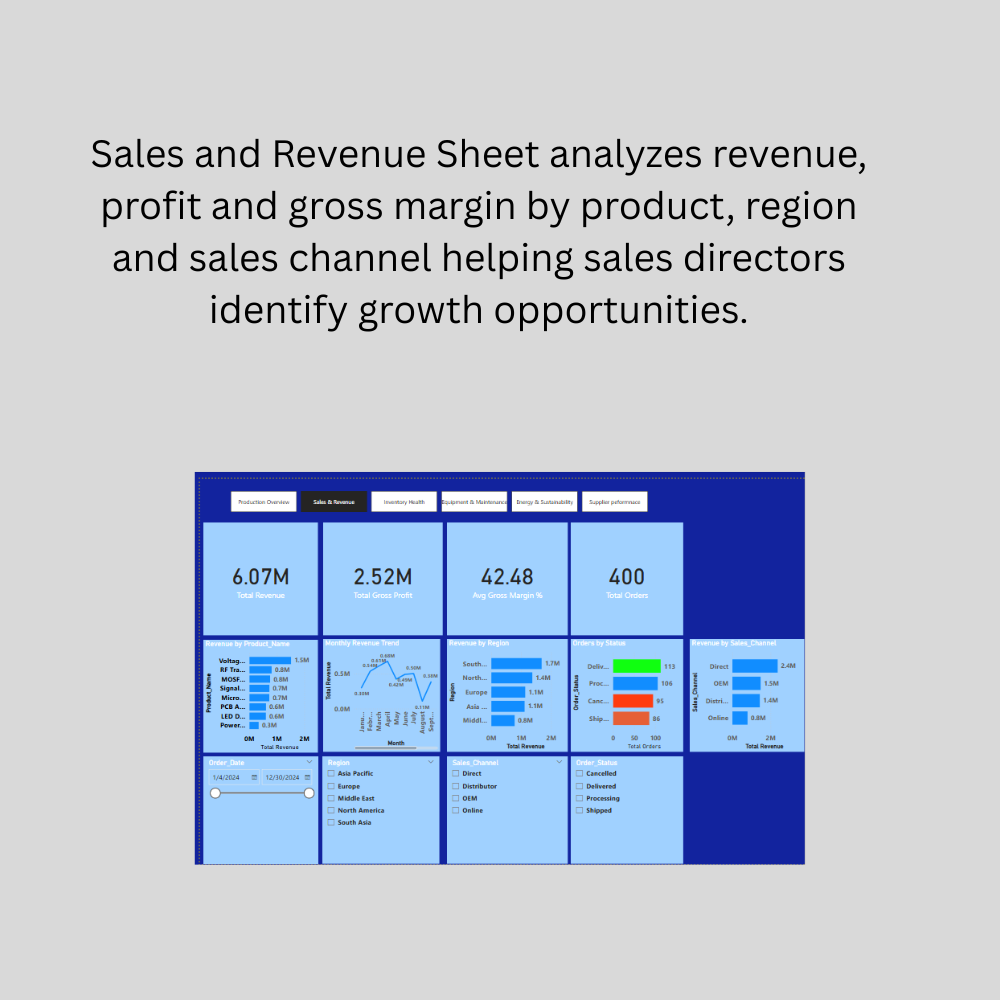
2. REVENUE OPTIMIZATION
→ Track revenue by product and region
→ Identify most profitable channels
→ Reduce order cancellations
→ Maximize gross margin
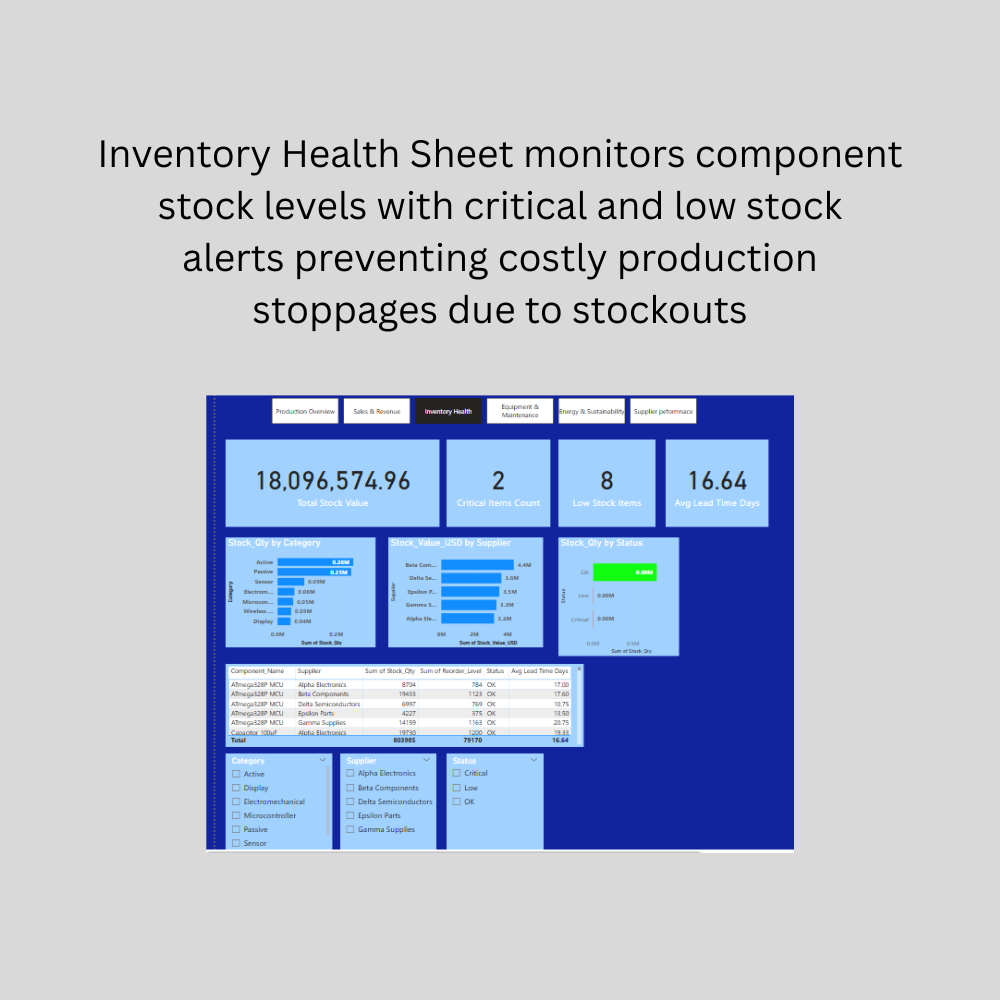
3. INVENTORY CONTROL
→ Prevent production stoppages
→ Optimize stock levels
→ Reduce excess inventory costs
→ Improve supplier lead times
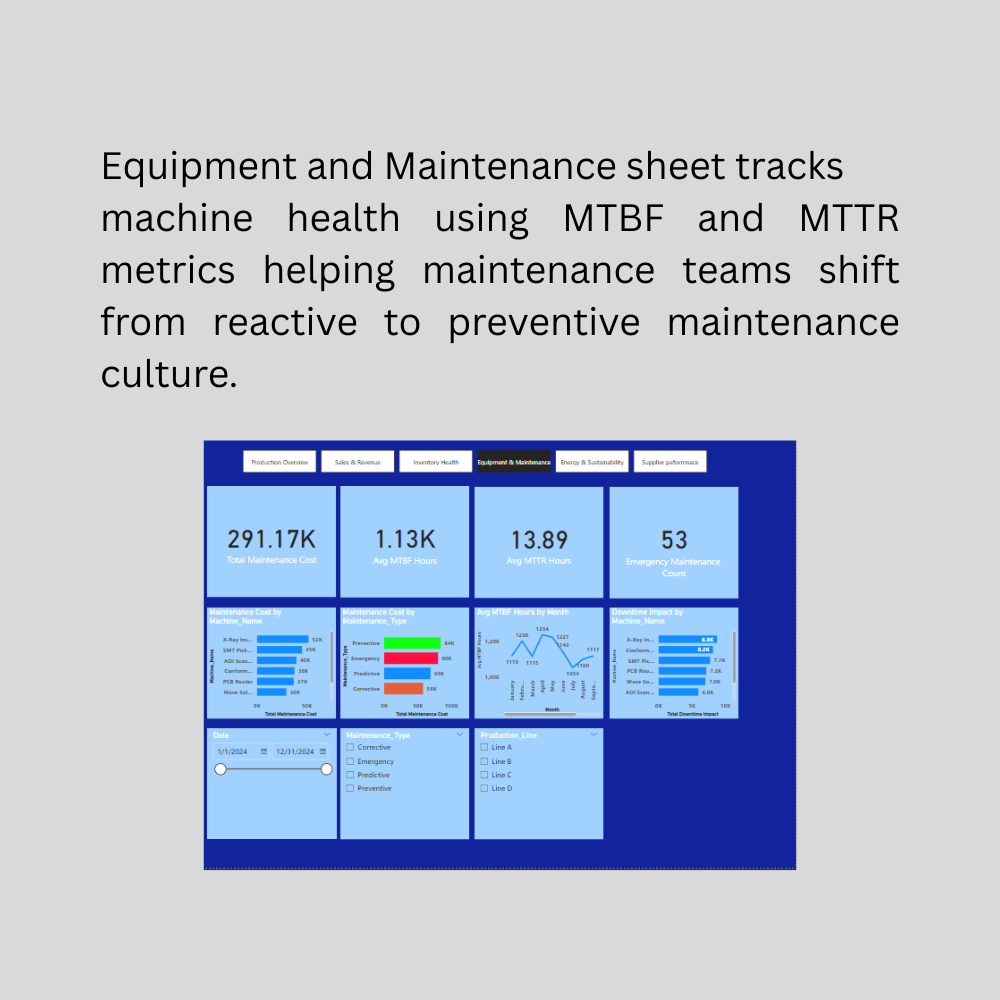
4. MAINTENANCE EFFICIENCY
→ Shift from reactive to preventive
→ Reduce emergency breakdown costs
→ Extend machine life
→ Minimize production downtime
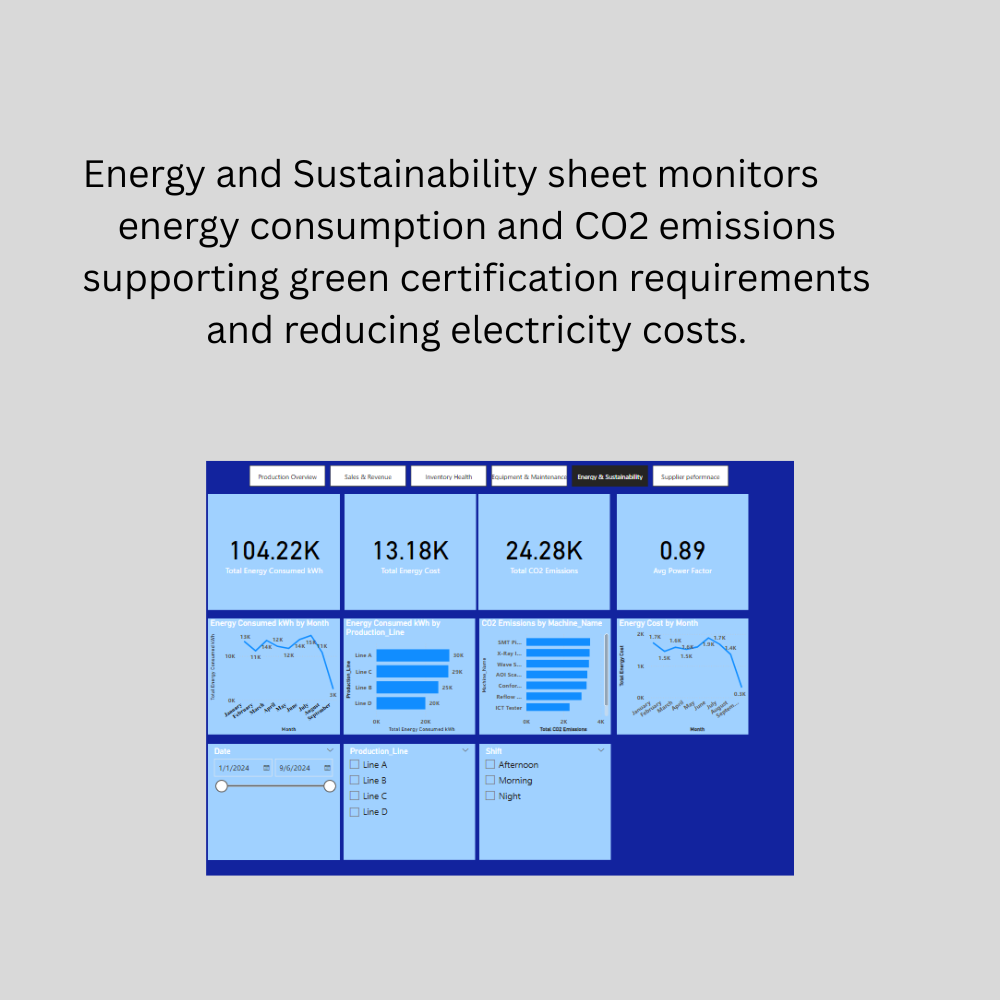
5. ENERGY MANAGEMENT
→ Reduce energy consumption
→ Lower electricity costs
→ Reduce CO2 emissions
→ Achieve green certification
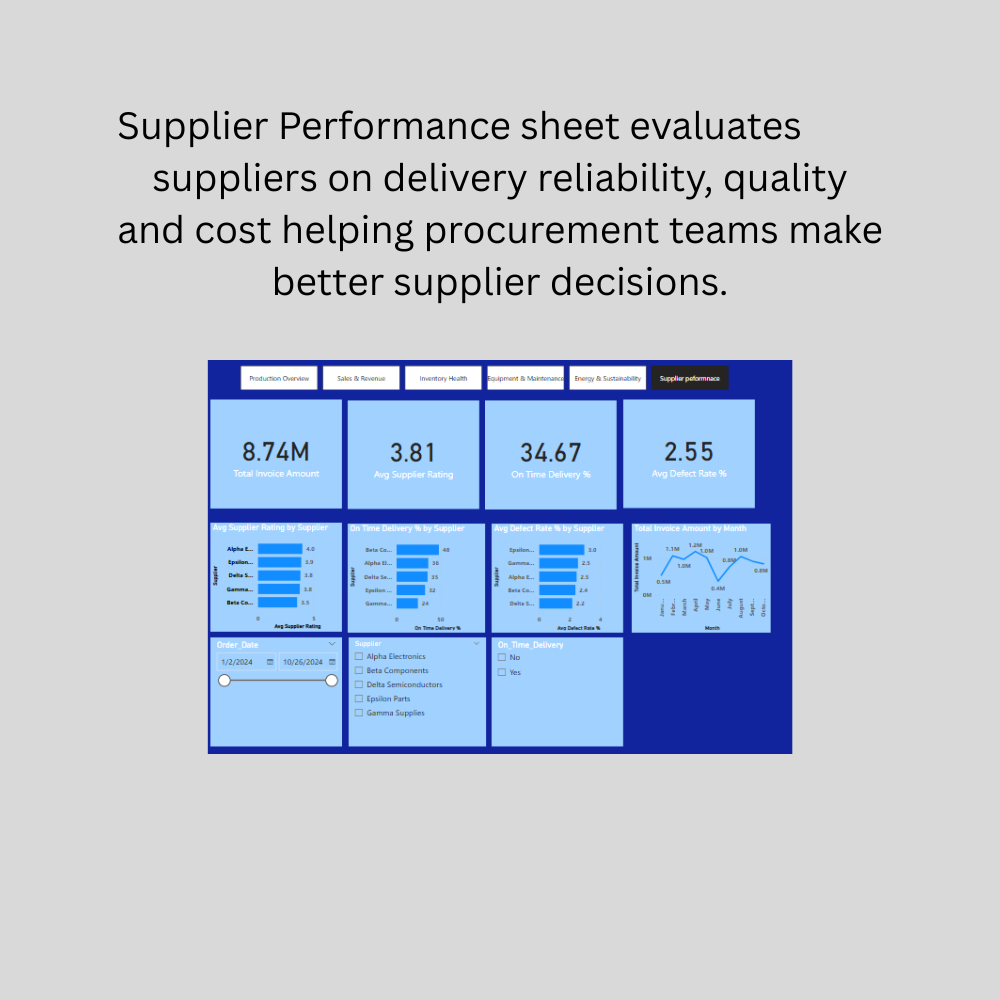
6. SUPPLIER EXCELLENCE
→ Improve on time delivery rates
→ Reduce component defect rates
→ Identify best performing suppliers
→ Strengthen supplier relationships
7. DATA DRIVEN CULTURE
→ Replace gut feeling with facts
→ Real time visibility for all
→ Faster decision making
→ Measurable performance improvement
✅ IDEAL FOR:
1. Company Size
→ Small to large electronics
manufacturing companies
→ 1 to multiple production lines
→ 10 to 10,000 employees
2. Industry
→ PCB manufacturing
→ Semiconductor assembly
→ Electronic component production
→ Consumer electronics manufacturing
→ Industrial electronics production
→ Automotive electronics
→ Medical device manufacturing
→ Defence electronics
→ Telecommunications equipment
3. Operations
→ Companies with multiple shifts
→ Multiple production lines
→ Multiple suppliers
→ Export to multiple countries
→ Complex inventory management
4. Technology
→ Using Power BI Desktop or Service
→ Data stored in Excel format
→ Basic data collection in place
→ IT team available for data setup
5. Business Goals
→ Reducing production costs
→ Improving product quality
→ Expanding to new markets
→ Achieving green certification
→ Improving supplier reliability
❌ NOT SUITABLE FOR:
1. Wrong Industry
→ Non manufacturing businesses
→ Service companies
→ Retail businesses
→ Software companies
→ Food and beverage industry
(different KPIs needed)
2. Wrong Technology
→ Companies not using Power BI
→ No Power BI Desktop installed
→ Data not in Excel format
→ No data collection system
→ Fully paper based operations
3. Wrong Scale
→ Single person operations
→ Companies with no production lines
→ Companies with single supplier only
→ No shift based operations
4. Wrong Data Maturity
→ Companies collecting no data
→ No measurement of production
→ No supplier records maintained
→ No inventory tracking system
→ No maintenance records
5. Wrong Expectations
→ Real time IoT sensor integration
(requires additional setup)
→ Automatic data refresh
(requires Power BI Service)
→ Mobile app without
Power BI Service subscription
→ Integration with ERP systems
without additional development
6. Geographic Limitations
→ Companies in regions where
Power BI Service unavailable
→ Companies with strict data
sovereignty requirements
preventing cloud usage
