
Originally published: 02/07/2018 14:49
Last version published: 03/07/2018 07:48
Publication number: ELQ-55798-2
View all versions & Certificate
Last version published: 03/07/2018 07:48
Publication number: ELQ-55798-2
View all versions & Certificate

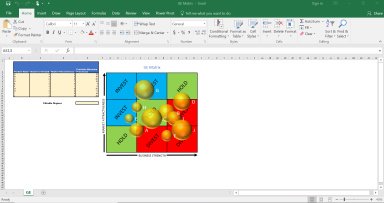
GE Matrix Excel Model - 10 Portfolio Elements Auto Charting
The GE matrix helps a strategic business unit evaluate its overall strength.
Further information
Evaluate portfolio
large companies
smaller companies
