
Originally published: 29/08/2022 08:27
Publication number: ELQ-57040-1
View all versions & Certificate
Publication number: ELQ-57040-1
View all versions & Certificate

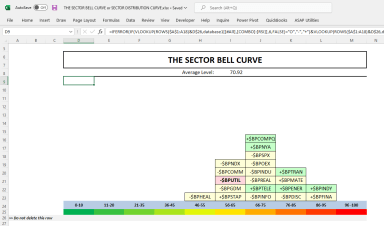
The Sector Bell Curve - DWA Sector Distribution Curve
The Sector Bell Curve - DWA Sector Distribution Curve
Founder & CEO - Excel Basement, Microsoft MVP (Excel) 2025, MCT, MSOM, Excel & POWER BI Trainer & Consultant, MBA (MIS), Emerging Data ScientistFollow 464
