Originally published: 12/12/2022 15:41
Publication number: ELQ-91589-1
View all versions & Certificate
Publication number: ELQ-91589-1
View all versions & Certificate

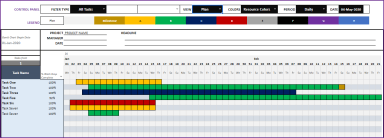
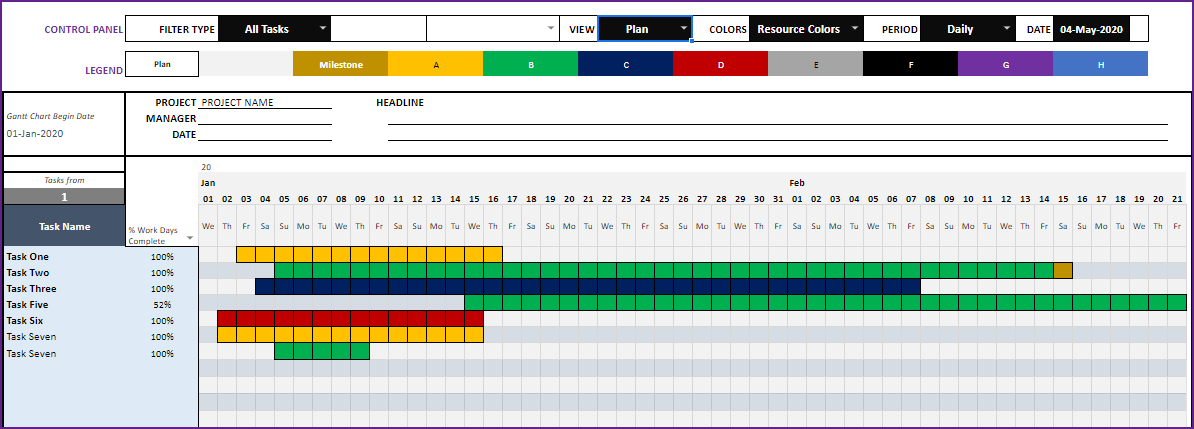
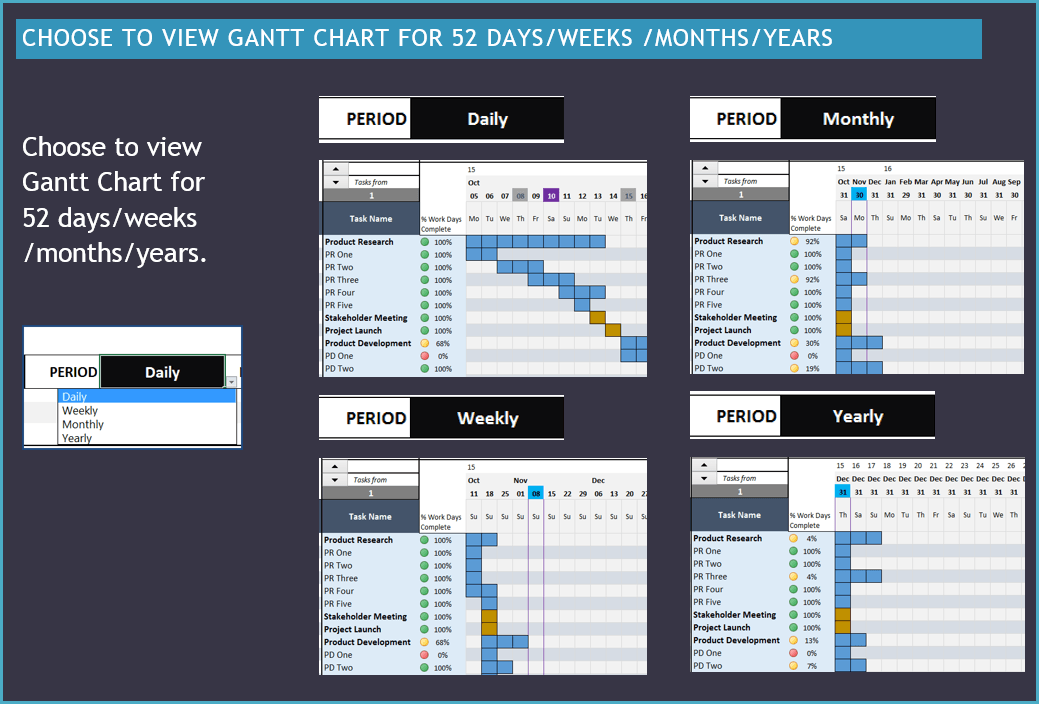
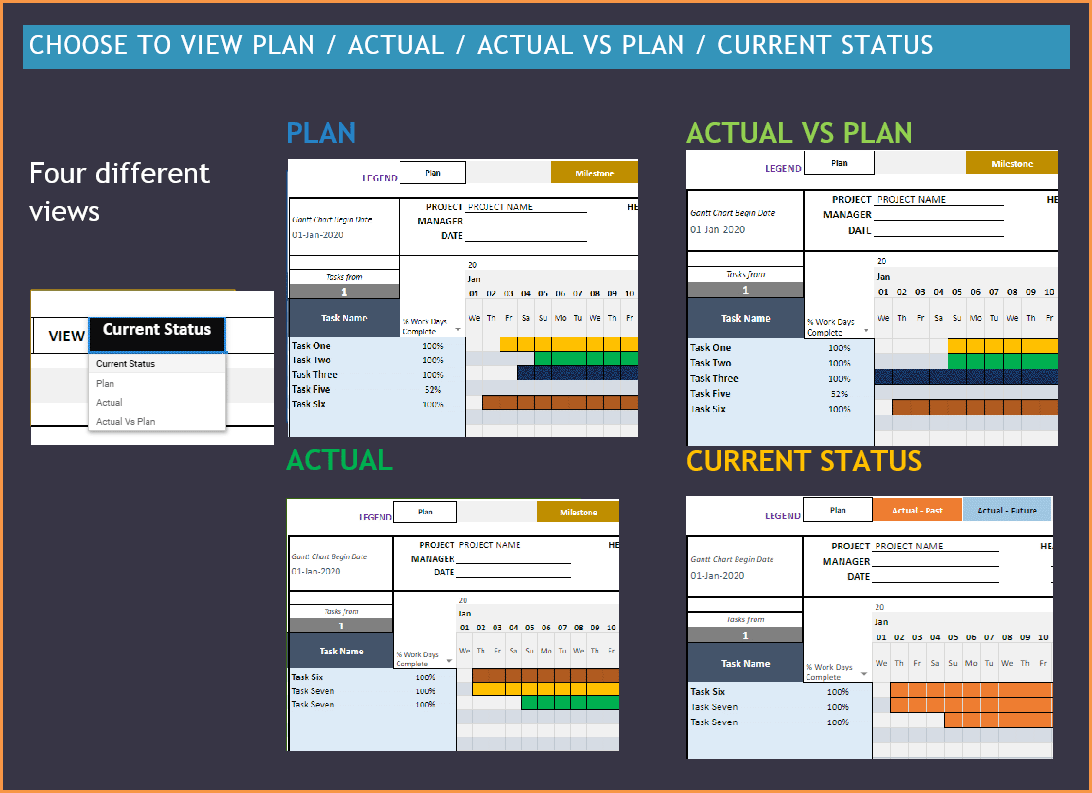
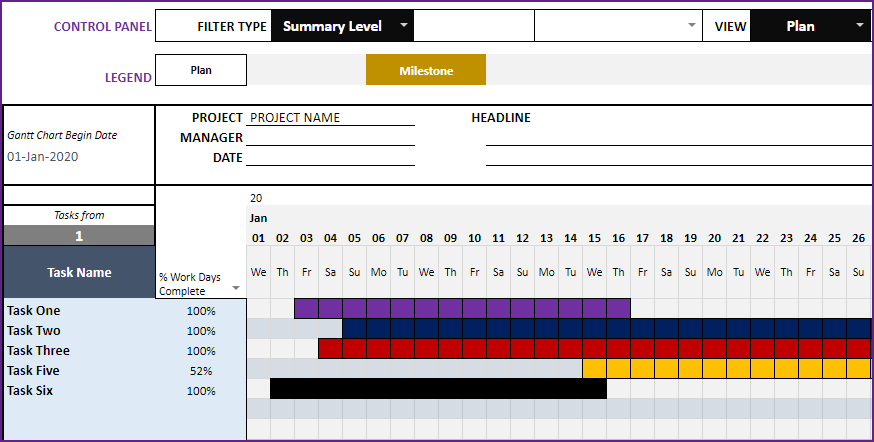
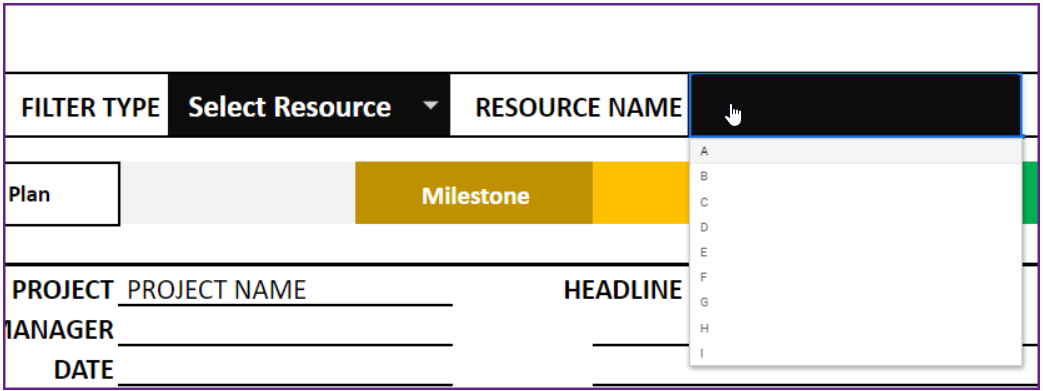
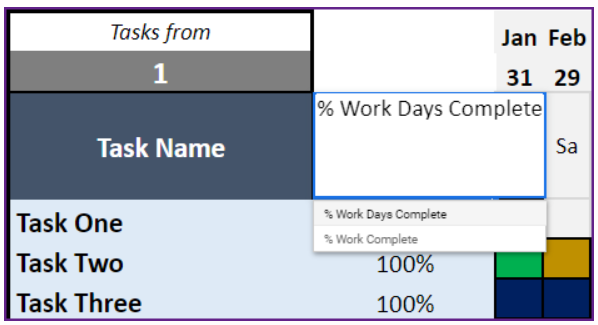
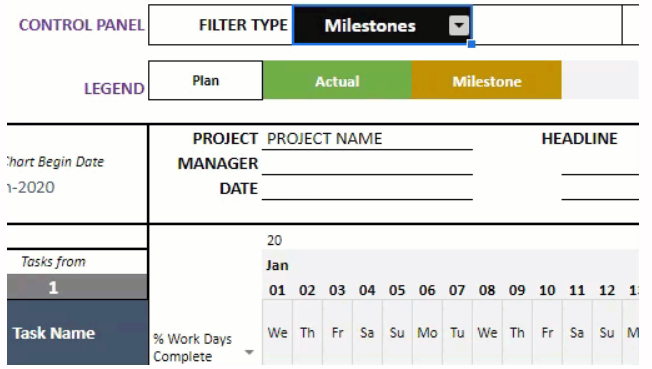
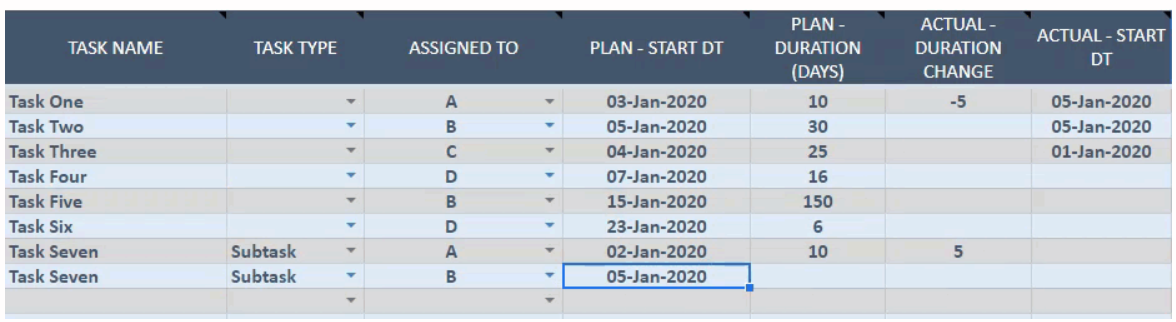
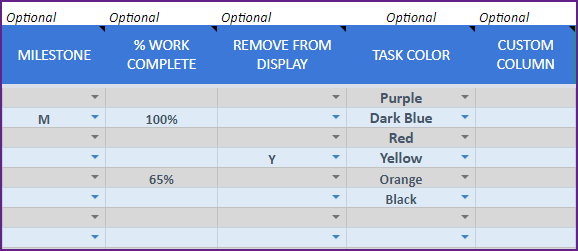
Gantt Chart Maker – Google Sheet Template
Gantt chart is the most common method used to visualize projects. This Google Sheet template allows one to easily create Gantt charts instantly.
