
Originally published: 30/11/2020 09:11
Last version published: 19/07/2022 10:20
Publication number: ELQ-81714-5
View all versions & Certificate
Last version published: 19/07/2022 10:20
Publication number: ELQ-81714-5
View all versions & Certificate

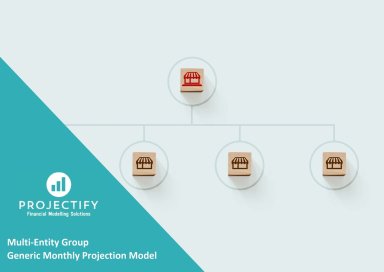
Multi-Entity Group Generic Monthly 5-Year 3 Statement Rolling Financial Projection Model
User-friendly 3 statement 5 year rolling financial projection Excel model for Group with 4 entities (incl TopCo)
Description
PURPOSE OF MODEL
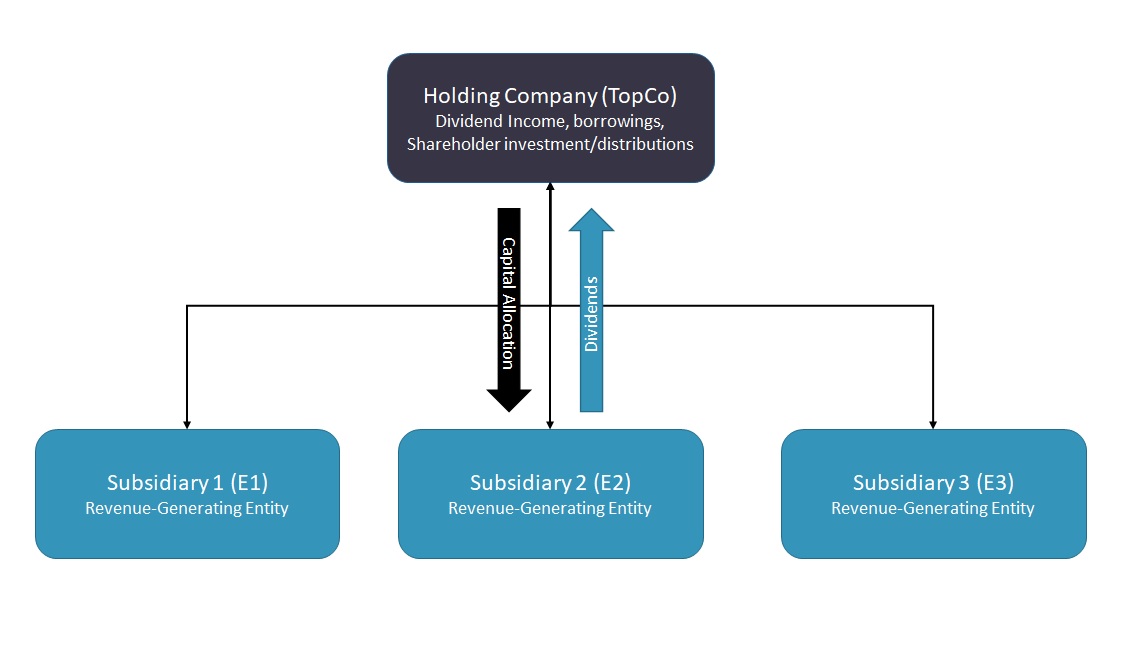
Highly versatile and user-friendly Excel model for the preparation a of 5-year rolling 3 statement (Income Statement, Balance Sheet and Cash flow Statement) financial projection with a monthly timeline for a generic new or existing Group of businesses consisting of up to 3 revenue-generating subsidiaries and 1 holding company (TopCo). The model also incorporates a discounted cash flow valuation calculation using the projected cash flows.
The model allows the user to project up to 10 revenue streams across 3 revenue-generating entities with variable costs categories for each revenue stream as well as marketing costs, staff costs, other operating costs, fixed assets and borrowings.
The model allows user to model capital allocations from TopCo to sub-entities and dividend distributions from sub-entities to TopCo. The model also presents aggregated Group projected financial statements eliminating intra-group transfers of dividends and capital.
The model follows good practice financial modelling principles and includes instructions, line item explanations, checks and input validations.
KEY OUTPUTS
The model is generic and not industry-specific. The key outputs include:
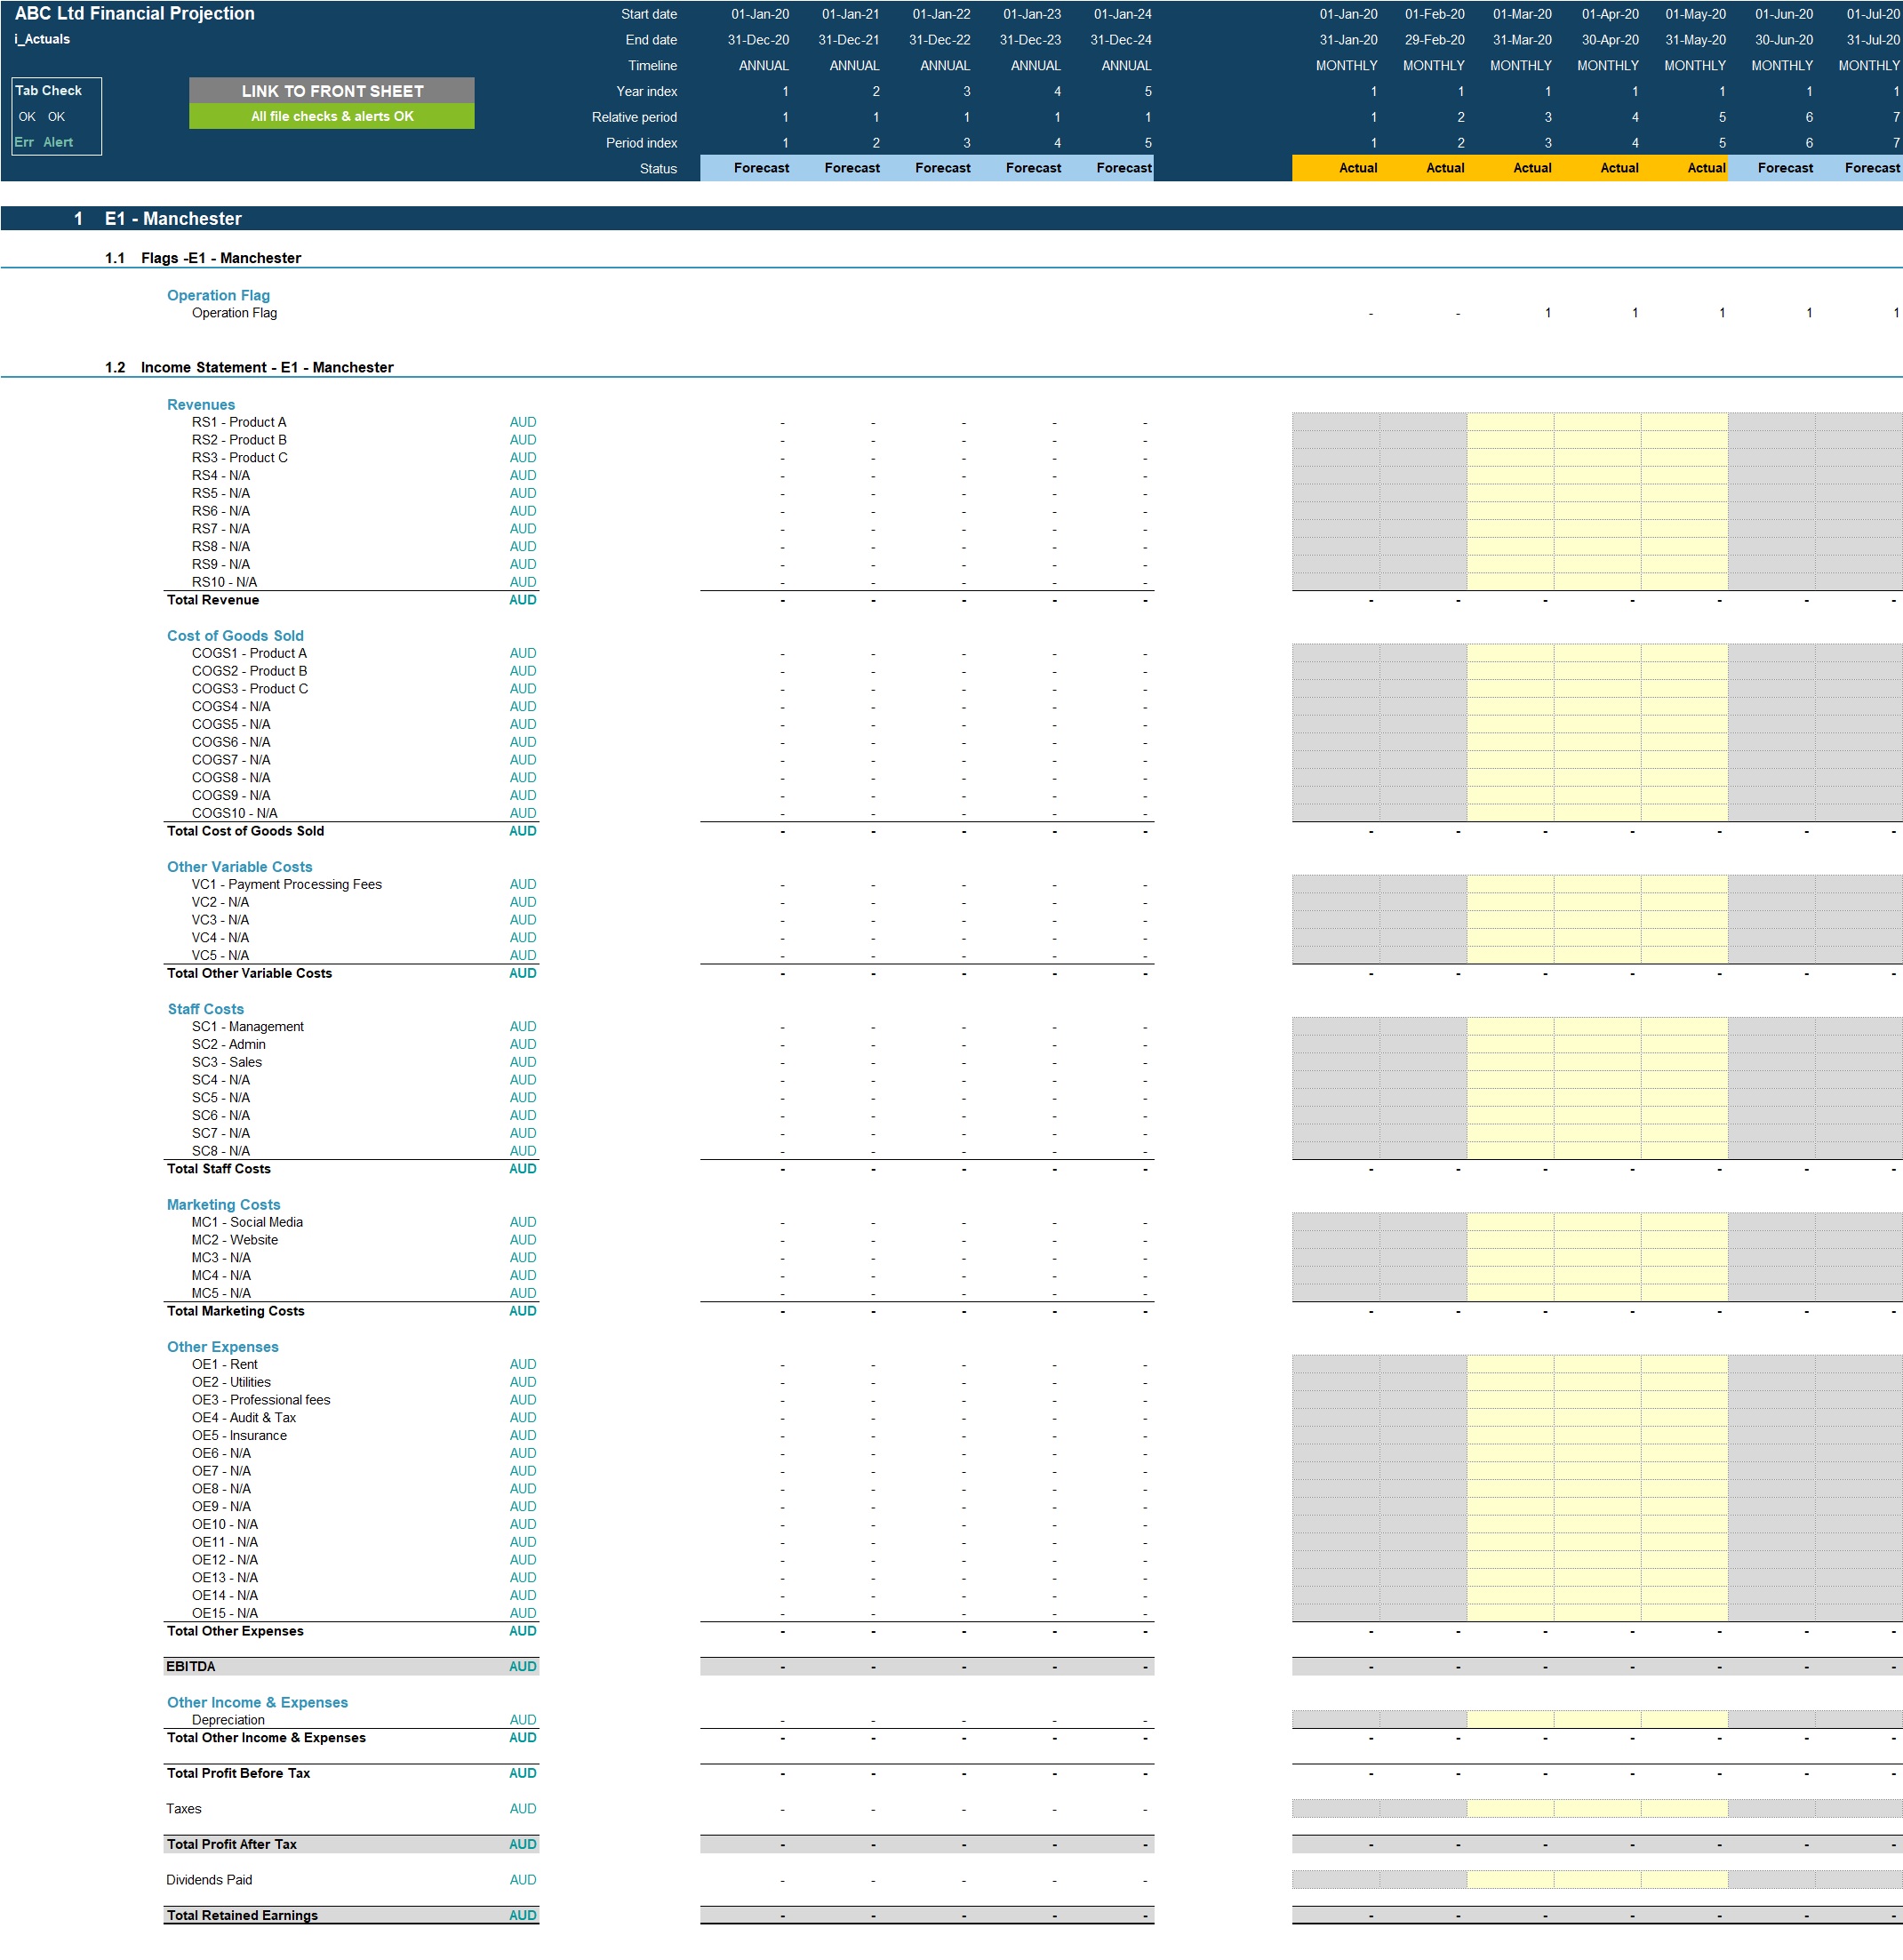
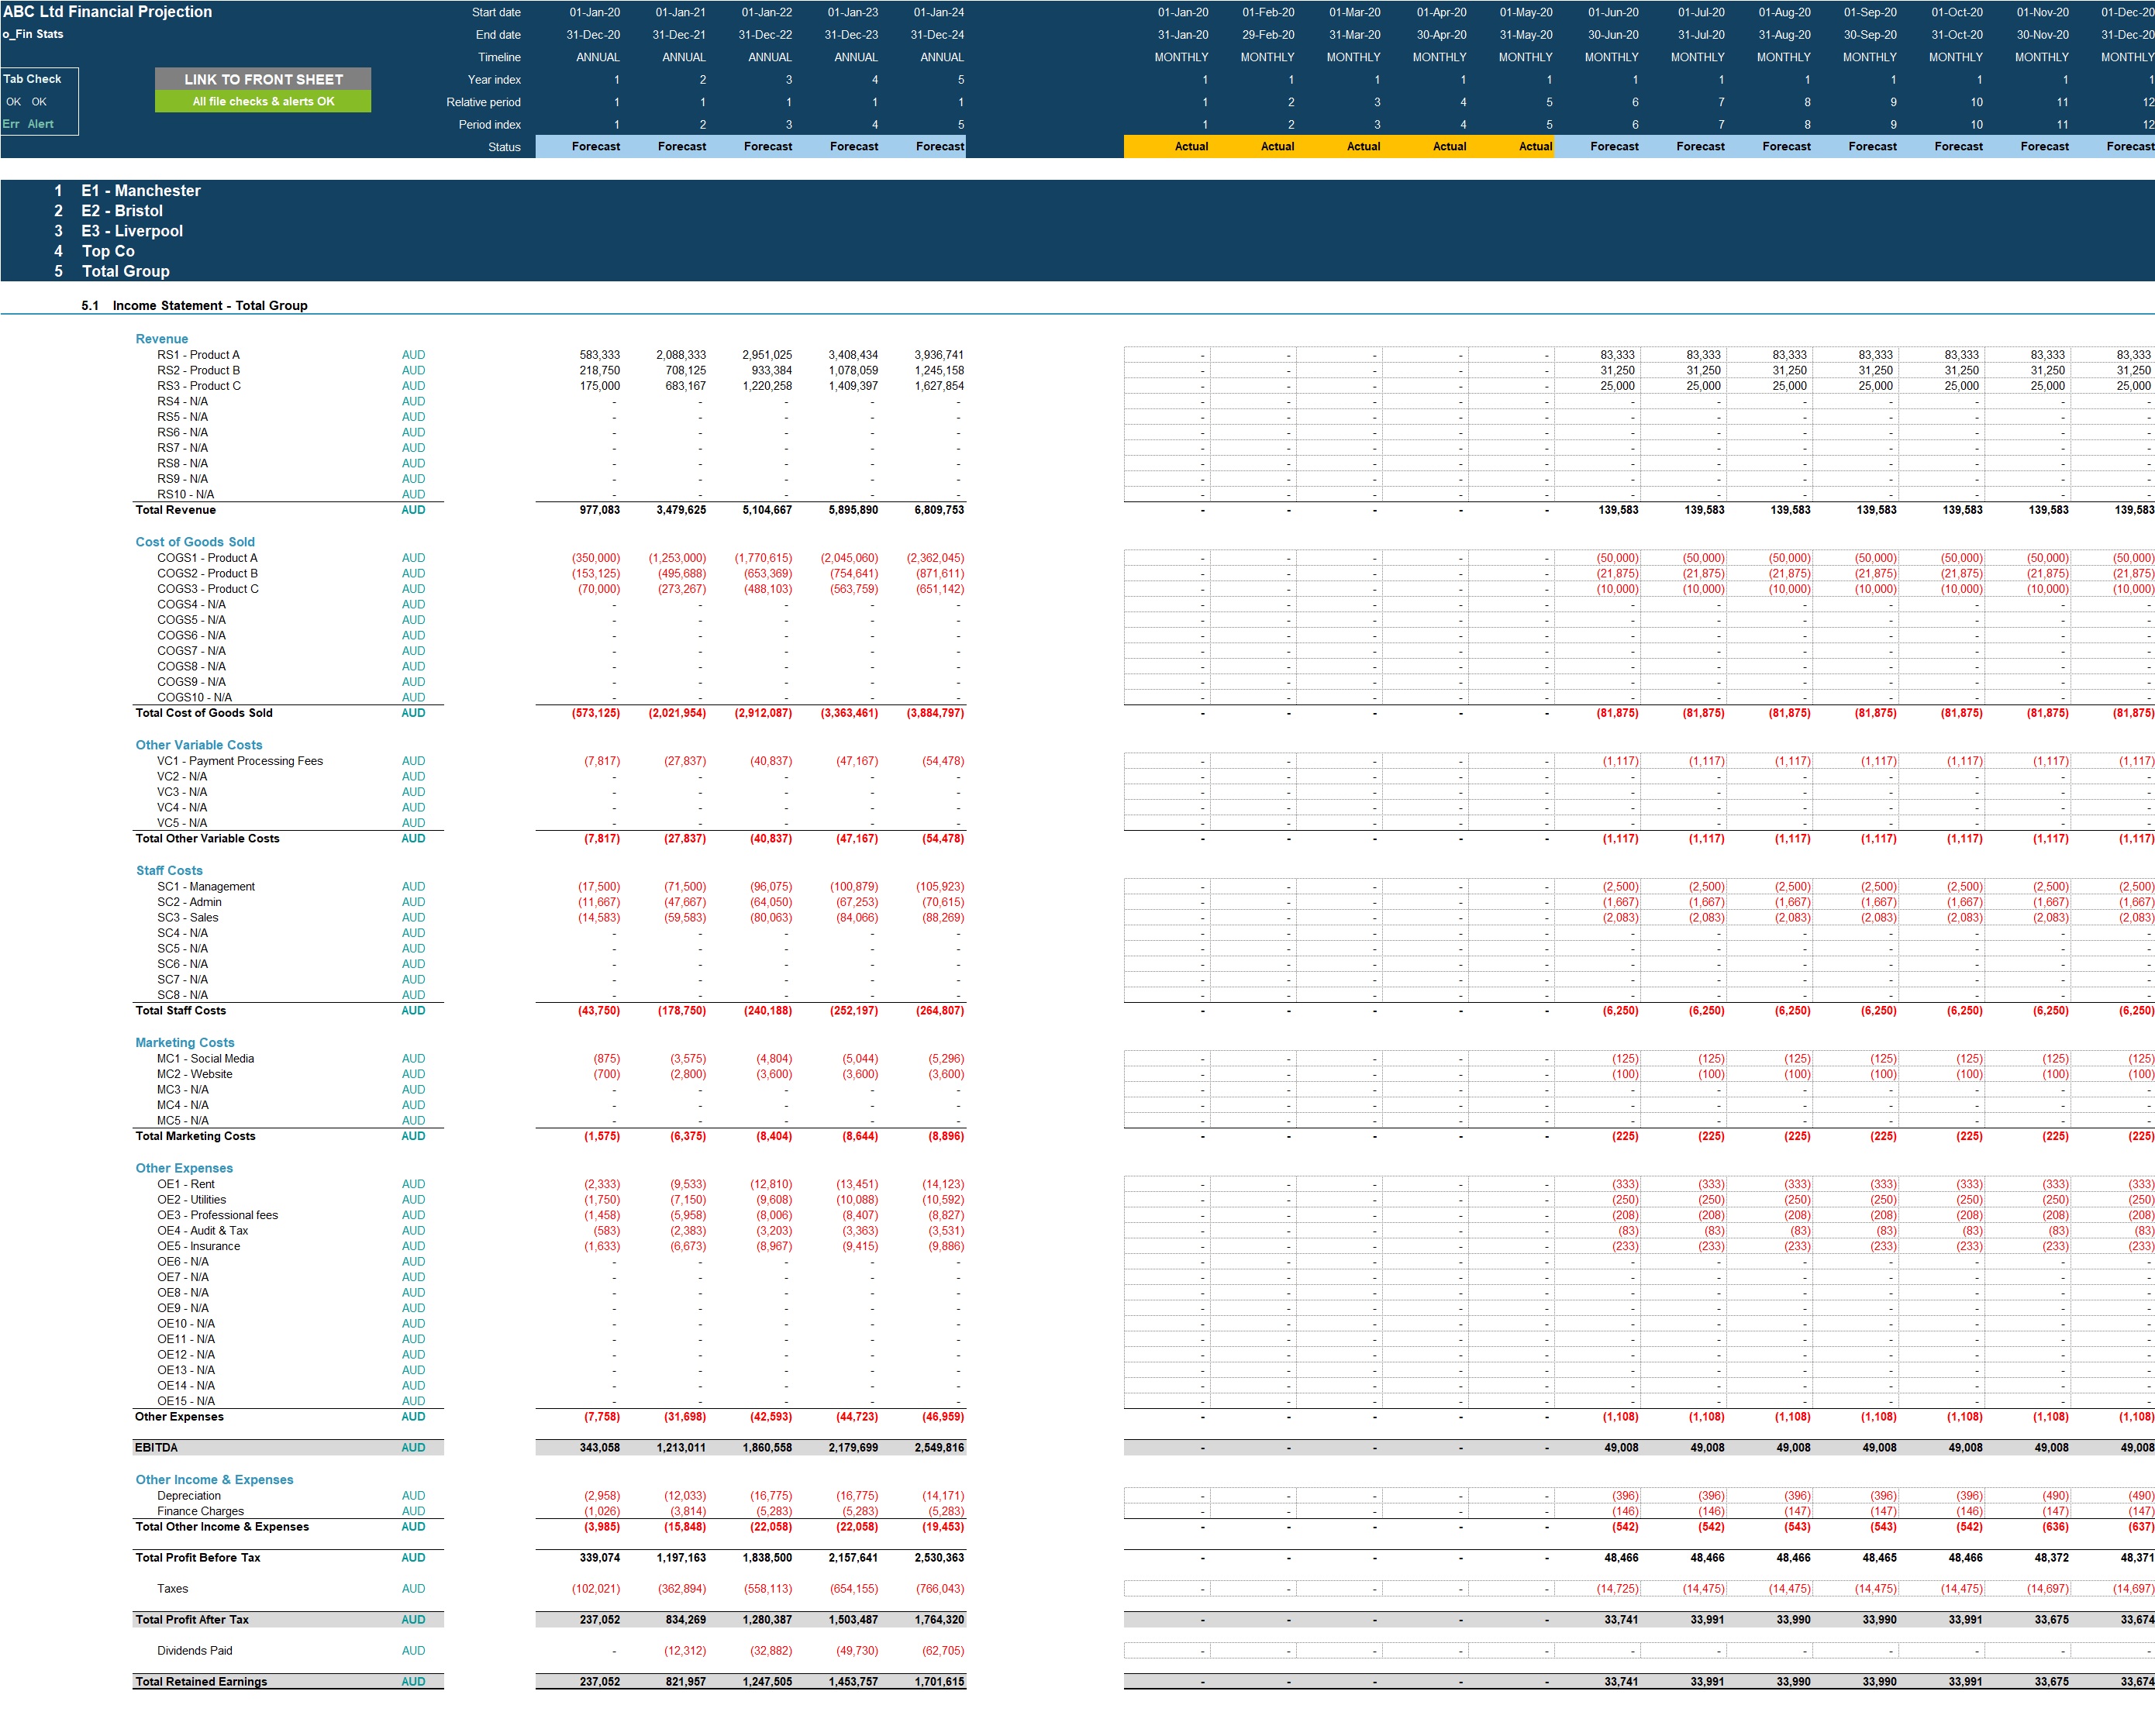
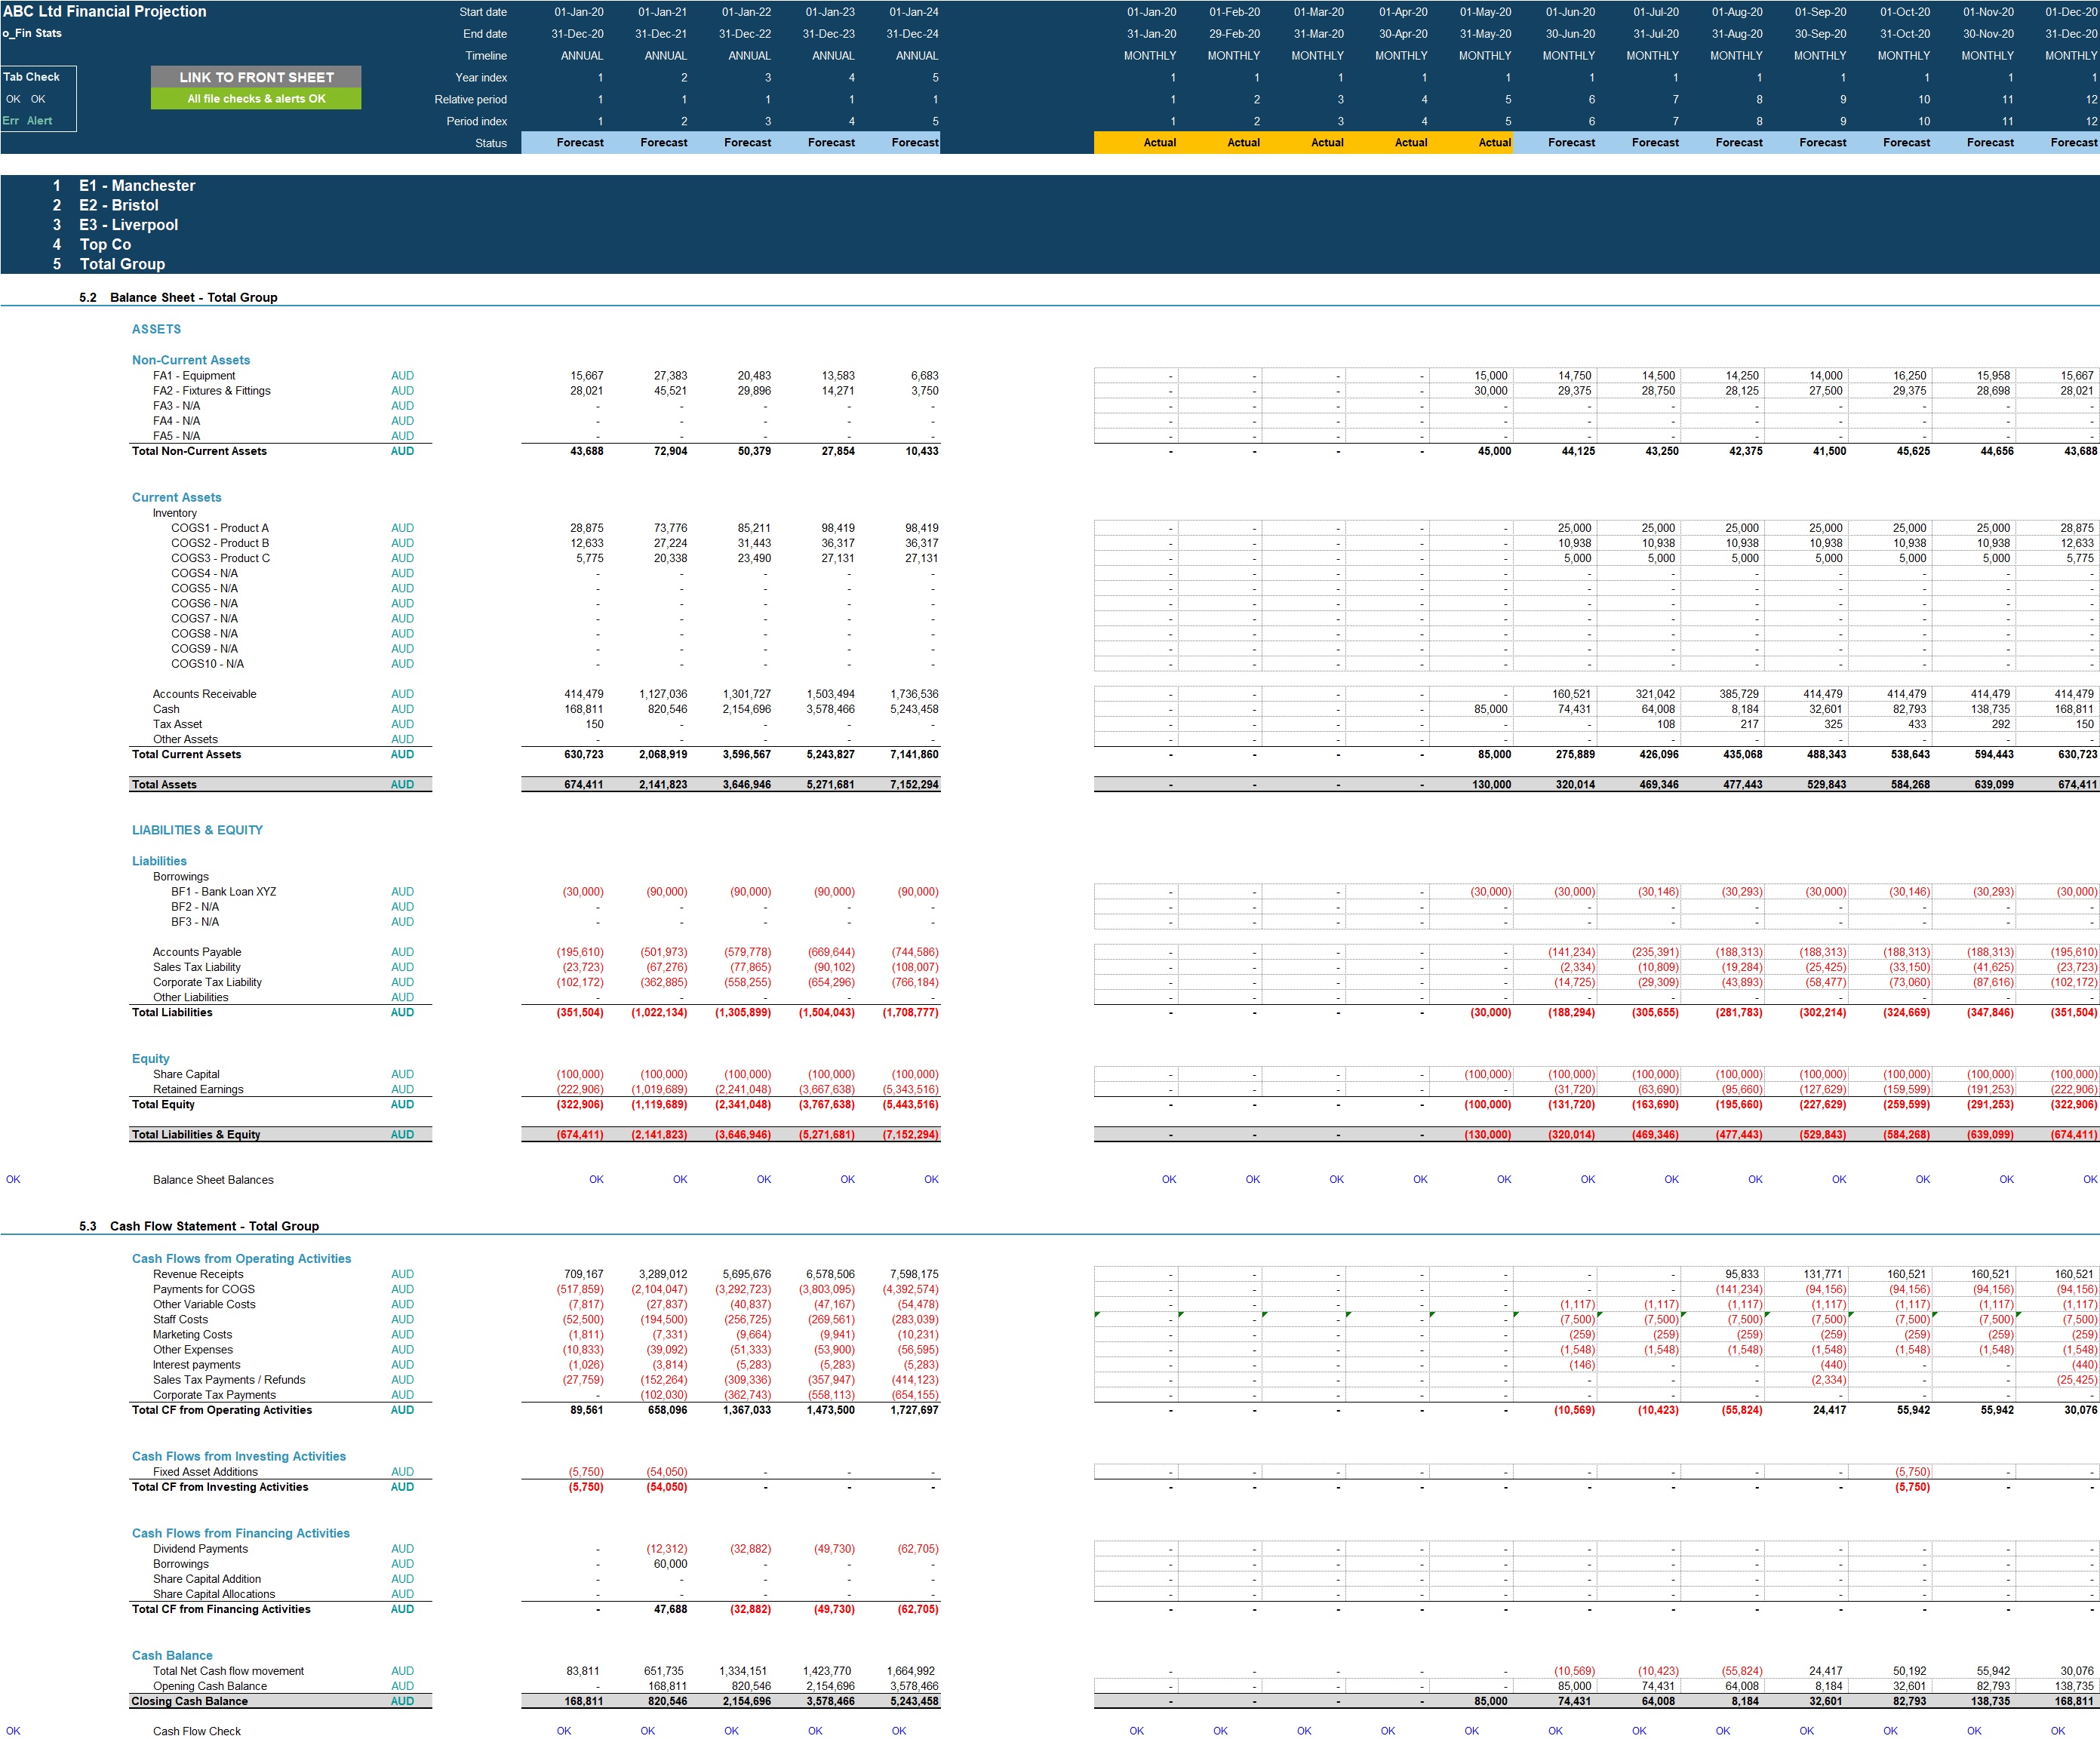
- Projected full financial statements (Income Statement, Balance Sheet and Cash flow Statement) for each of the 4 entities, presented on a monthly basis across up to 5 years and summarised on an annual basis.
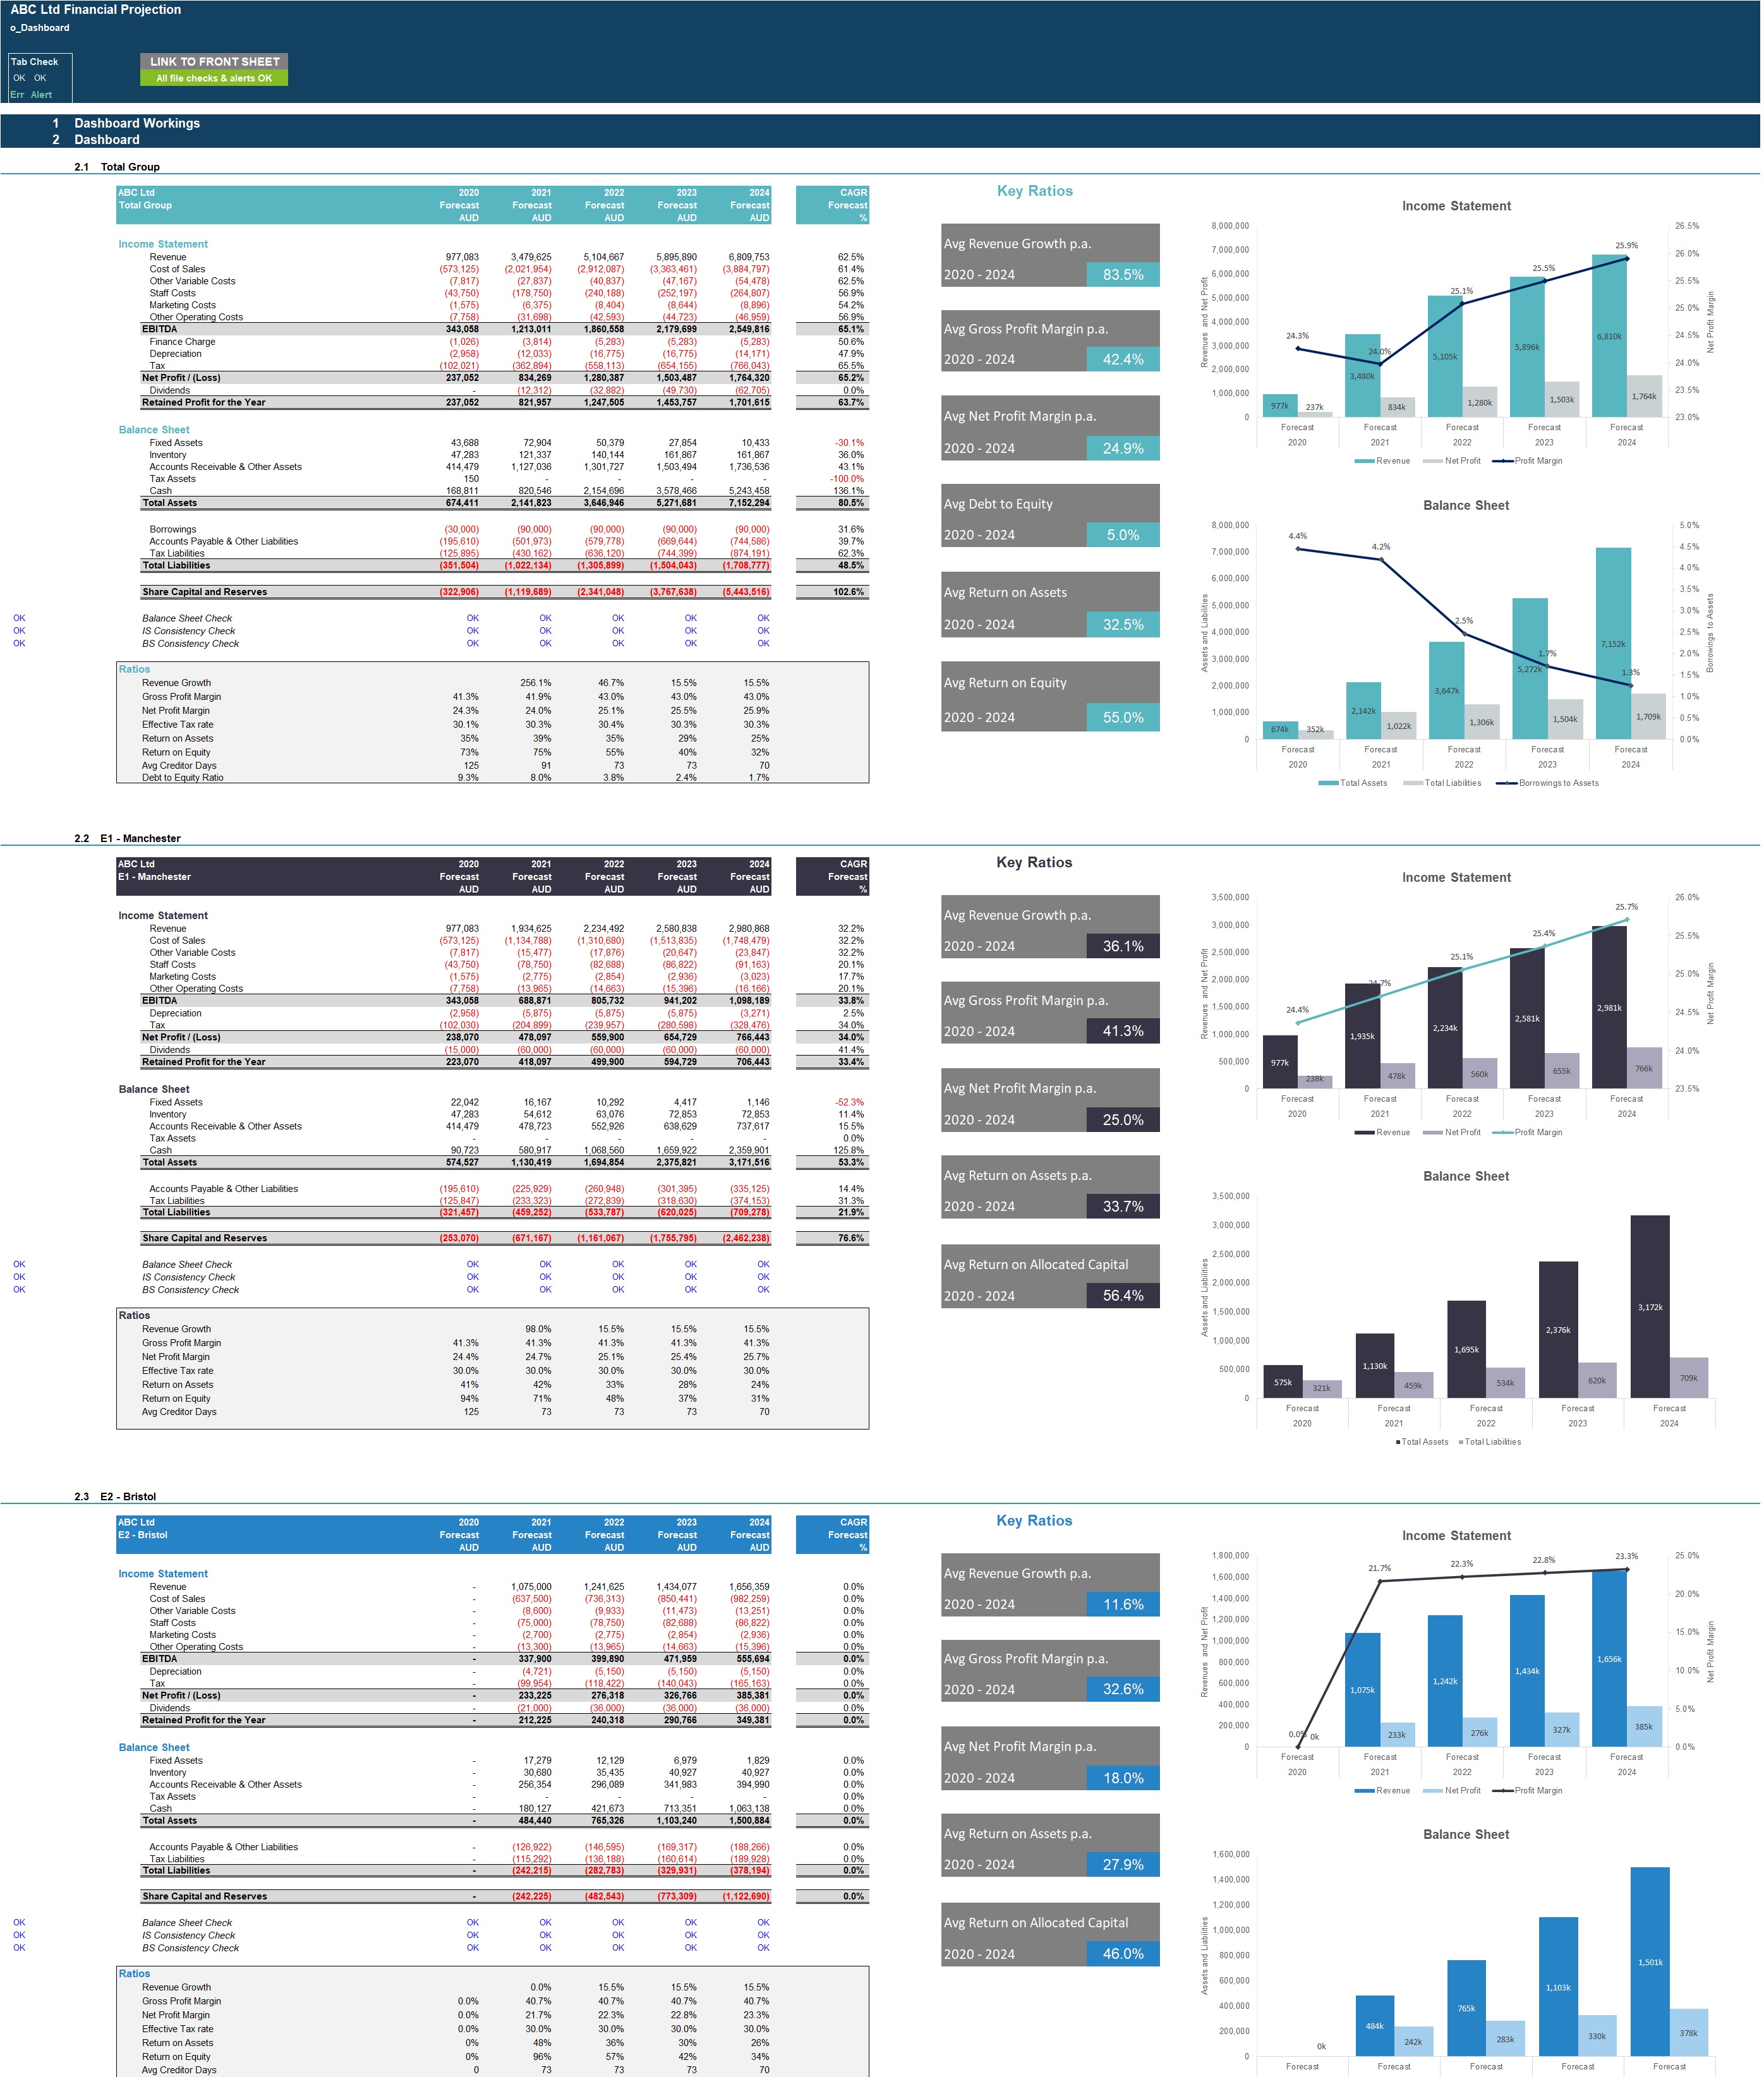
- Dashboard with:
o Summarised projected Income Statement and Balance Sheet for each of the 4 entities plus aggregated group view
o Compounded Annual Growth rate (CAGR) for each summarised income statement and Balance Sheet line item for each of the 4 entities
o List of key ratios including Average revenue growth, Average profit margins, Average return on assets and equity and Average Debt to Equity ratio.
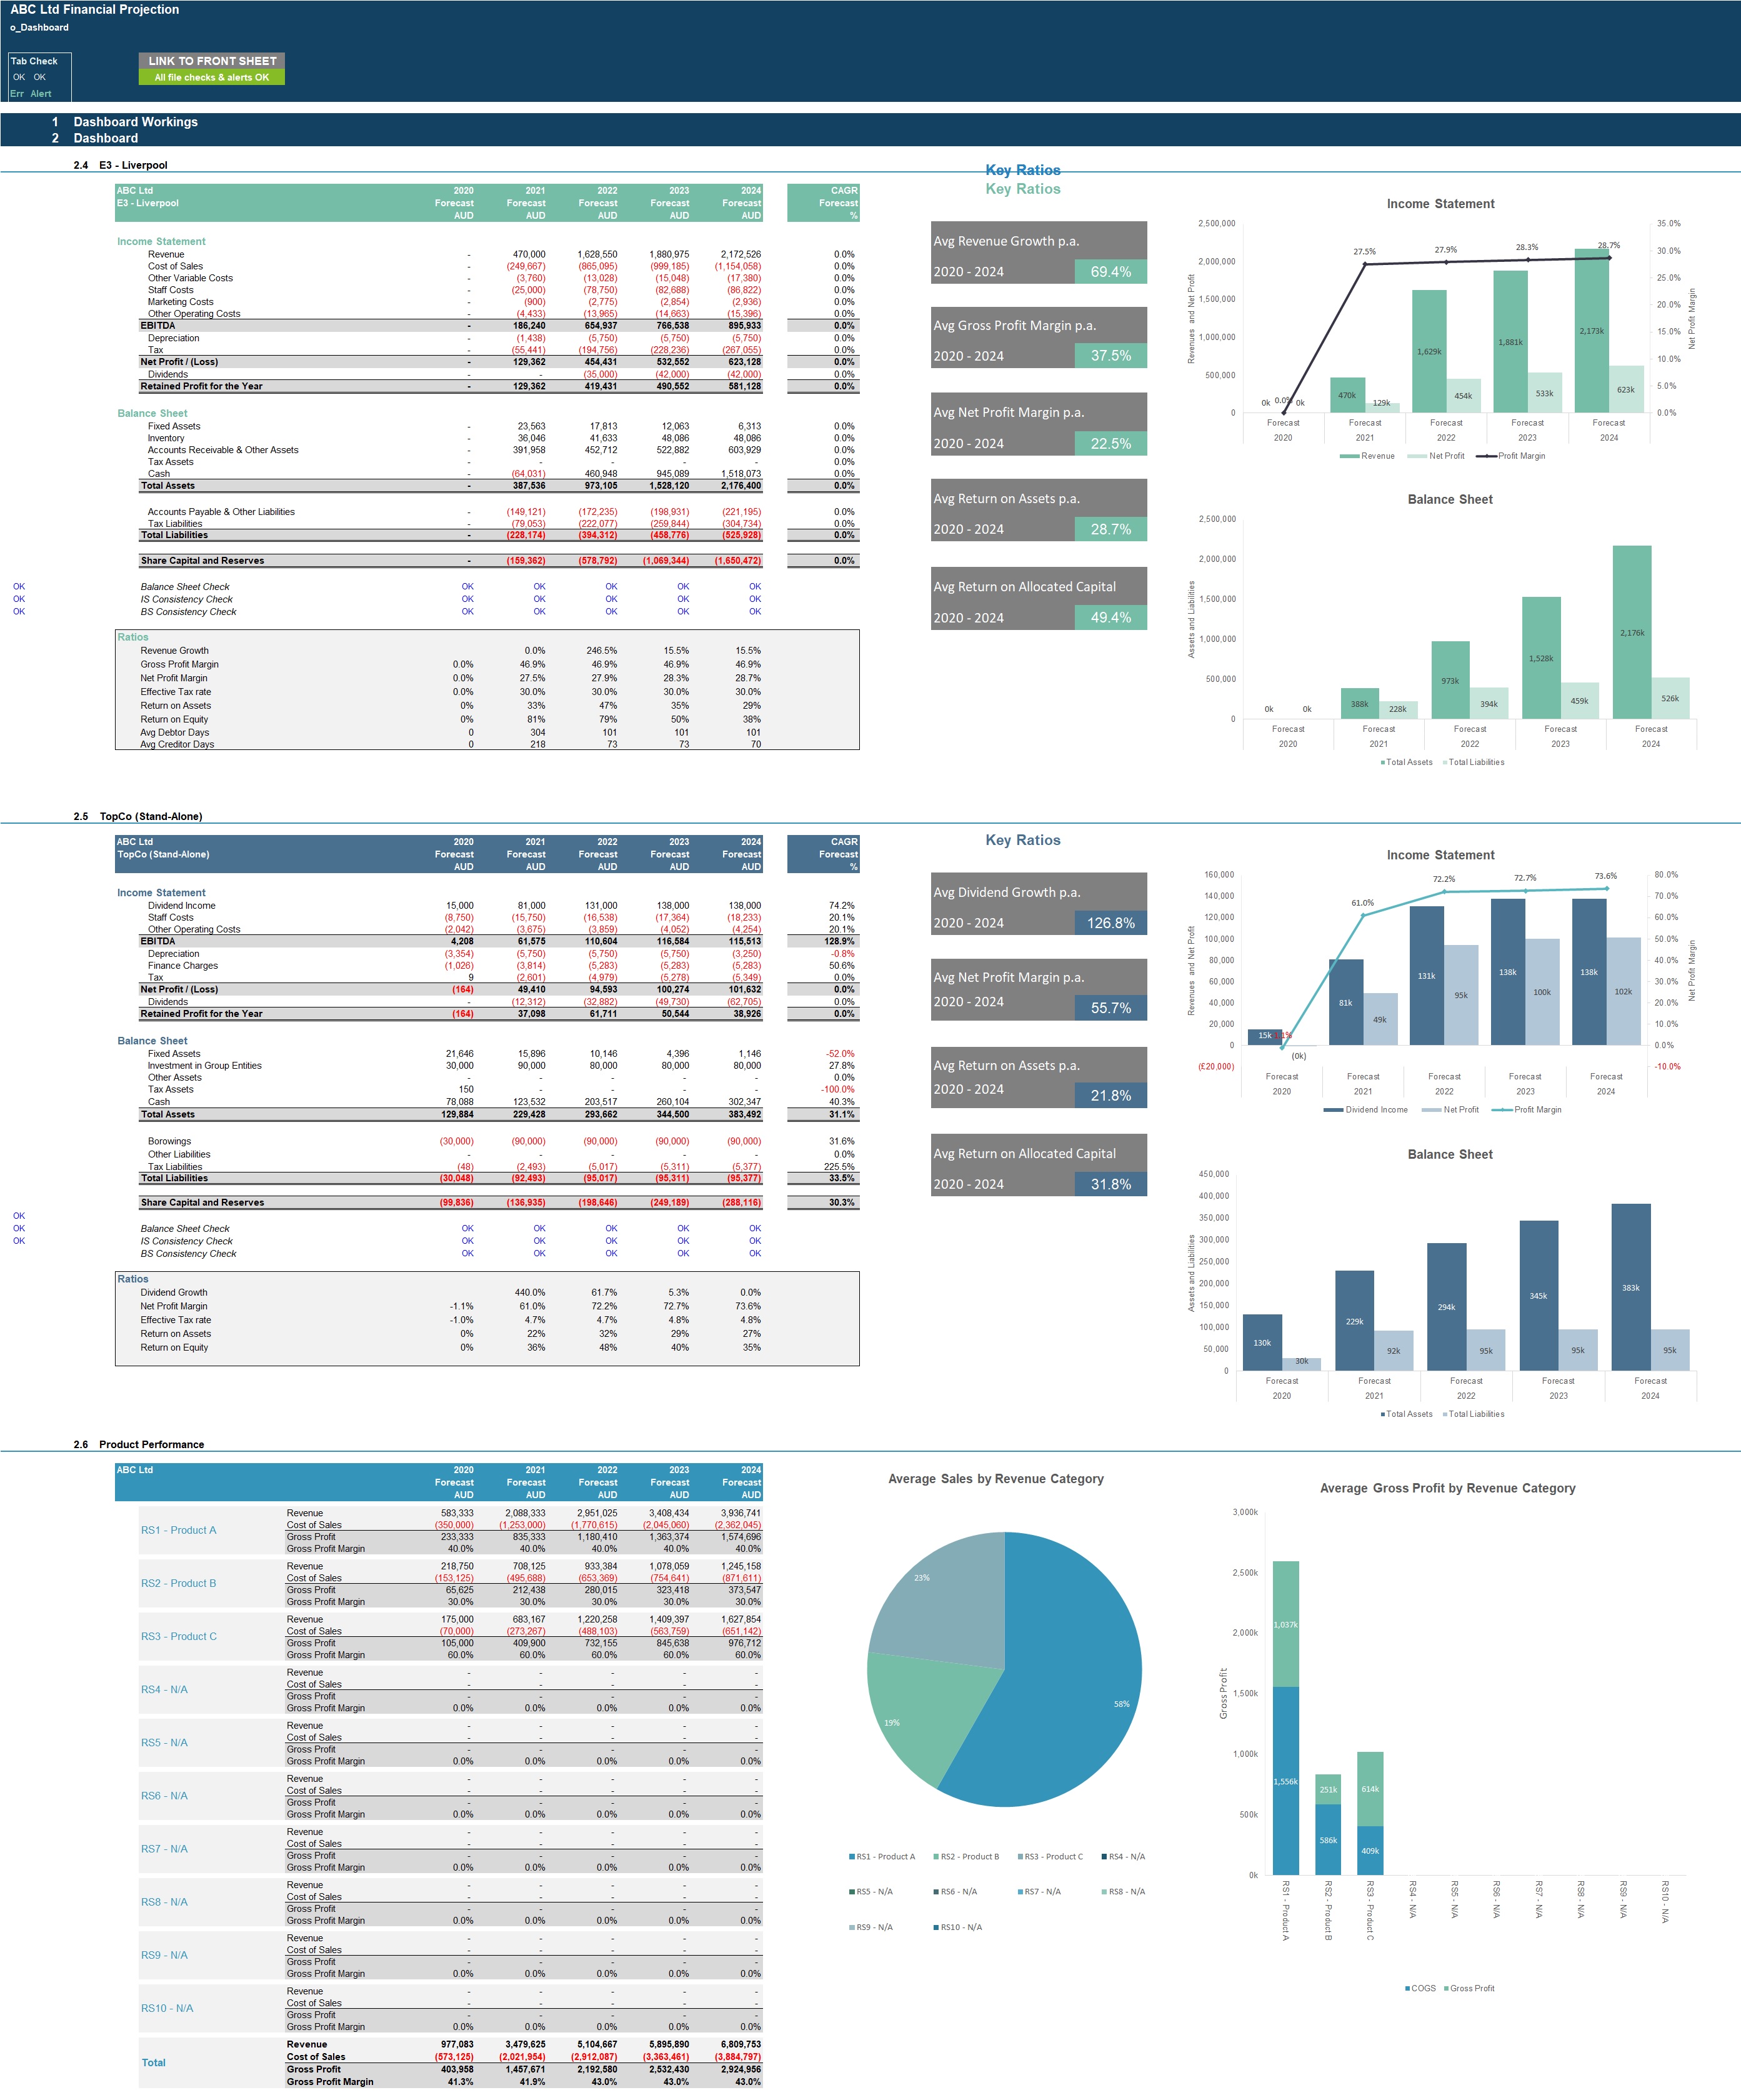
o Bar charts summarising income statement and Balance Sheet projections
o Gross Profit margin by revenue stream in table and bar-chart format
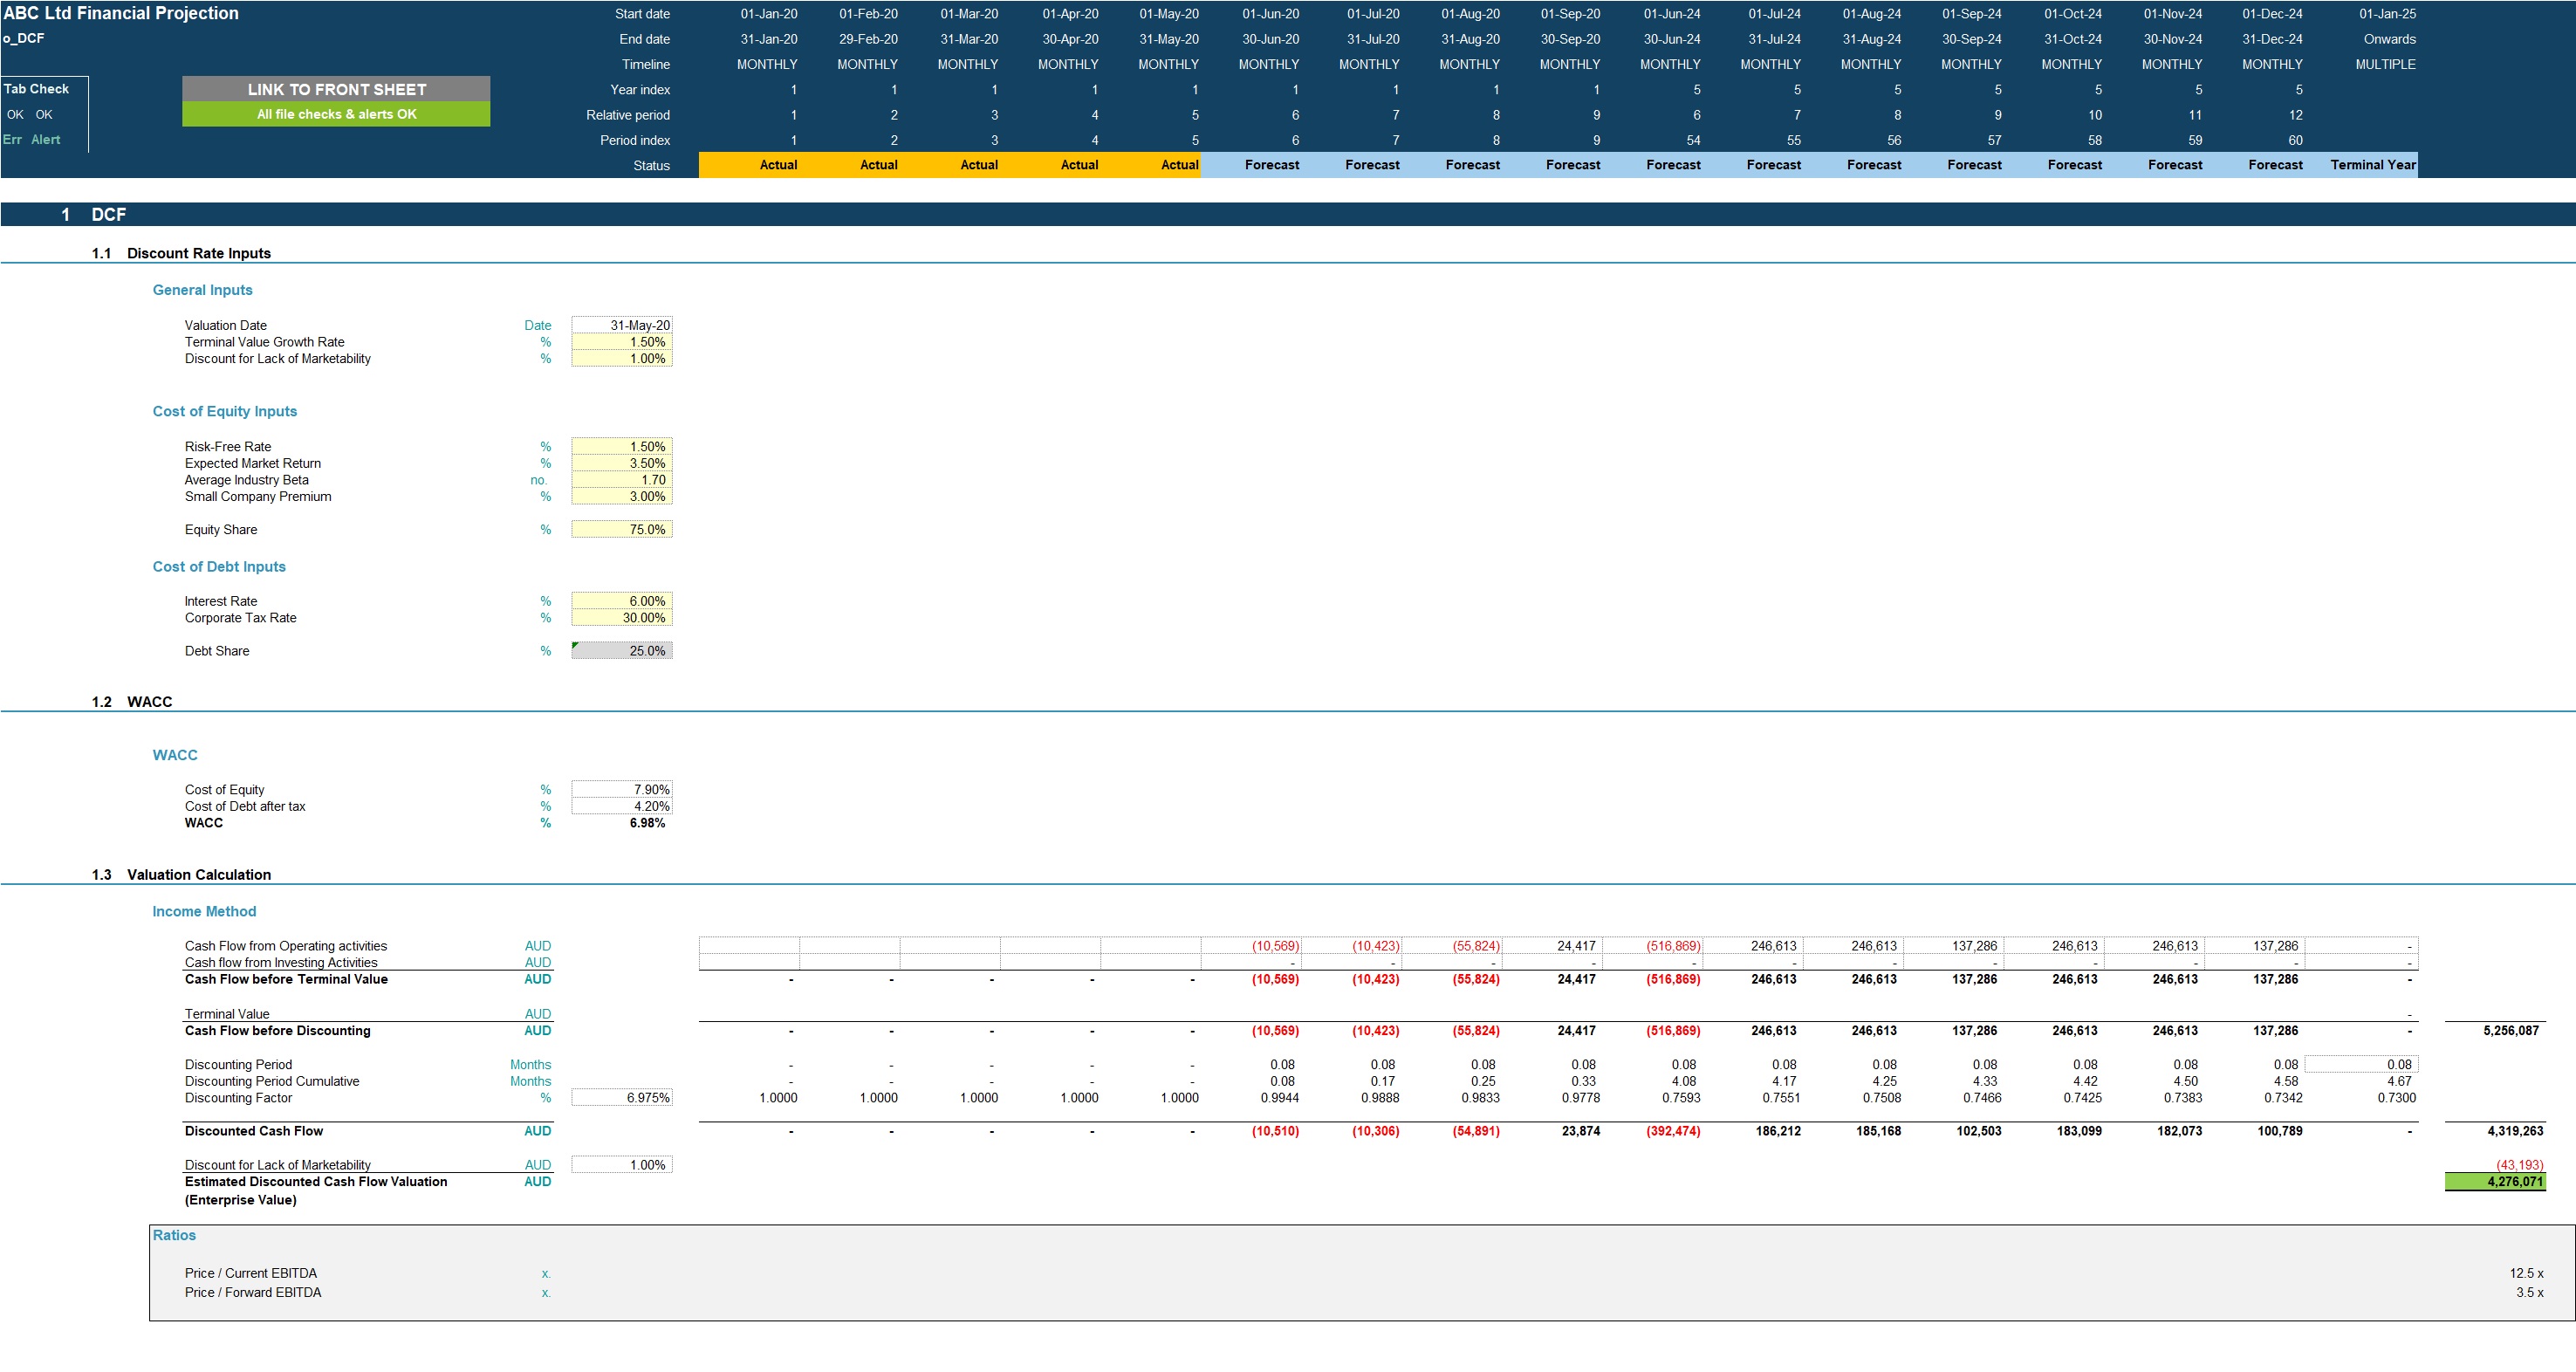
- Discounted cash flow valuation using the projected cash flow output.
KEY INPUTS
Inputs are split into Income Statement and Balance Sheet Inputs. Most inputs include user-friendly line item explanations and input validations to help users understand what the input is for and populate correctly.
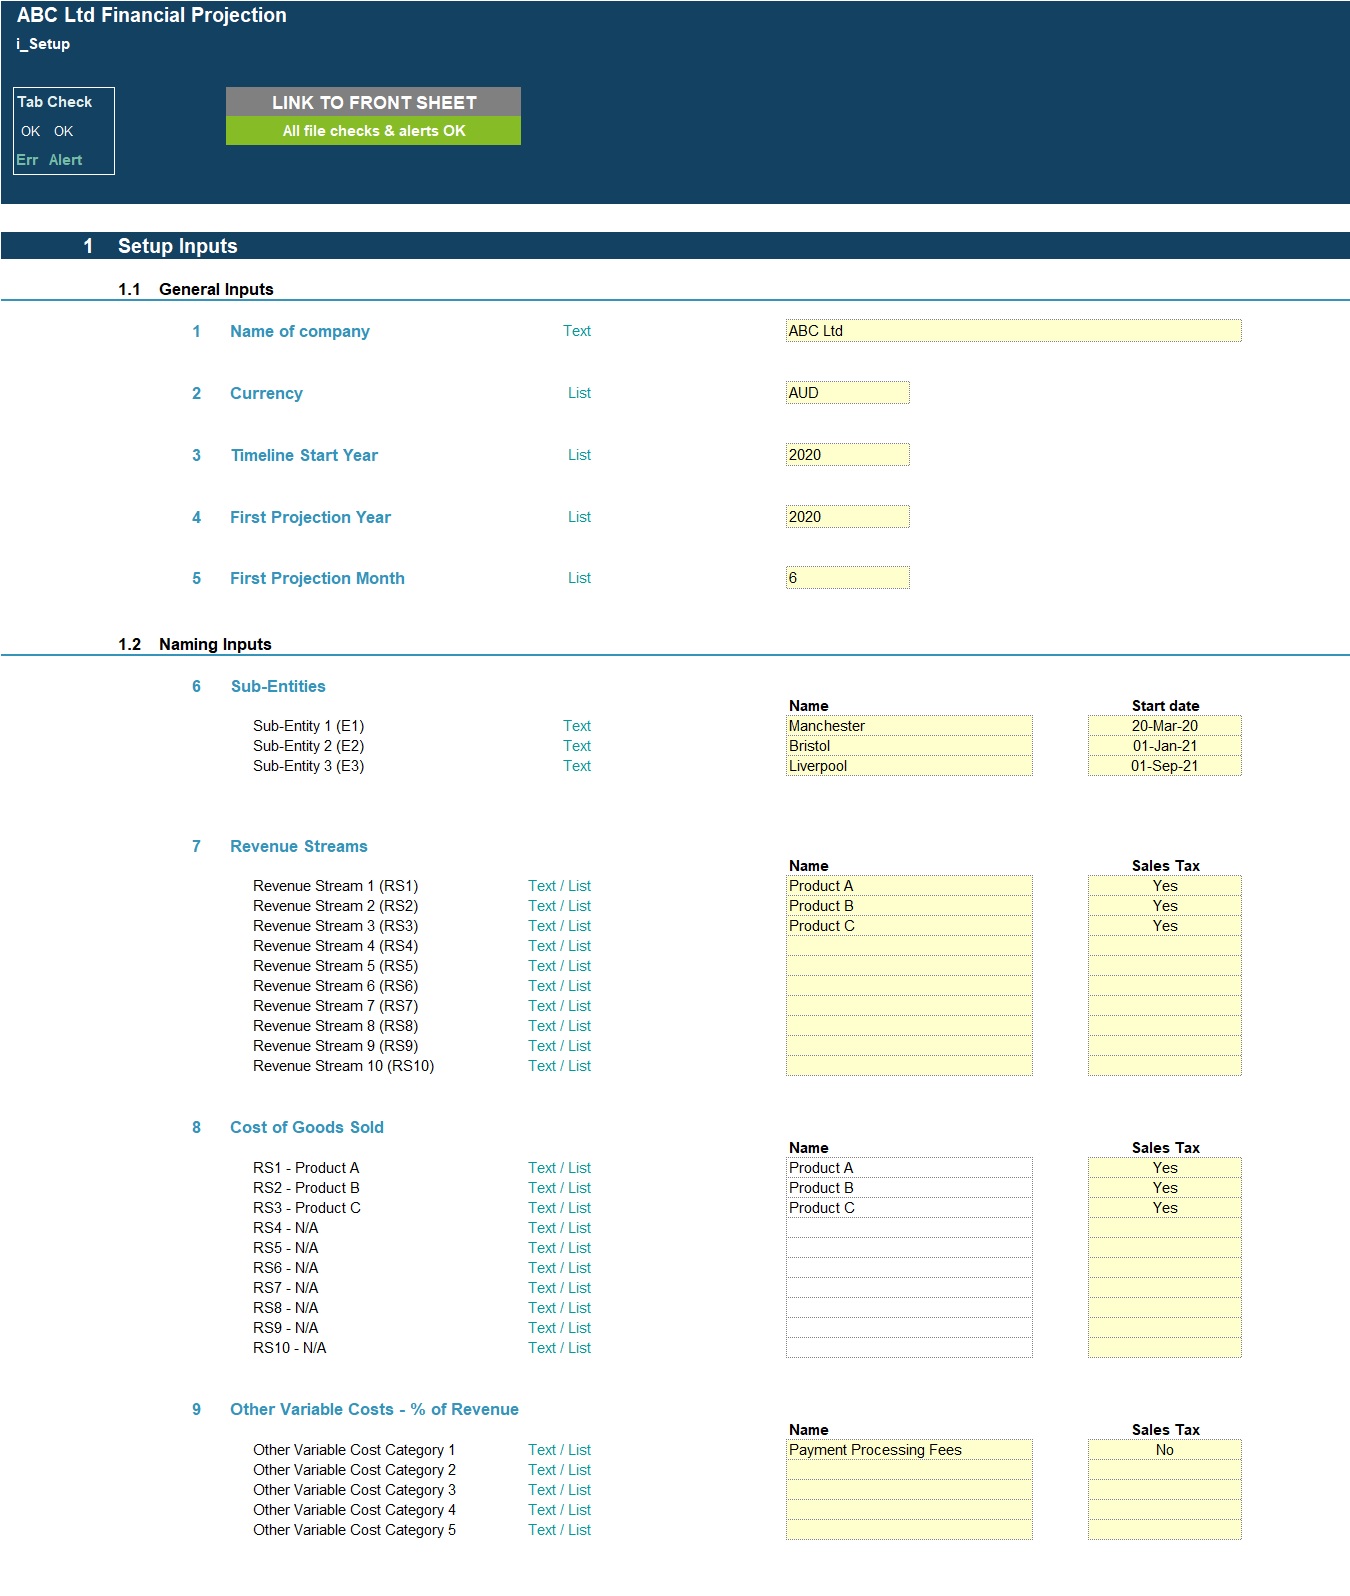
Setup Inputs:
- Name of business;
- Currency;
- First projection year and month;
- Name and start date of the 3 revenue-generating entities (sub-entities);
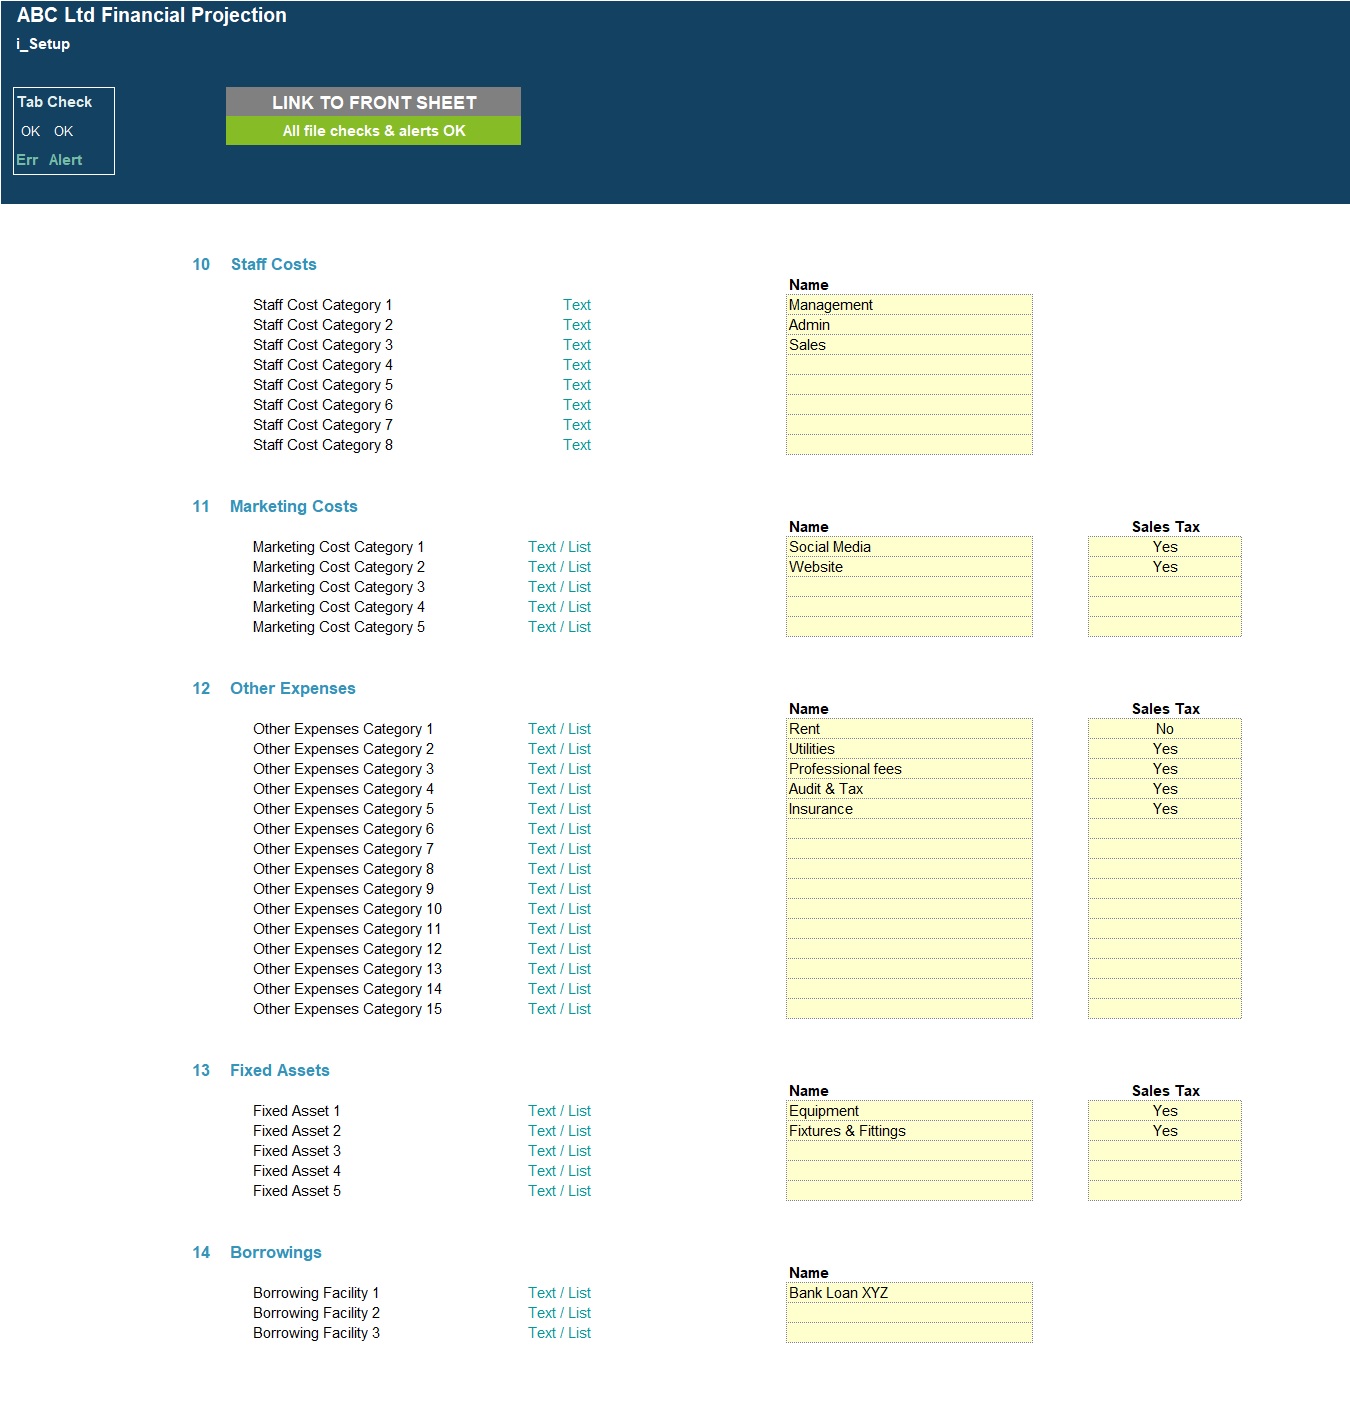
- Naming for revenue streams, variable costs, staff costs, other expenses and fixed assets;
- Sales tax applicability for revenue streams, variable costs, other expenses, fixed assets and borrowings.
Actuals Inputs:
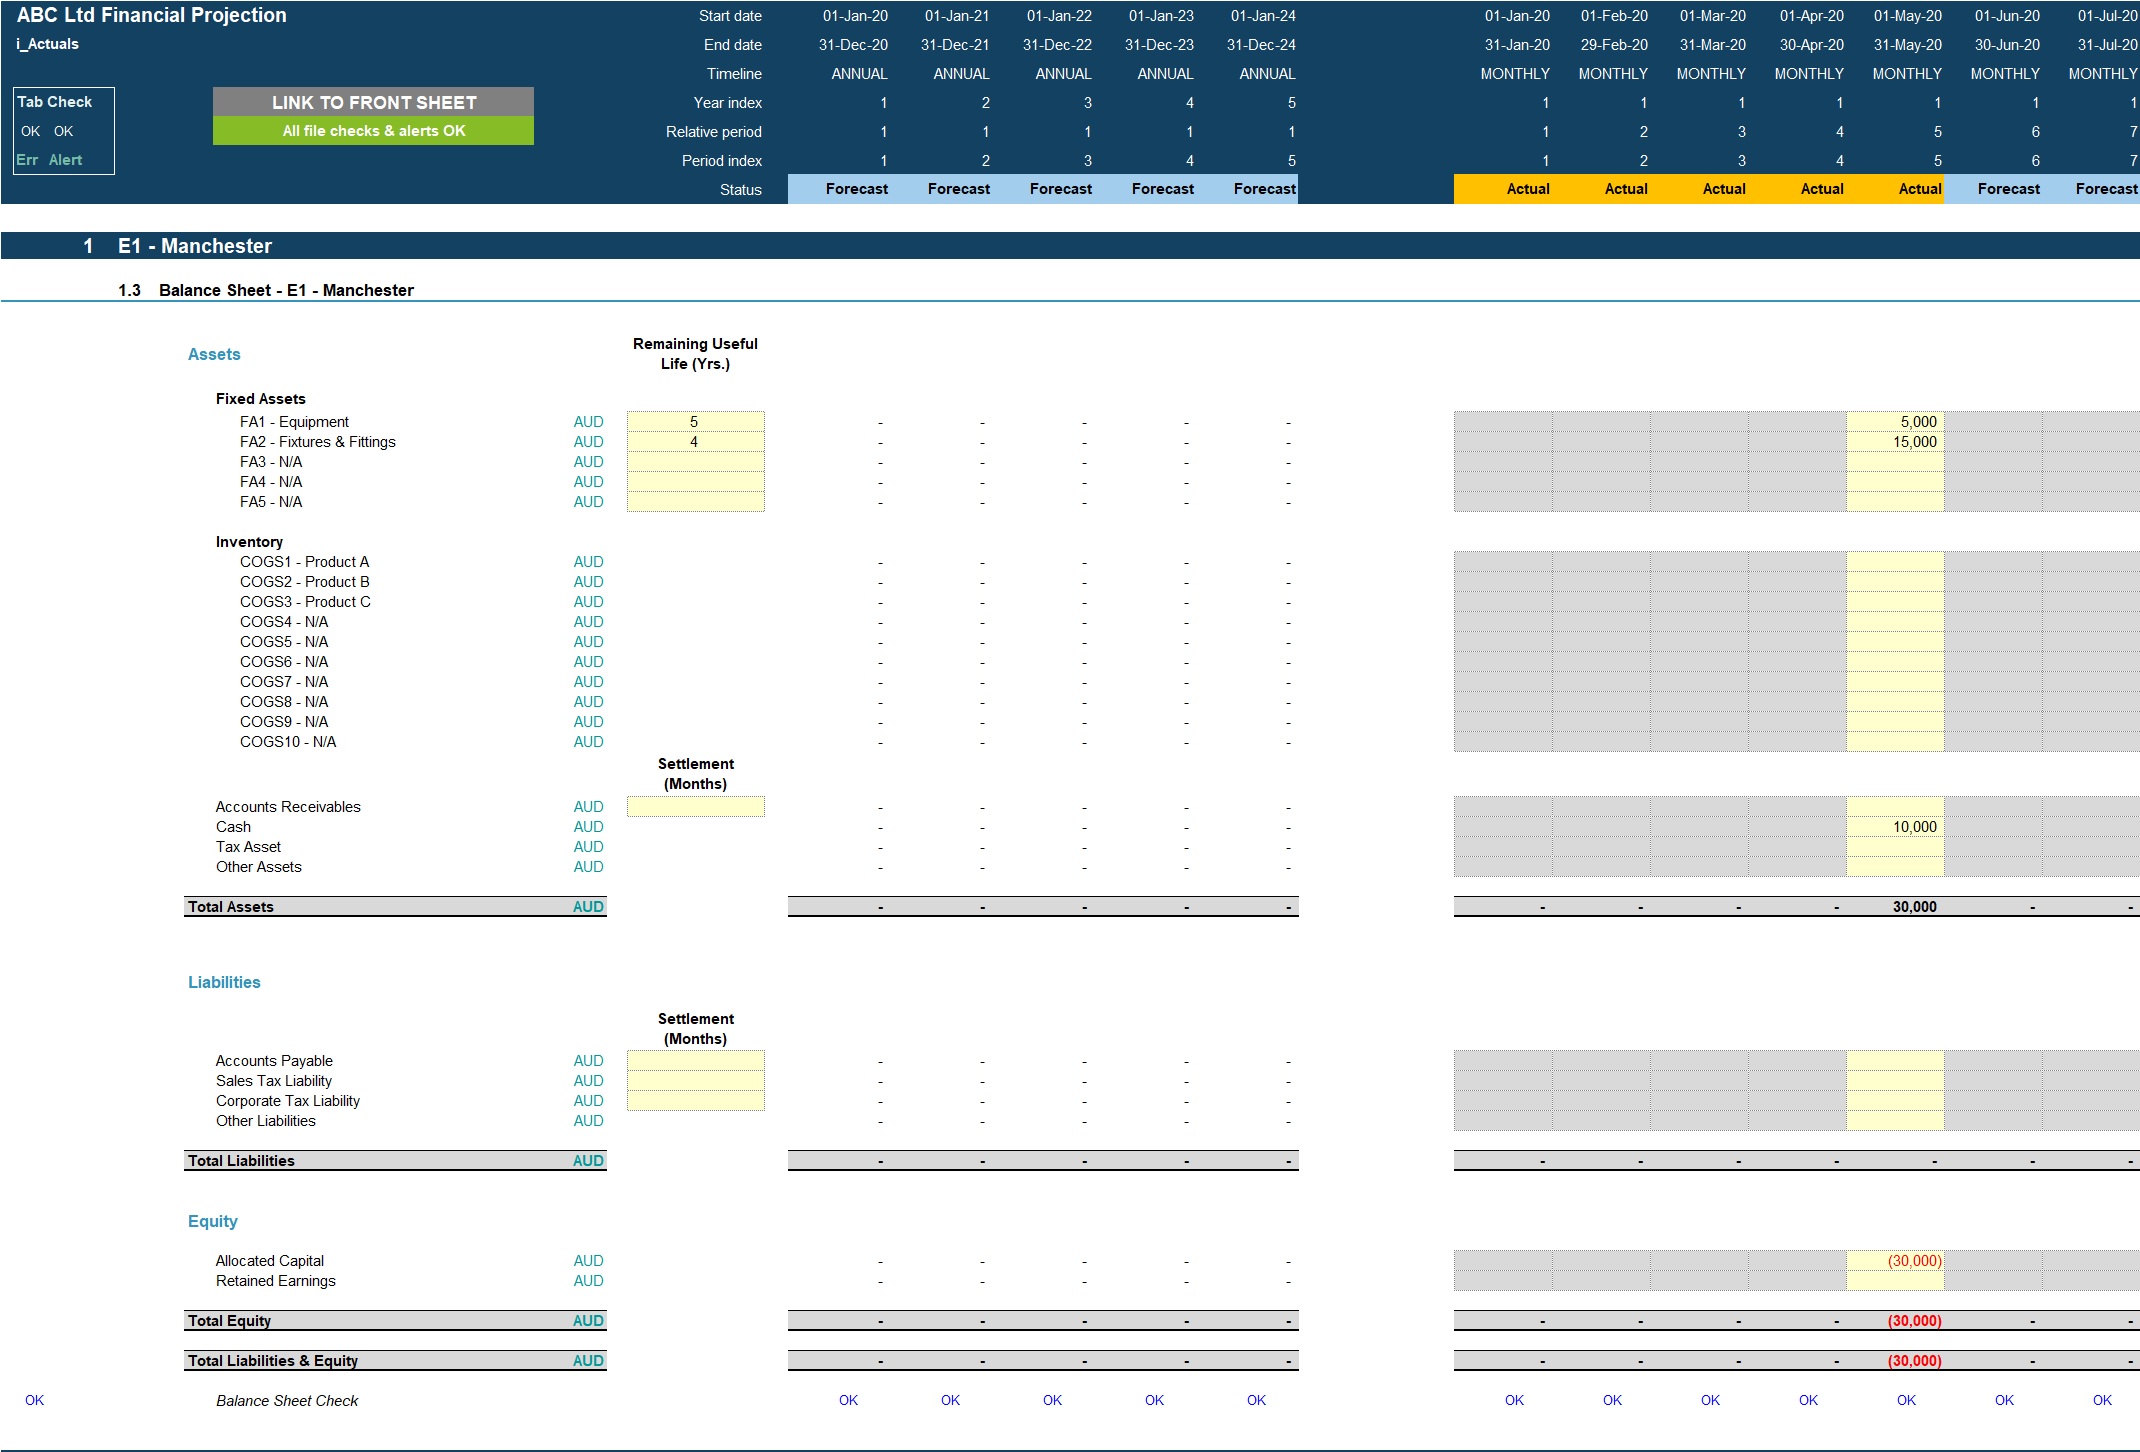
- Opening balance sheet (for existing businesses) for each of the 4 entities;
- Income Statement actuals (for trend analysis) for each of the 4 entities;
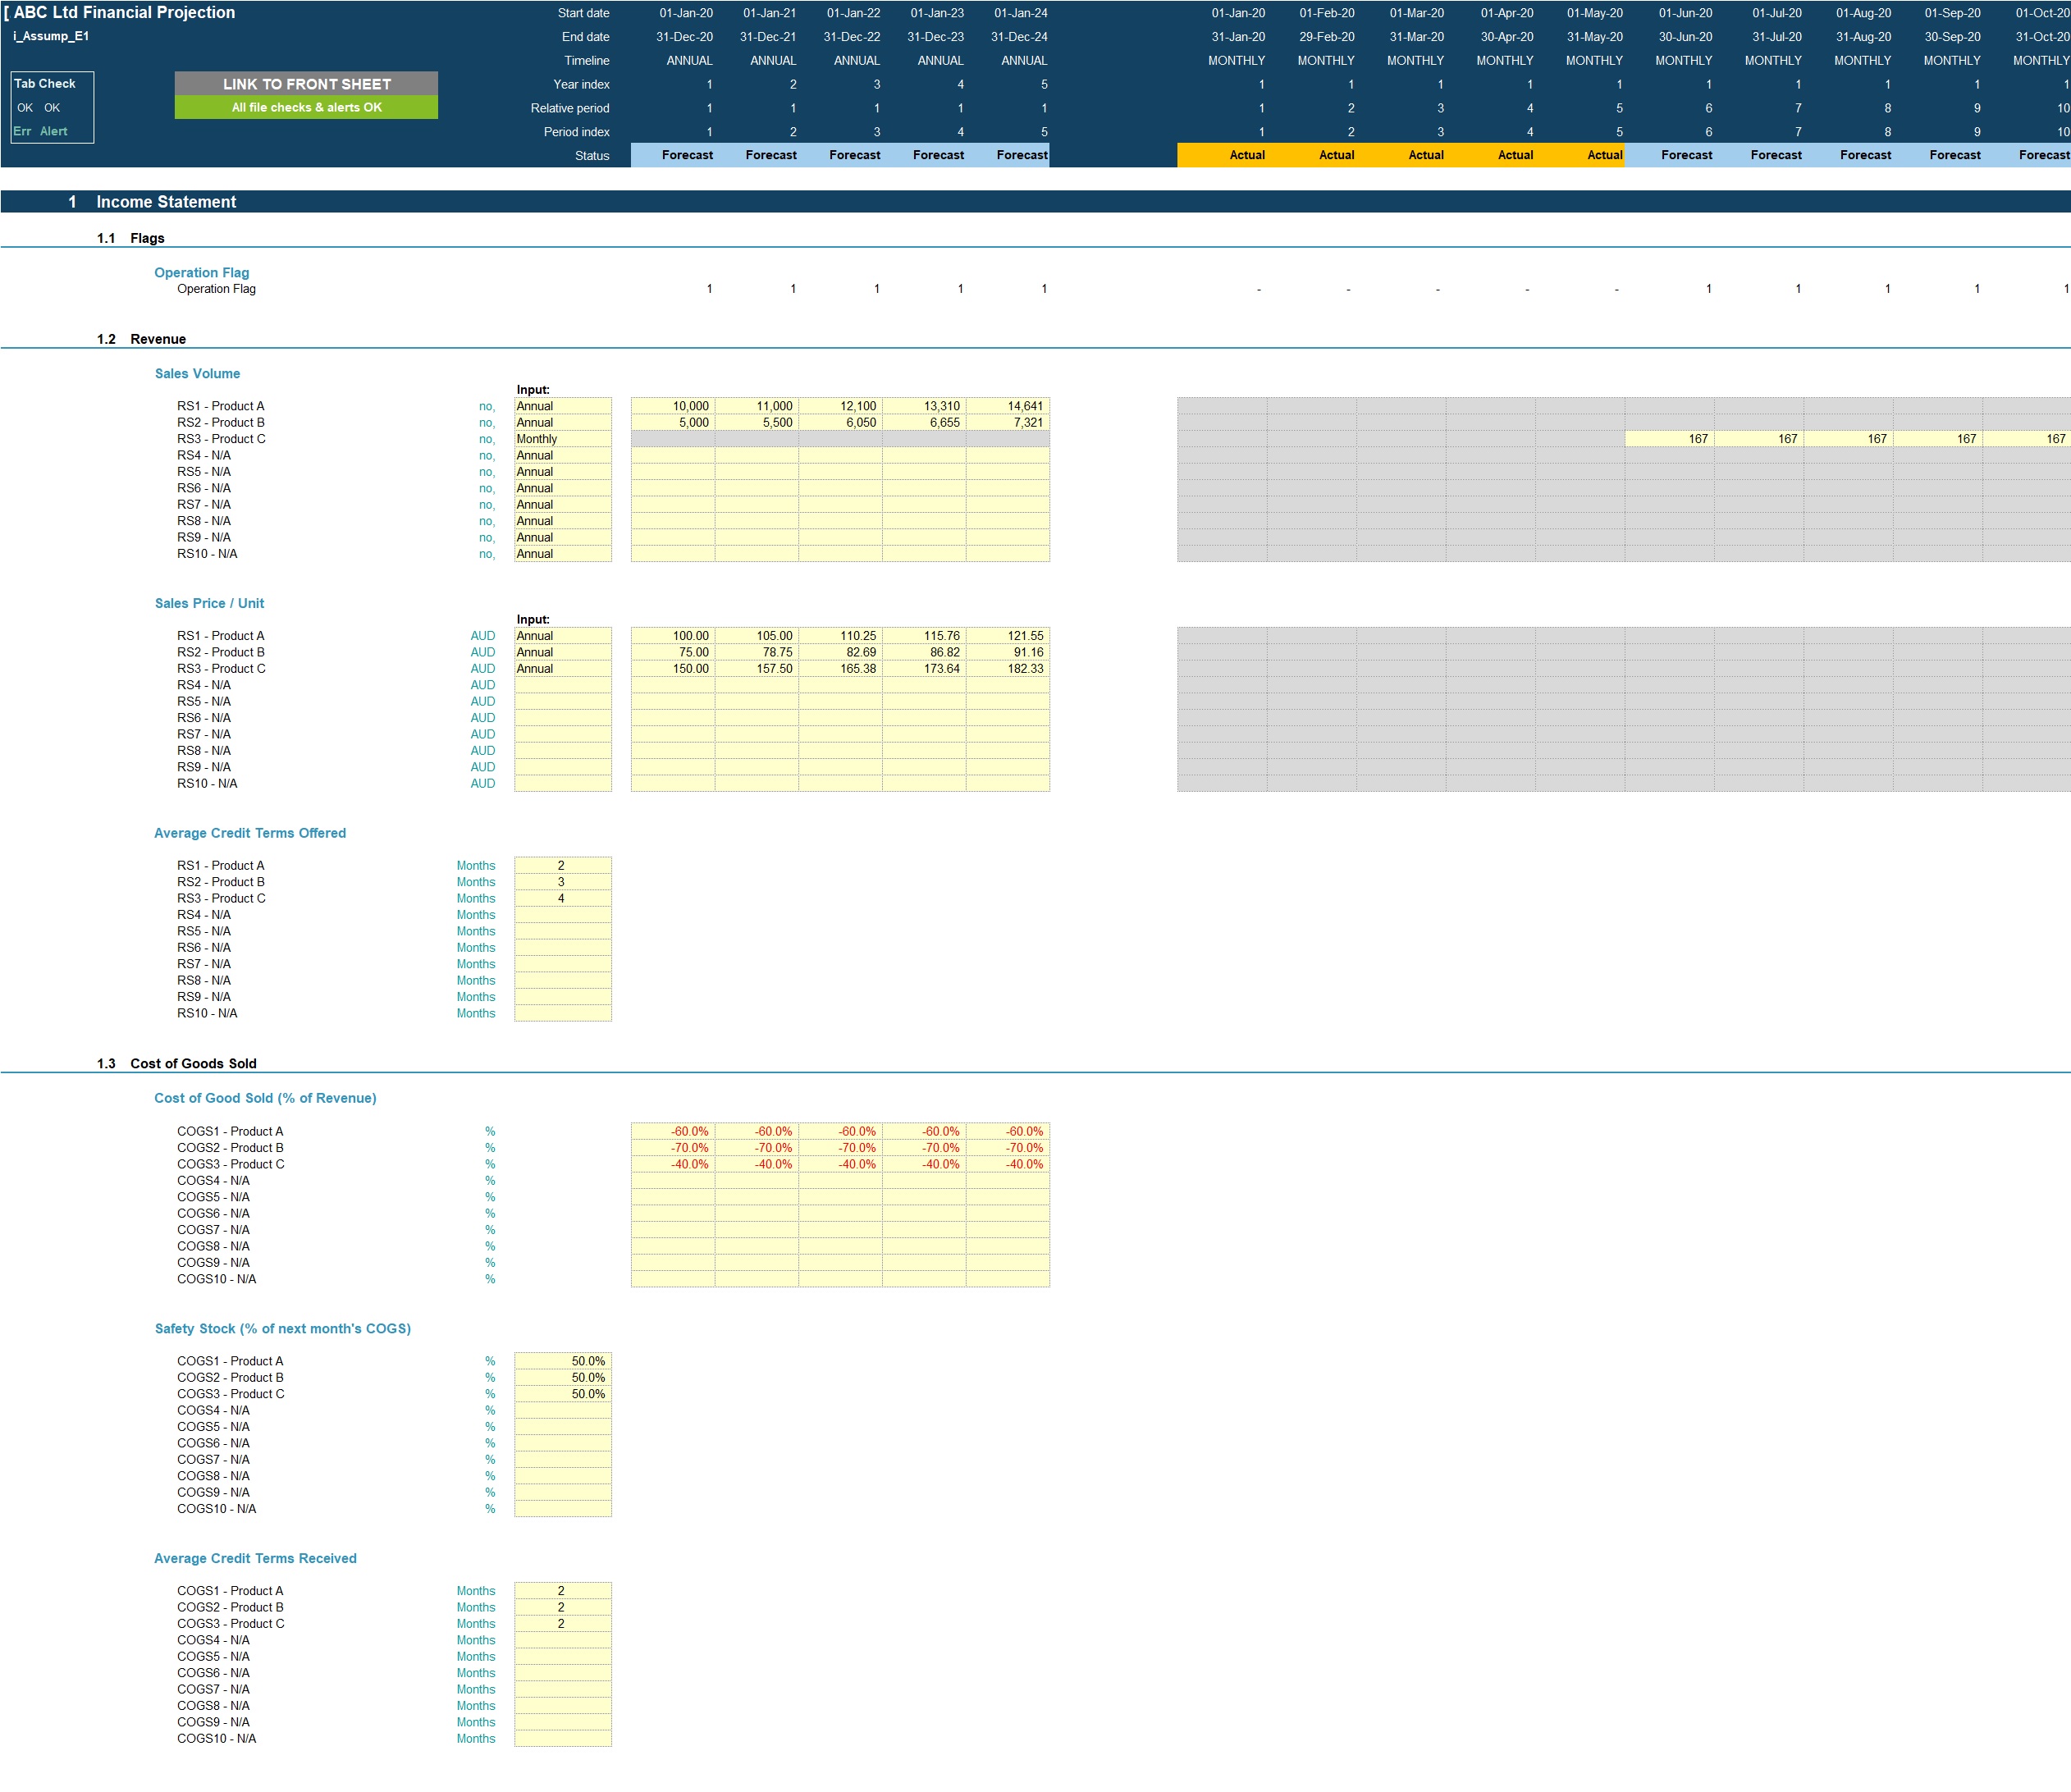
Projection Inputs:
- Revenue inputs including sales volume, sales prices and average credit terms offered;
- Cost of goods sold included percentage of revenue, safety stock percentage and average credit terms received;
- Variable cost inputs including % of revenue applicable to and cost percentage of revenue
- Other costs inputs including staff costs, marketing costs and fixed costs;
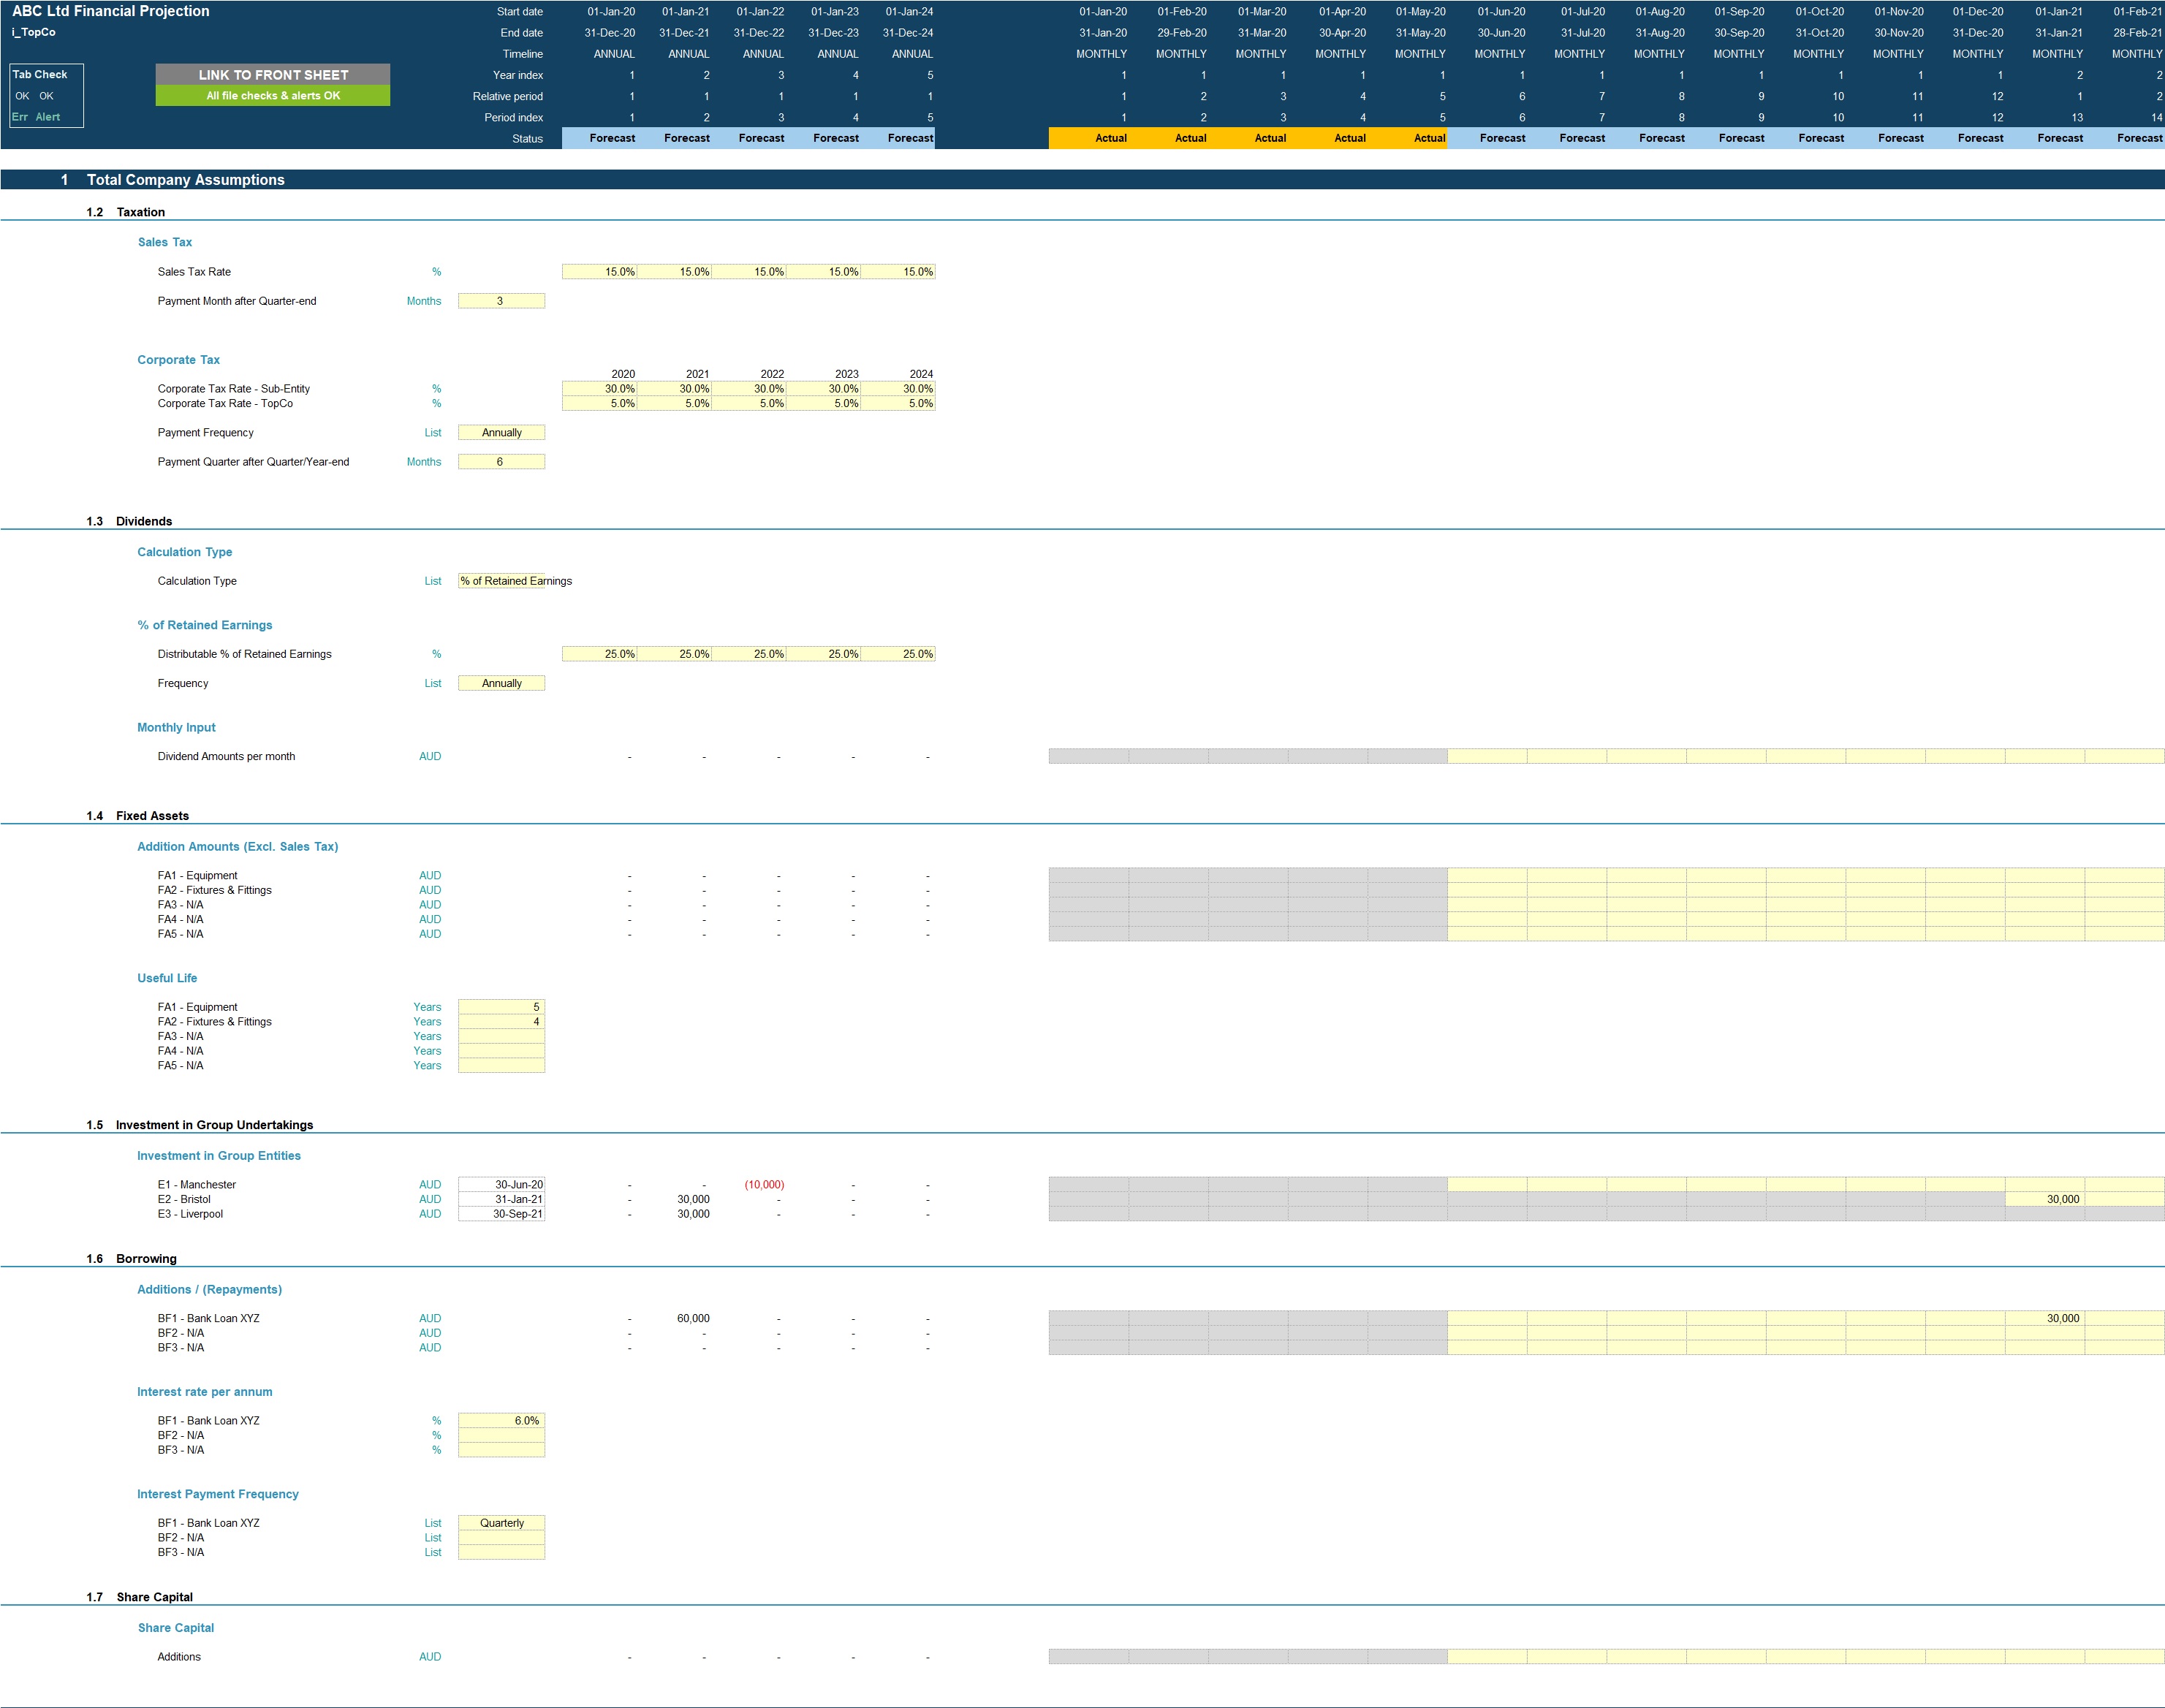
- Sales and corporate tax inputs including rate and payment periods;
- Dividend inputs including amount (percentage of retained earnings) and frequency;
- Fixed Assets including addition amounts and useful life;
- Borrowings including addition amounts and interest rate;
- Share Capital additions and allocations;
- Discount rate inputs (for valuation calculation).
MODEL STRUCTURE
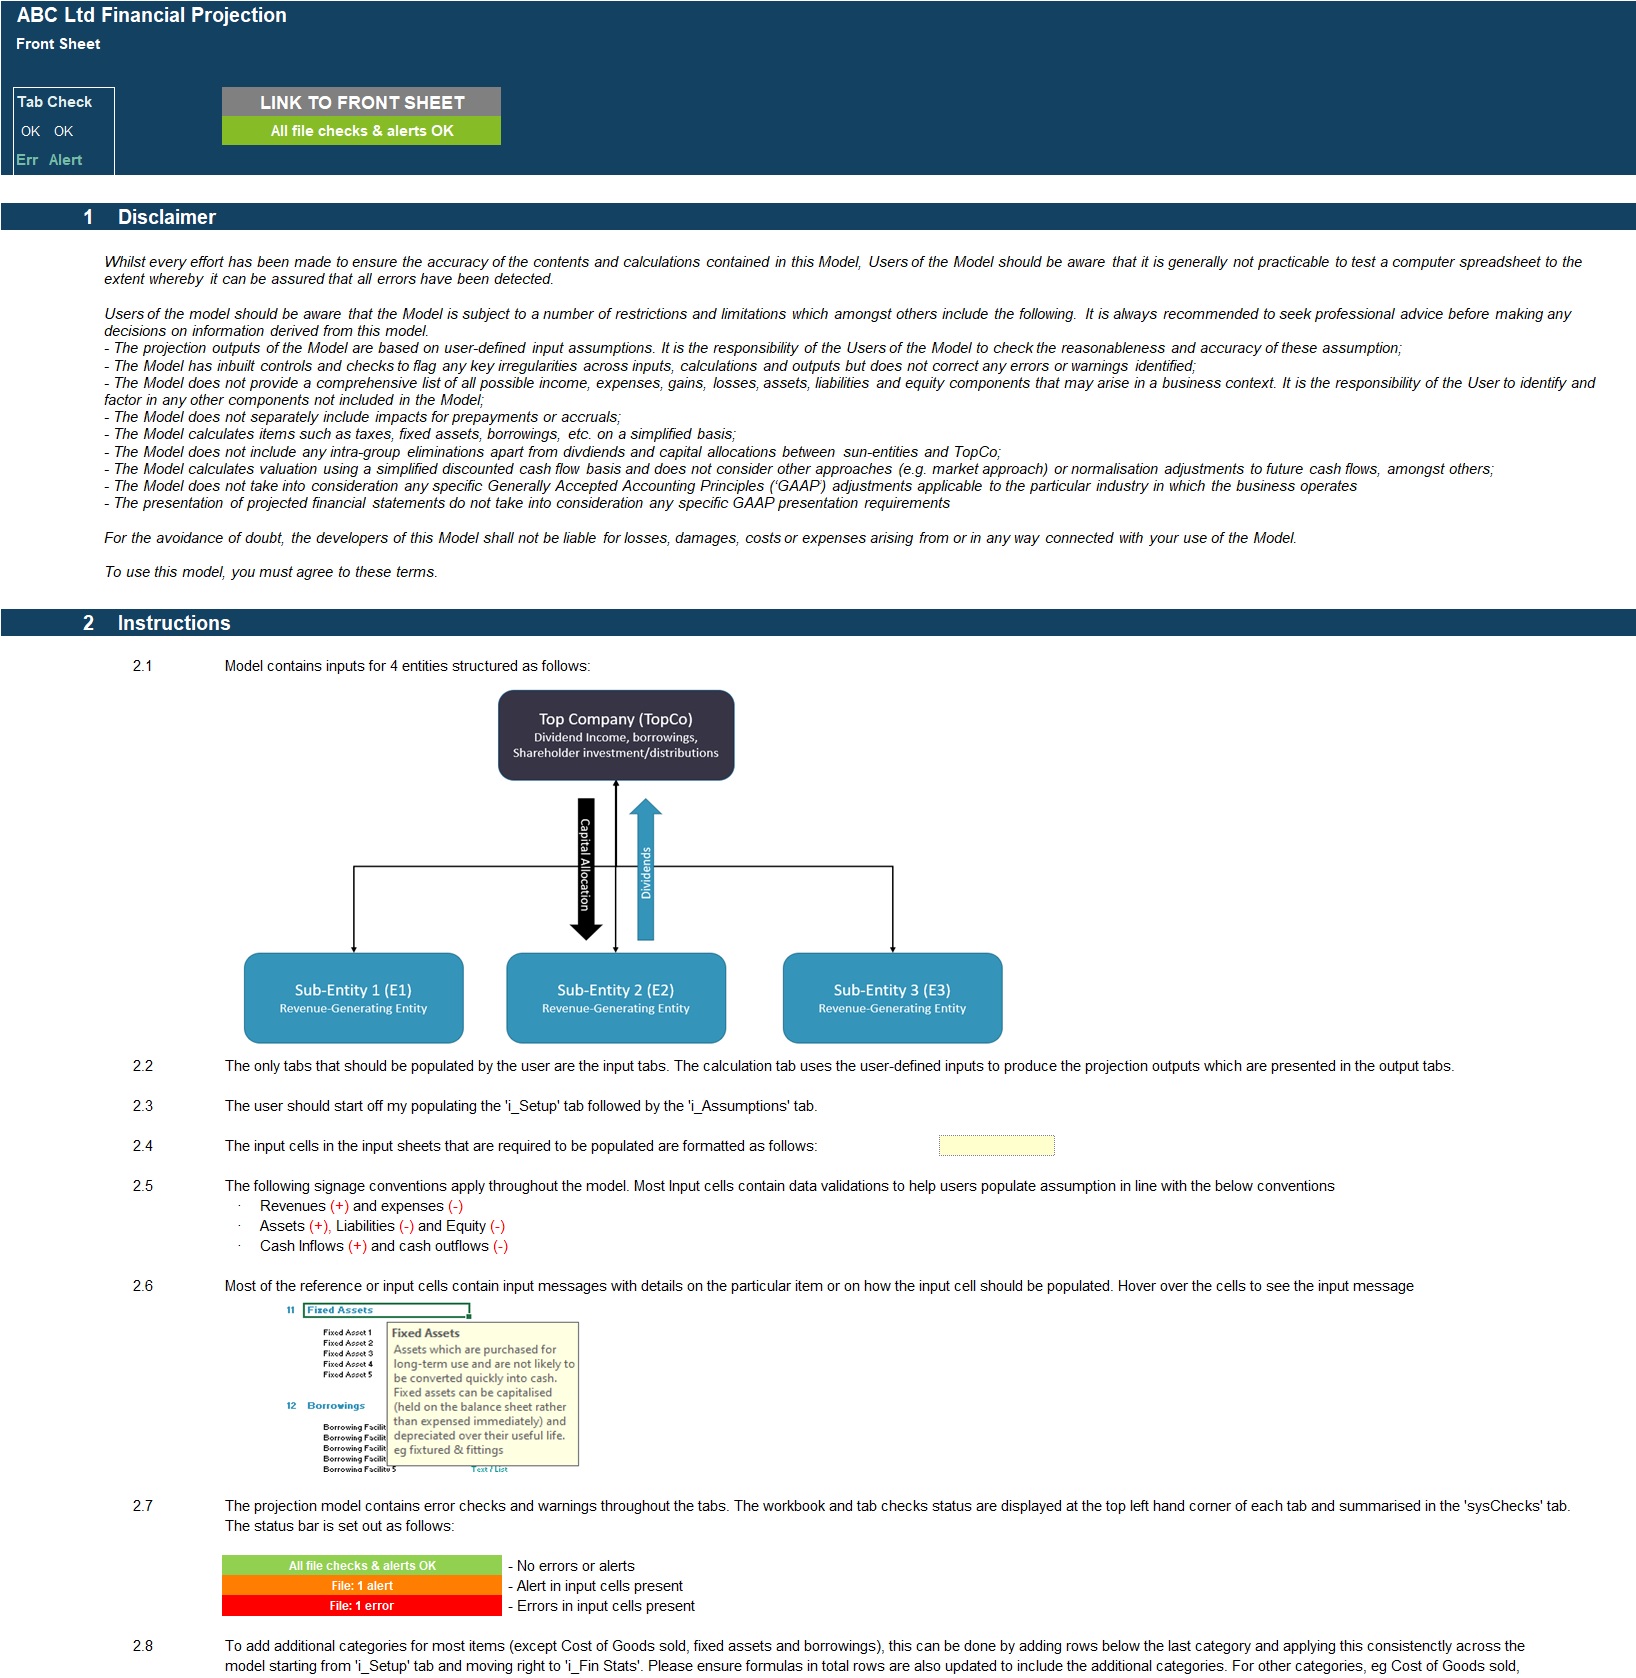
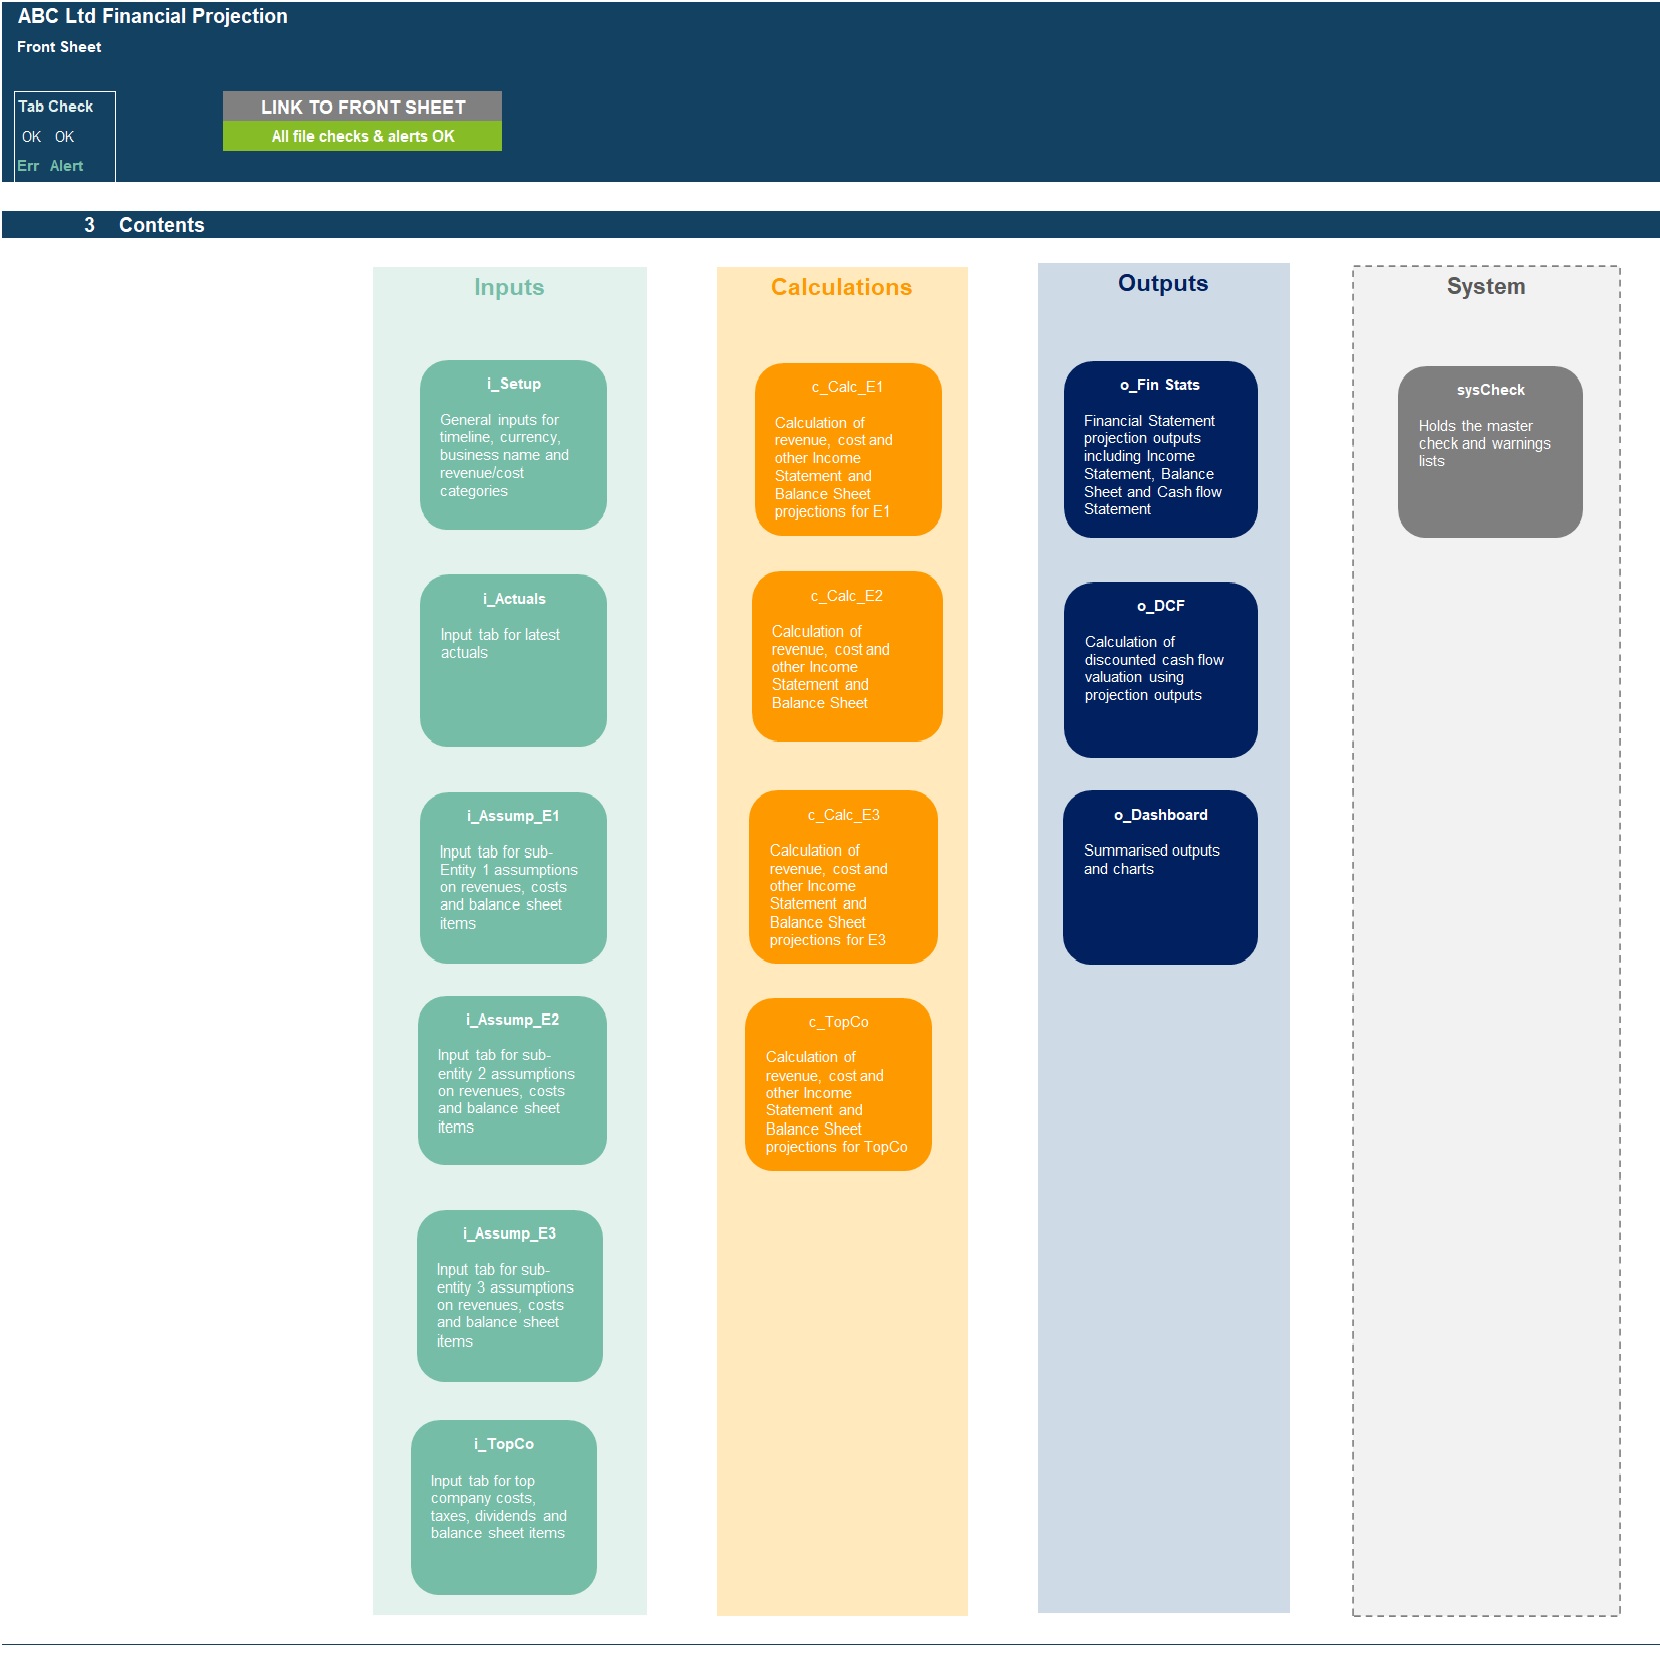
The model comprises of 15 tabs split into input ('i_'), calculation ('c_'), output ('o_’) and system tabs. The tabs to be populated by the user are the input tabs ('i_Setup', ‘i_Actuals’, 'i_Assump_E1/E2/E3' and i_TopCo). The calculation tab uses the user-defined inputs to calculate and produce the projection outputs which are presented in 'o_Fin Stats', ‘o_Dashboard’ and ‘o_DCF’.
System tabs include:
- A 'Front Sheet' containing a disclaimer, instructions and contents;
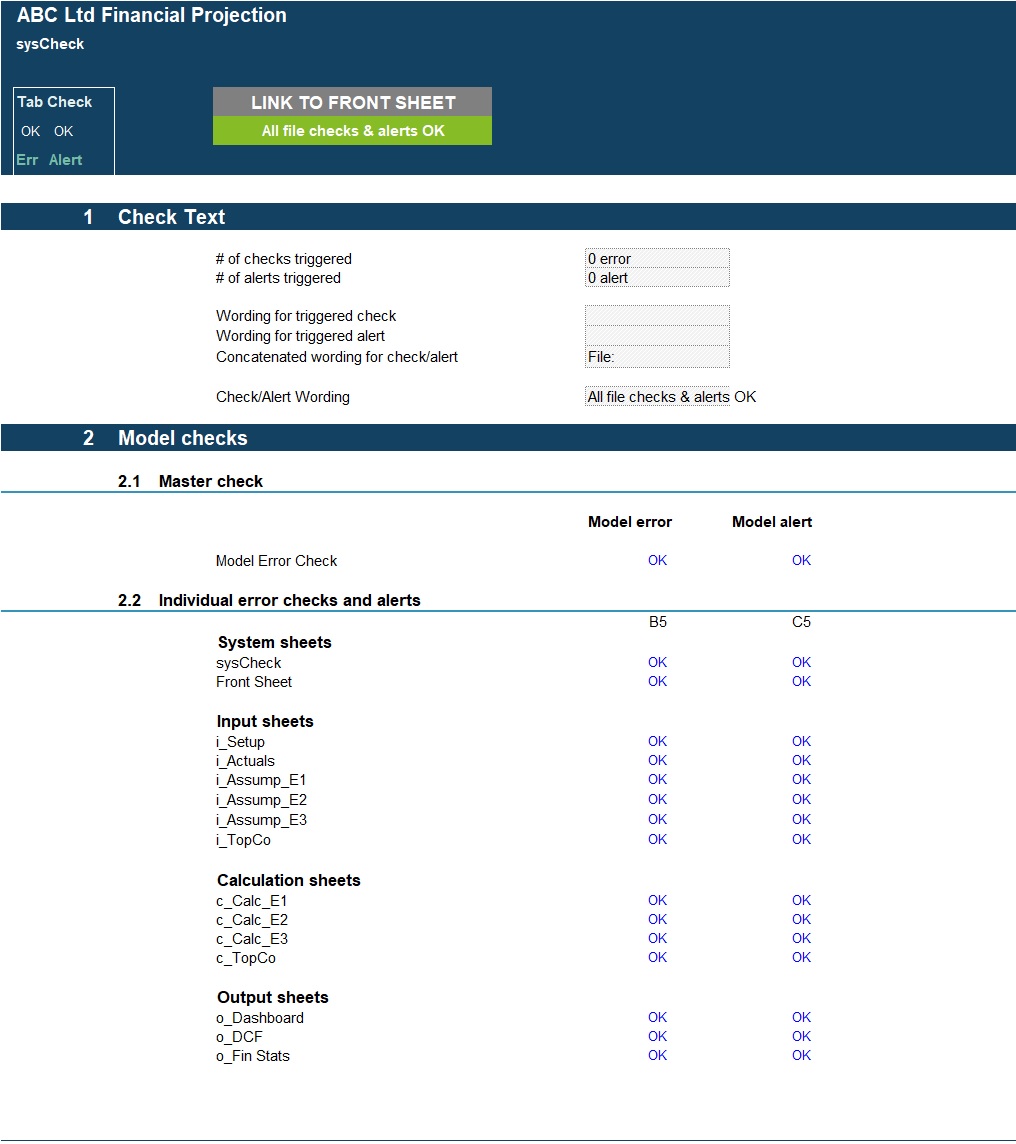
- A checks dashboard containing a summary of checks by tab.
KEY FEATURES
Other key features of this model include the following:
- The model follows good practice financial modelling guidelines and includes instructions, line item explanations, checks and input validations;
- The model contains a flexible timeline that allows for a mix of Actual and Forecast period across a 5-year period. This allows projections to be easily rolled forward;
- Timeline is split on a monthly basis and summarised on an annual basis;
- The model allows the user to model 10 separate revenue streams across 3 revenue-generating entities on a Price x Volume basis;
- The model is not password protected and can be modified as required following download;
- The model is reviewed using specialised model audit software to help reduce risk of formula inconsistencies;
- Costs are split into: variable and other costs for better driver-based forecasting;
- The model allows for the following number of underlying categories for each line item (these can be easily expanded if required):
o Revenue Generating subsidiaries – 3 entities;
o Revenue streams – 10 categories;
o Cost of goods sold – 1 category for each revenue stream (10 categories in total);
o Variable costs – 5 categories
o Staff costs – 8 categories;
o Marketing costs – 5 categories;
o Other expenses – 15 categories;
o Fixed assets – 5 categories;
o Borrowings – 3 facilities
- Apart from projecting revenue and costs the tool includes the possibility to model receivables and payables, fixed assets, borrowings, dividends and corporate tax;
- Business Name, currency, starting projection period are fully customisable;
- Revenue, cost, fixed asset and borrowings descriptions are fully customisable;
- The model included an integrated discounted cash flow valuation using the projected cash flow outputs;
- The model includes instructions, line item explanations, checks and input validations to help ensure input fields are populated accurately;
- The model includes a checks dashboard which summarises all the checks included in the various tabs making it easier to identify any errors.
MODIFICATIONS
If you require any be-spoke modifications to the tool, we are more than happy to assist with this. Please send us a message through the Eloquens site.
ABOUT PROJECTIFY
We are a team of financial modelling professionals with experience working in big 4 business modelling teams and strong experience supporting businesses with their financial planning and decision support needs. Our aim is to provide robust and easy-to-use tools that follow good practice financial modelling guidelines and assist individuals and businesses with common financial planning and analysis processes.
We are keen to make sure our customers are satisfied with the tools / models they purchase and will be more than happy to assist with any questions or support required following or in advance of purchase.
We are also always keen to receive feedback so please do let us know what you think of our models by sending us a message or submitting a review.
PURPOSE OF MODEL
Highly versatile and user-friendly Excel model for the preparation a of 5-year rolling 3 statement (Income Statement, Balance Sheet and Cash flow Statement) financial projection with a monthly timeline for a generic new or existing Group of businesses consisting of up to 3 revenue-generating subsidiaries and 1 holding company (TopCo). The model also incorporates a discounted cash flow valuation calculation using the projected cash flows.
The model allows the user to project up to 10 revenue streams across 3 revenue-generating entities with variable costs categories for each revenue stream as well as marketing costs, staff costs, other operating costs, fixed assets and borrowings.
The model allows user to model capital allocations from TopCo to sub-entities and dividend distributions from sub-entities to TopCo. The model also presents aggregated Group projected financial statements eliminating intra-group transfers of dividends and capital.
The model follows good practice financial modelling principles and includes instructions, line item explanations, checks and input validations.
KEY OUTPUTS
The model is generic and not industry-specific. The key outputs include:
- Projected full financial statements (Income Statement, Balance Sheet and Cash flow Statement) for each of the 4 entities, presented on a monthly basis across up to 5 years and summarised on an annual basis.
- Dashboard with:
o Summarised projected Income Statement and Balance Sheet for each of the 4 entities plus aggregated group view
o Compounded Annual Growth rate (CAGR) for each summarised income statement and Balance Sheet line item for each of the 4 entities
o List of key ratios including Average revenue growth, Average profit margins, Average return on assets and equity and Average Debt to Equity ratio.
o Bar charts summarising income statement and Balance Sheet projections
o Gross Profit margin by revenue stream in table and bar-chart format
- Discounted cash flow valuation using the projected cash flow output.
KEY INPUTS
Inputs are split into Income Statement and Balance Sheet Inputs. Most inputs include user-friendly line item explanations and input validations to help users understand what the input is for and populate correctly.
Setup Inputs:
- Name of business;
- Currency;
- First projection year and month;
- Name and start date of the 3 revenue-generating entities (sub-entities);
- Naming for revenue streams, variable costs, staff costs, other expenses and fixed assets;
- Sales tax applicability for revenue streams, variable costs, other expenses, fixed assets and borrowings.
Actuals Inputs:
- Opening balance sheet (for existing businesses) for each of the 4 entities;
- Income Statement actuals (for trend analysis) for each of the 4 entities;
Projection Inputs:
- Revenue inputs including sales volume, sales prices and average credit terms offered;
- Cost of goods sold included percentage of revenue, safety stock percentage and average credit terms received;
- Variable cost inputs including % of revenue applicable to and cost percentage of revenue
- Other costs inputs including staff costs, marketing costs and fixed costs;
- Sales and corporate tax inputs including rate and payment periods;
- Dividend inputs including amount (percentage of retained earnings) and frequency;
- Fixed Assets including addition amounts and useful life;
- Borrowings including addition amounts and interest rate;
- Share Capital additions and allocations;
- Discount rate inputs (for valuation calculation).
MODEL STRUCTURE
The model comprises of 15 tabs split into input ('i_'), calculation ('c_'), output ('o_’) and system tabs. The tabs to be populated by the user are the input tabs ('i_Setup', ‘i_Actuals’, 'i_Assump_E1/E2/E3' and i_TopCo). The calculation tab uses the user-defined inputs to calculate and produce the projection outputs which are presented in 'o_Fin Stats', ‘o_Dashboard’ and ‘o_DCF’.
System tabs include:
- A 'Front Sheet' containing a disclaimer, instructions and contents;
- A checks dashboard containing a summary of checks by tab.
KEY FEATURES
Other key features of this model include the following:
- The model follows good practice financial modelling guidelines and includes instructions, line item explanations, checks and input validations;
- The model contains a flexible timeline that allows for a mix of Actual and Forecast period across a 5-year period. This allows projections to be easily rolled forward;
- Timeline is split on a monthly basis and summarised on an annual basis;
- The model allows the user to model 10 separate revenue streams across 3 revenue-generating entities on a Price x Volume basis;
- The model is not password protected and can be modified as required following download;
- The model is reviewed using specialised model audit software to help reduce risk of formula inconsistencies;
- Costs are split into: variable and other costs for better driver-based forecasting;
- The model allows for the following number of underlying categories for each line item (these can be easily expanded if required):
o Revenue Generating subsidiaries – 3 entities;
o Revenue streams – 10 categories;
o Cost of goods sold – 1 category for each revenue stream (10 categories in total);
o Variable costs – 5 categories
o Staff costs – 8 categories;
o Marketing costs – 5 categories;
o Other expenses – 15 categories;
o Fixed assets – 5 categories;
o Borrowings – 3 facilities
- Apart from projecting revenue and costs the tool includes the possibility to model receivables and payables, fixed assets, borrowings, dividends and corporate tax;
- Business Name, currency, starting projection period are fully customisable;
- Revenue, cost, fixed asset and borrowings descriptions are fully customisable;
- The model included an integrated discounted cash flow valuation using the projected cash flow outputs;
- The model includes instructions, line item explanations, checks and input validations to help ensure input fields are populated accurately;
- The model includes a checks dashboard which summarises all the checks included in the various tabs making it easier to identify any errors.
MODIFICATIONS
If you require any be-spoke modifications to the tool, we are more than happy to assist with this. Please send us a message through the Eloquens site.
ABOUT PROJECTIFY
We are a team of financial modelling professionals with experience working in big 4 business modelling teams and strong experience supporting businesses with their financial planning and decision support needs. Our aim is to provide robust and easy-to-use tools that follow good practice financial modelling guidelines and assist individuals and businesses with common financial planning and analysis processes.
We are keen to make sure our customers are satisfied with the tools / models they purchase and will be more than happy to assist with any questions or support required following or in advance of purchase.
We are also always keen to receive feedback so please do let us know what you think of our models by sending us a message or submitting a review.
This Best Practice includes
1 Populated Excel Model and 1 Unpopulated Excel Model
Further information
Prepartion of a 5 year 3 statement (Income Statement, Balance Sheet, Cash Flow Statement) Financial Projection Model for a group of companies consisting of up to 3 revenue-generating entities and 1 holding company
