Institutional-Grade DCF Valuation Model — 10-Year Excel with WACC Builder, Scenario Analysis & AI Commentary
Originally published: 16/05/2026 18:25
Publication number: ELQ-13200-1
View all versions & Certificate
certified

Institutional-Grade DCF Valuation Model — 10-Year Excel with WACC Builder, Scenario Analysis & AI Commentary

The model covers a full 10-year UFCF projection, a WACC Builder with Hamada Beta re-levering, Bear/Base/Bull scenario toggle, sensitivity heatmaps, ...

Description
Stop spending two days on a valuation you need by Monday.
A single valuation engagement costs $5,000–$50,000. This DCF model Excel template gives you the same unlevered free cash flow framework a junior analyst at a bank or Big Four firm uses — built to the methodology standard presented in the CFA Institute curriculum and Damodaran’s Investment Valuation (4th ed.) — for $97.

The model ships pre-loaded with a live Microsoft Corporation worked example: FY2025 10-K data, every WACC input sourced and referenced (Damodaran SSRN, FRED, Yahoo Finance, SEC EDGAR). You see exactly how the model runs before you replace a single number. Then clear the amber input cells, enter your company’s data, and the entire 10-year projection, terminal value, scenario analysis, and implied share price recalculate automatically.

What makes this different from free templates
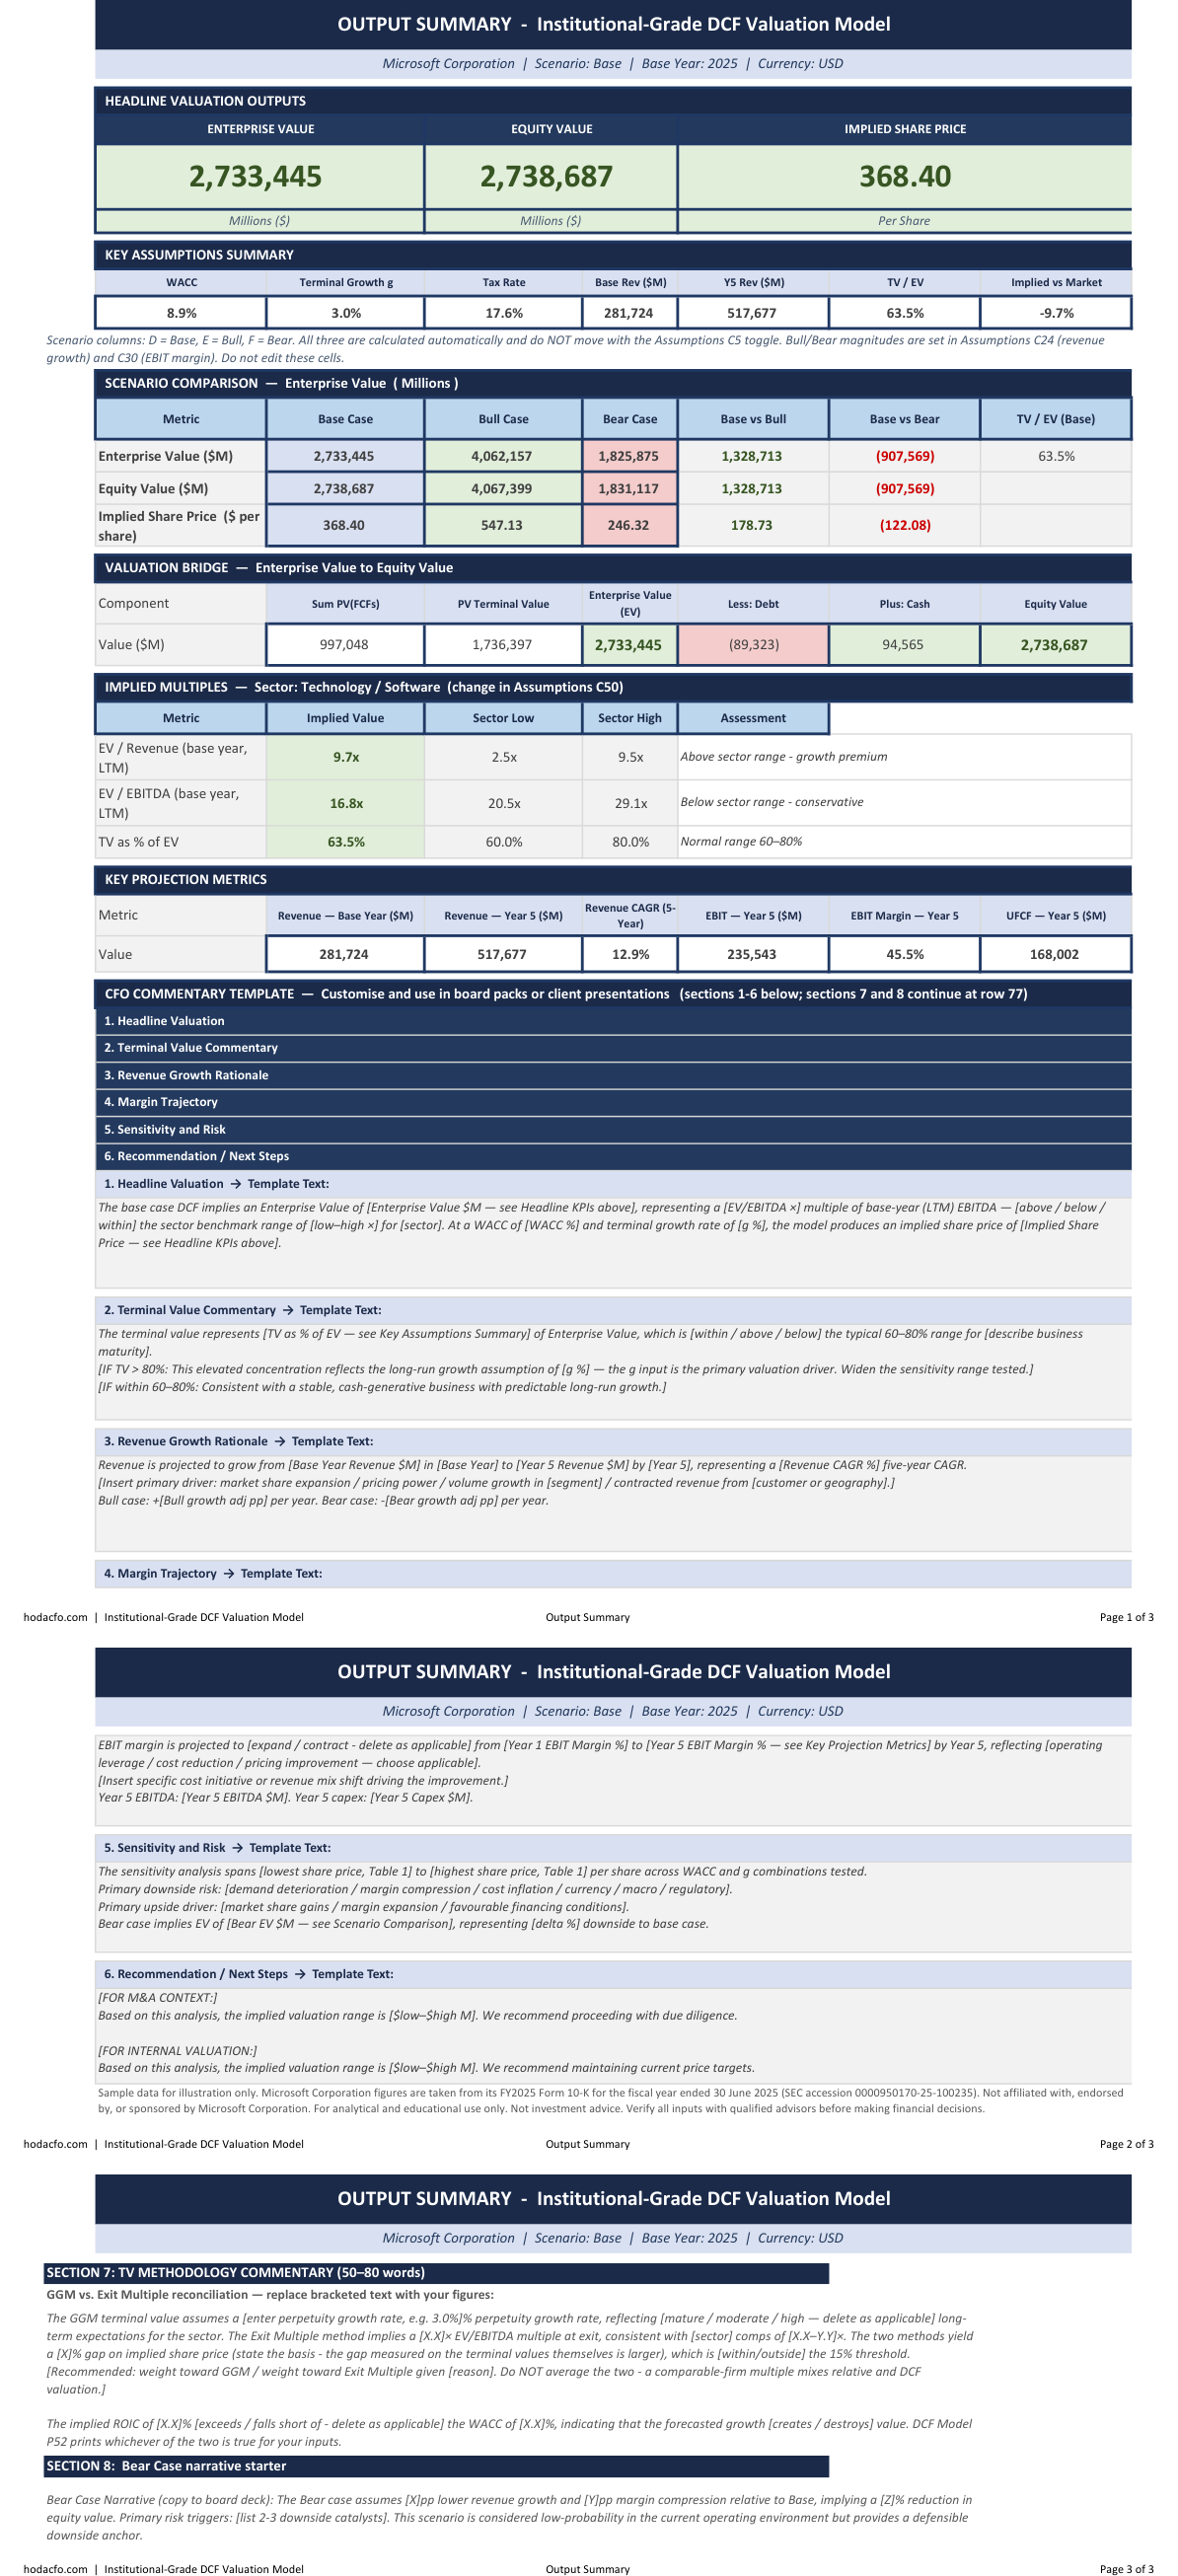
CFO Commentary Template. Leave every meeting with a draft narrative. Six structured sections — Headline Valuation, Terminal Value Commentary, Revenue Growth Rationale, Margin Trajectory, Sensitivity and Risk, Recommendation — in practitioner-register language. Not placeholder text. Sentence starters that require you to insert your specific figures, not rewrite from scratch.

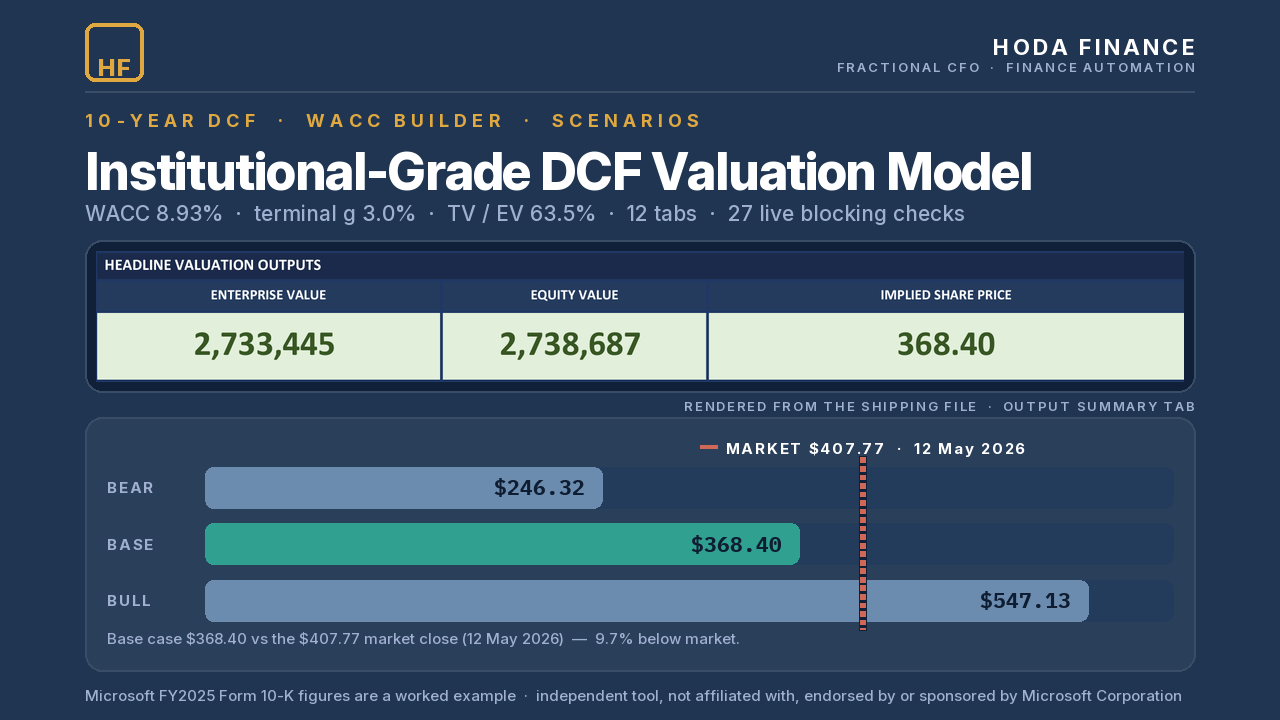
3-Scenario Toggle. One dropdown switches Base, Bull, and Bear. Every output — EV, Equity Value, Implied Share Price, implied multiples, scenario bar chart — updates automatically. Bull: +4.5pp revenue growth, +2.0pp margin. Bear: −4.5pp, −2.0pp. Symmetric, configurable, board-ready.

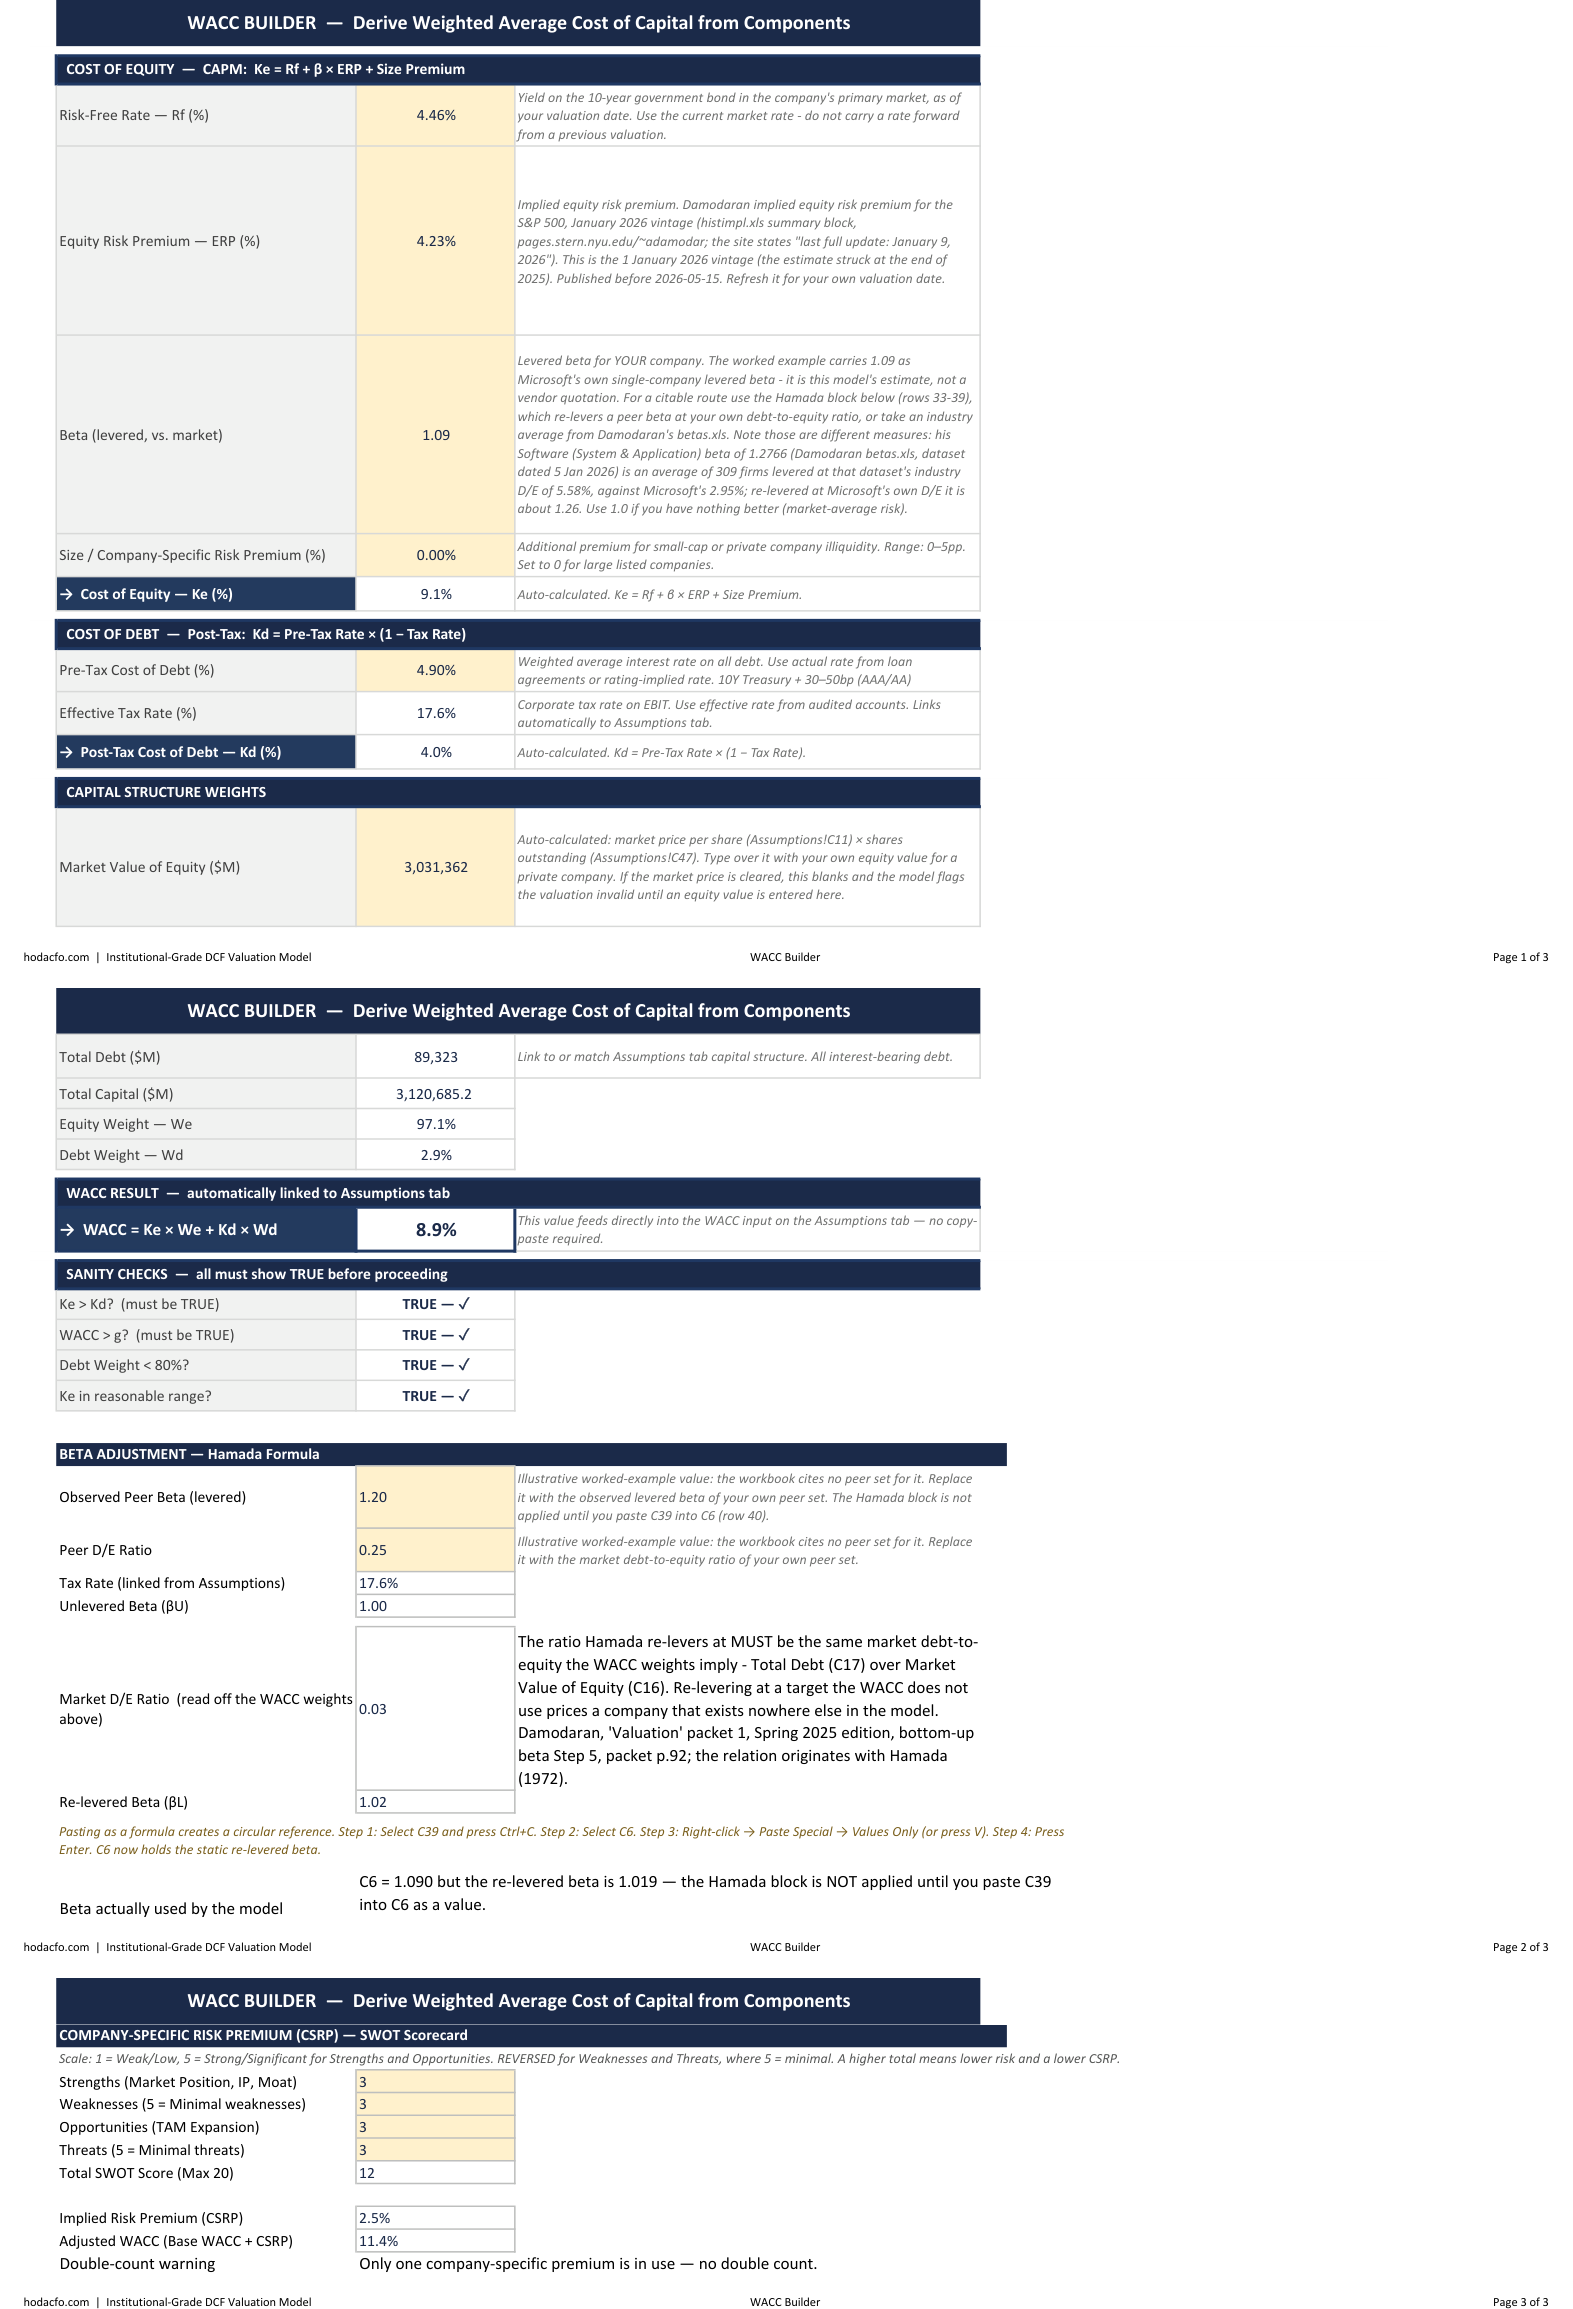
WACC Builder. Arrive at a defensible discount rate in minutes, not a guess. CAPM with Ke, Kd, and capital structure weights all in one tab. WACC auto-links to the Assumptions tab — no copy-paste required. Includes Hamada Beta adjustment for private company or capital structure mismatch scenarios, and a Company-Specific Risk Premium SWOT scorecard (0–5% CSRP range). Four automated sanity checks flag if your inputs violate basic WACC logic before you proceed.

AI Prompts tab. Five structured prompts for ChatGPT, Claude, or Copilot — not generic “ask AI about your DCF” filler. Each prompt includes role assignment (“Act as a CFO”), output format specification, exact cell copy instructions, and anti-hallucination guardrails (“reference the specific figures from the model output — do not use generic placeholders”). Prompt 1 generates a 3-paragraph investment committee memo. Prompt 5 reconciles GGM vs. Exit Multiple terminal values with a recommendation on which to weight. The product does not just build the valuation — it helps you communicate it.

Sourced Methodology. The included Methodology PDF documents every input in the Microsoft worked example with source URLs and SEC filing accession numbers. The Practitioner’s Guide covers every tab and every formula decision across 12 pages. This is not a template. It is an audit trail.

Full Workbook Structure — 11 Named Tabs
Assumptions — Central input hub. All amber cells are user-editable. Every other tab references Assumptions via absolute cross-tab formulas. Change one input here; the entire model updates.

WACC Builder — CAPM cost of equity (Ke = Rf + β × ERP + Size Premium), post-tax cost of debt, capital structure weights. Hamada Beta re-levering for private companies. CSRP SWOT scorecard. Four automated sanity checks.

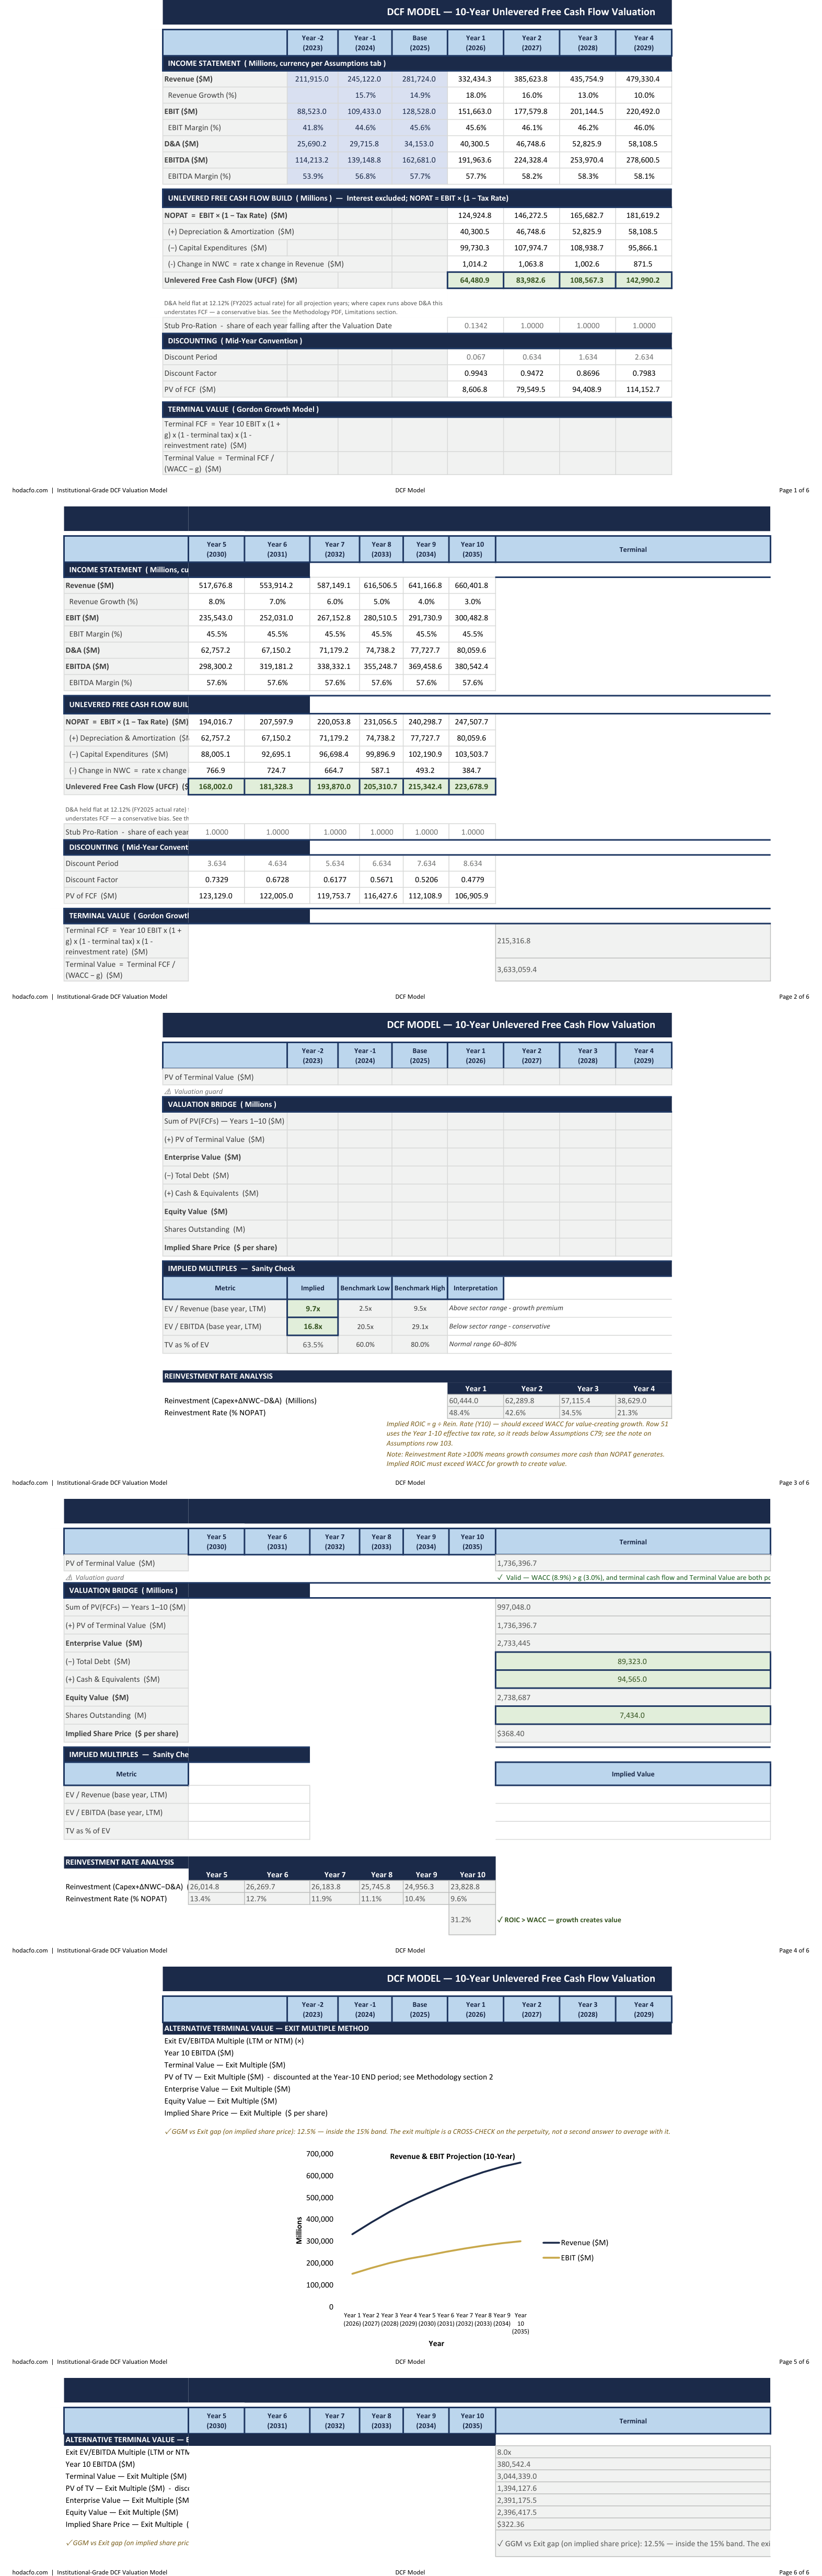
DCF Model — 10-year UFCF projection. Revenue → EBIT → NOPAT → +D&A → −Capex → −ΔNWC = FCF. Mid-year discounting convention. Gordon Growth Model terminal value cross-checked against EV/EBITDA Exit Multiple — automated divergence flag when the two methods differ by more than 15%. Reinvestment Rate Analysis with implied ROIC vs. WACC.

Sensitivity Analysis — Two heatmaps. Table 1: Implied share price across WACC (7%–13%) × Terminal Growth (1%–5%) — valuation range from $179 to $612 per share in the Microsoft worked example. Table 2: Enterprise Value across Revenue Growth × EBIT Margin. Each cell independently recomputes the full DCF — not an approximation.

Output Summary — EV, Equity Value, Implied Share Price, WACC, g, TV/EV ratio. Scenario comparison table: all three cases side-by-side with absolute and percentage deltas. Implied multiples vs. sector benchmarks (sector selectable via dropdown). CFO Commentary Template with six structured narrative sections.
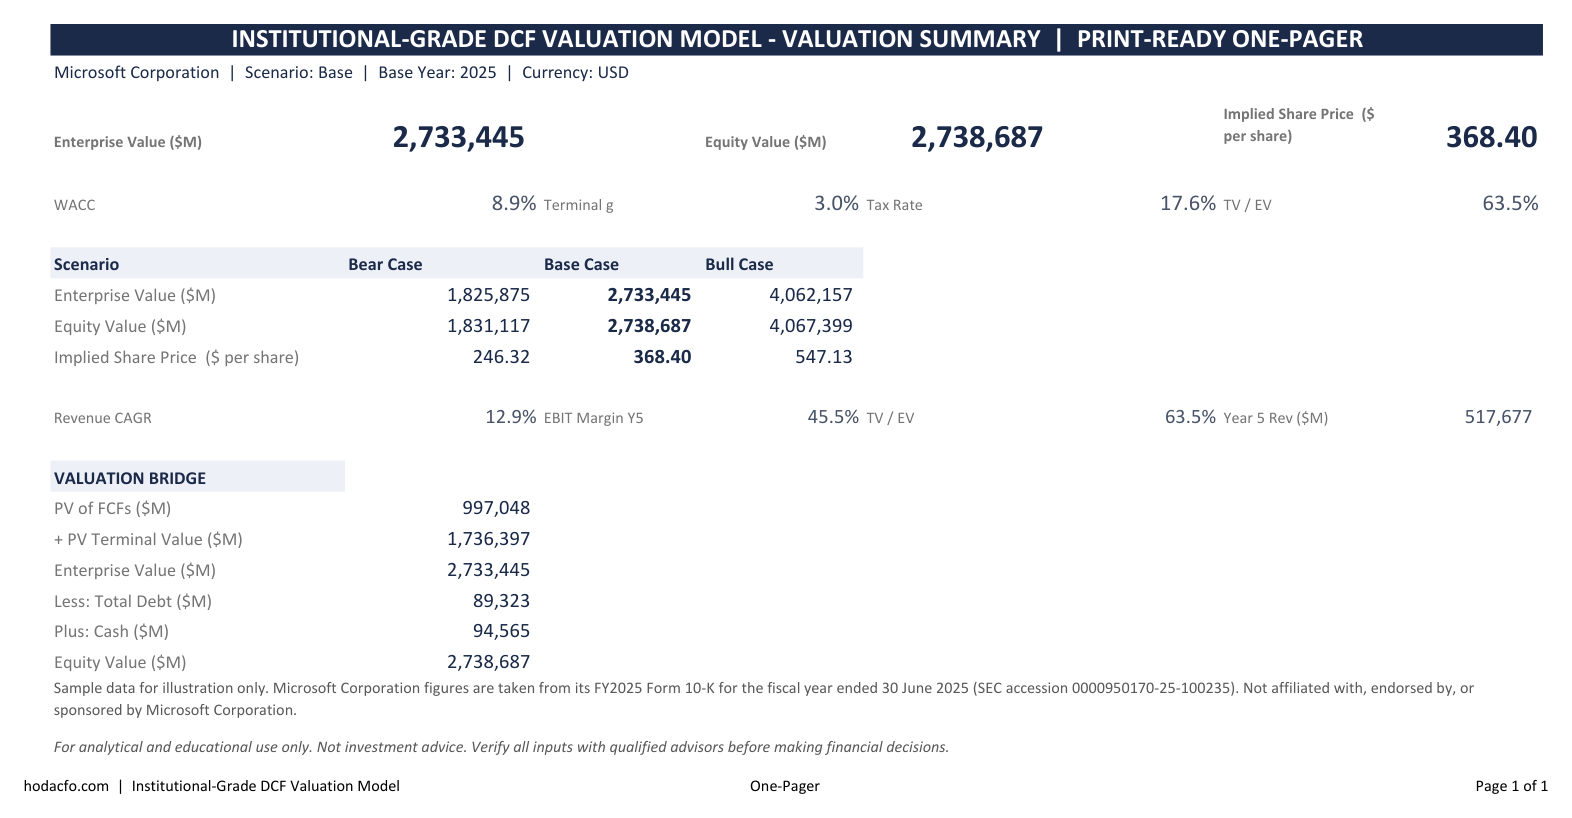
One-Pager — Print-ready board executive summary. All data linked from the model — no manual updates.

Executive Dashboard — KPI tiles at top. 10-year Revenue and EBIT line chart. Bear/Base/Bull share price bar chart. All data model-linked.
AI Prompts — Five structured prompts covering: Investment Committee Memo, ROIC & Growth Defense, Sensitivity Table Narrative, Bear Case Triggers and Mitigations, Terminal Value Methodology Defense.

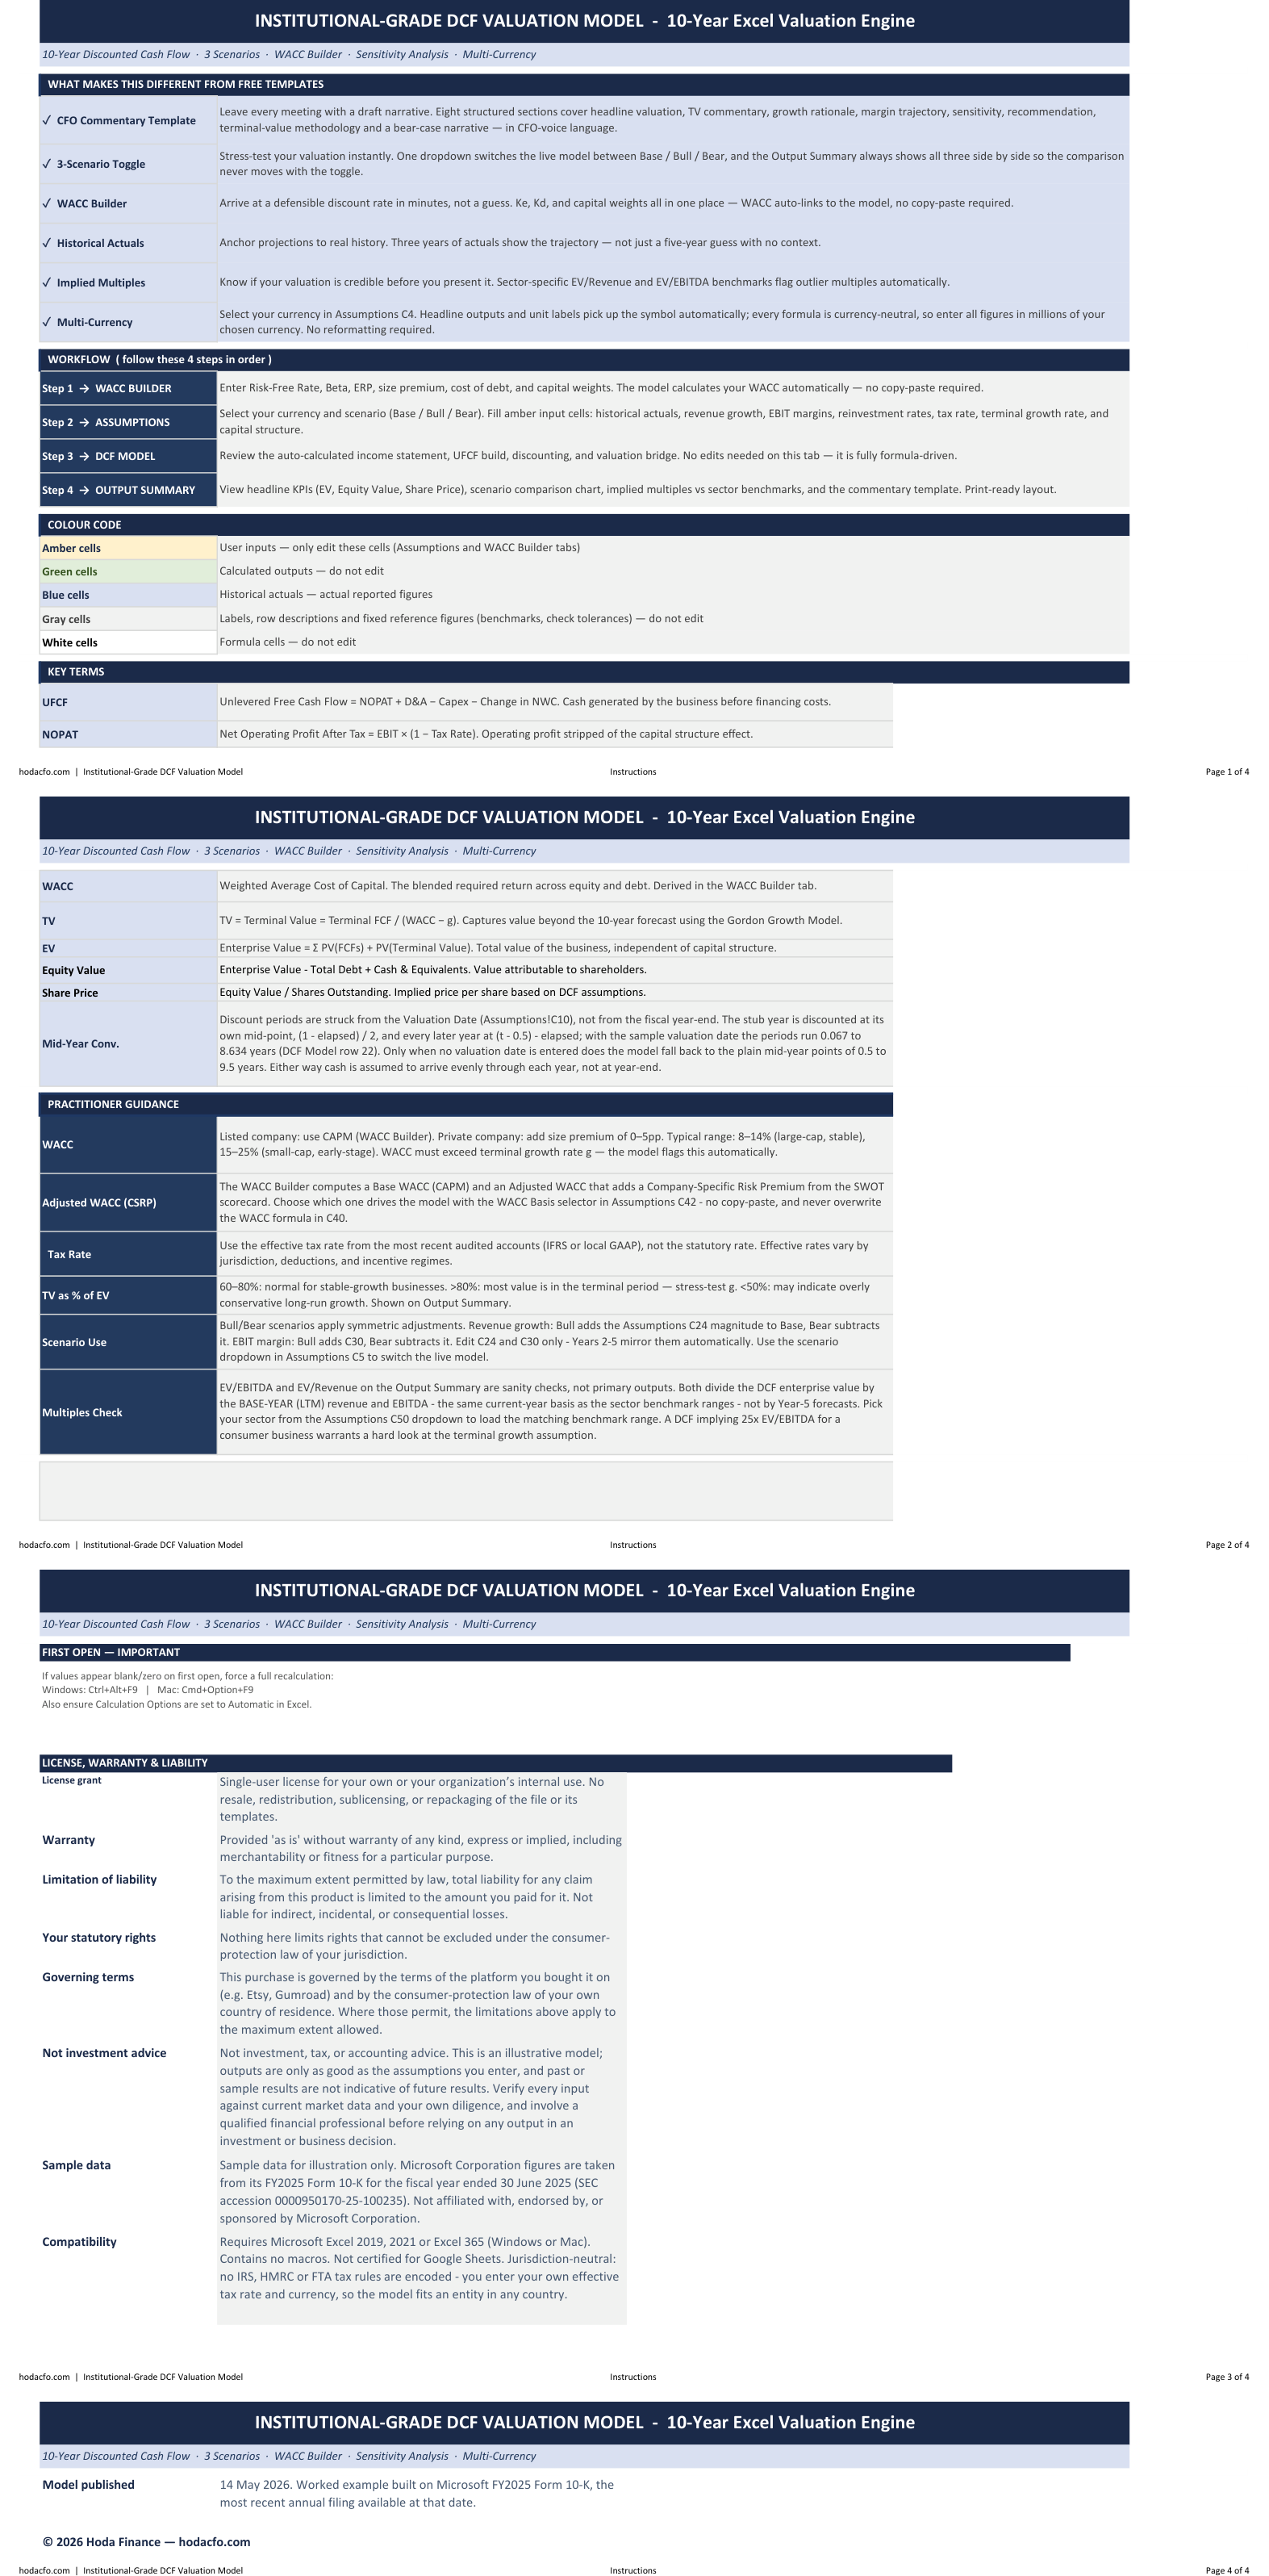
Cover / Quick Start / Instructions — Workbook map, color-code key, step-by-step workflow, and practitioner guidance on WACC, tax rate, TV/EV ratio, and scenario use.

Three Files Included

  1. InstitutionalGrade_DCF_Valuation_Model.xlsx — 11 tabs, Excel 2019 + 365, Windows + Mac, no macros, no VBA
  2. Practitioners_Guide.pdf — 12 pages: input-by-input walkthrough of every tab and every formula decision
  3. Methodology_Input_Sources.pdf — 5 pages: full audit trail of every input in the Microsoft worked example with source URLs
    Three Questions Buyers AskWill this work for my company — not just Microsoft? Yes. The Microsoft data is a worked example pre-loaded so you can see a live valuation on first open. Clear the amber input cells in the Assumptions tab and WACC Builder, enter your company’s figures, and the model recalculates entirely. Compatible with any publicly listed or private company, any sector, any currency. One dropdown updates every currency label throughout the workbook.
    Is there real methodology behind this, or is it just a formatted spreadsheet? The Methodology PDF documents every input in the worked example with source URLs — SEC EDGAR accession numbers, Damodaran SSRN, FRED, Yahoo Finance. The WACC follows CAPM with Damodaran’s January 2026 implied Equity Risk Premium. Terminal value uses GGM cross-checked against an Exit Multiple with a 15% divergence flag. The model follows methodology consistent with the CFA Institute curriculum and Damodaran’s Investment Valuation (4th ed.). The D&A flat-rate treatment and its directional effect on implied share price are disclosed transparently in the Methodology PDF — because a model that does not disclose its limitations is not a professional model.
    What Excel version do I need? Excel 2019 or Excel 365, Windows or Mac. The model uses no XLOOKUP, no LAMBDA, no LET, no dynamic arrays — every formula is Excel 2019-compatible. Not compatible with Google Sheets. If values appear blank on first open, force full recalculation: Windows Ctrl+Alt+F9, Mac Cmd+Option+F9.

    Technical Specifications
    • Excel 2019 and Excel 365 — Windows and Mac
    • No macros, no VBA
    • No Excel 365-only functions (no XLOOKUP, LAMBDA, LET, dynamic arrays)
    • Not compatible with Google Sheets
    • Multi-currency: one dropdown updates all labels throughout the workbook
    • 11 named tabs
    • Force recalculate on first open: Ctrl+Alt+F9 (Windows) / Cmd+Option+F9 (Mac)

    Who This Is For
    Investment analysts, equity research associates, CFOs, FP&A professionals, M&A advisors, private equity associates, and strategy professionals who need a defensible equity valuation they can present to a board. Also used by CFA candidates and MBA students preparing for investment banking and equity research roles who want to benchmark against a practitioner-standard model.
    Single-user license. Personal and professional use permitted. Redistribution, resale, or sharing prohibited. Not investment advice. All inputs and assumptions should be verified by a qualified financial professional before use in any investment or business decision.
    Price: $97 | Original Price: $149 Instant digital download.

This Best Practice includes
1 excel file, 2 PDF

Acquire business license for $97.00

Add to cart

Add to bookmarks

Discuss

Further information

Value a company using discounted cash flow methodology with a full 10-year forecast horizon
Run multi-scenario analysis (Base / Bull / Bear) with symmetric revenue and margin adjustments
Calculate WACC from first principles using the WACC Builder tab (risk-free rate, beta, ERP, cost of debt)
Generate sensitivity tables to assess valuation impact across discount rates and terminal growth assumptions
Produce investor-ready outputs: implied share price, enterprise value, equity value, and executive dashboard charts
Leverage AI-powered commentary for audit-trail narrative of model logic and key assumptions

Valuing a publicly traded company with available historical financial data (10-K/10-Q)
Investment analysis requiring an institutional-grade DCF with fully linked three-statement projections
Equity research, investment banking, or private equity work product requiring sensitivity and scenario testing
Teaching or demonstrating DCF methodology consistent with CFA Institute curriculum principles
Analyzing companies with stable to moderate growth profiles where a 10-year explicit forecast period adds insight
Users comfortable with Excel desktop (Windows/Mac) who need a pre-built, audit-ready model framework

Early-stage startups or pre-revenue companies without sufficient historical financial data to anchor projections
Companies where a sum-of-the-parts or LBO valuation is more appropriate than a DCF
Users seeking a fully automated one-click valuation with no manual assumption input required
Companies in distressed or bankruptcy situations where going-concern DCF assumptions break down
Users who only need a high-level back-of-envelope valuation rather than a full 10-year build
Google Sheets or Excel Online — designed for Excel desktop; some features (sparklines, chart caching) may not transfer


0.0 / 5 (0 votes)

please wait...
