
Originally published: 16/07/2025 14:43
Publication number: ELQ-45644-1
View all versions & Certificate
Publication number: ELQ-45644-1
View all versions & Certificate

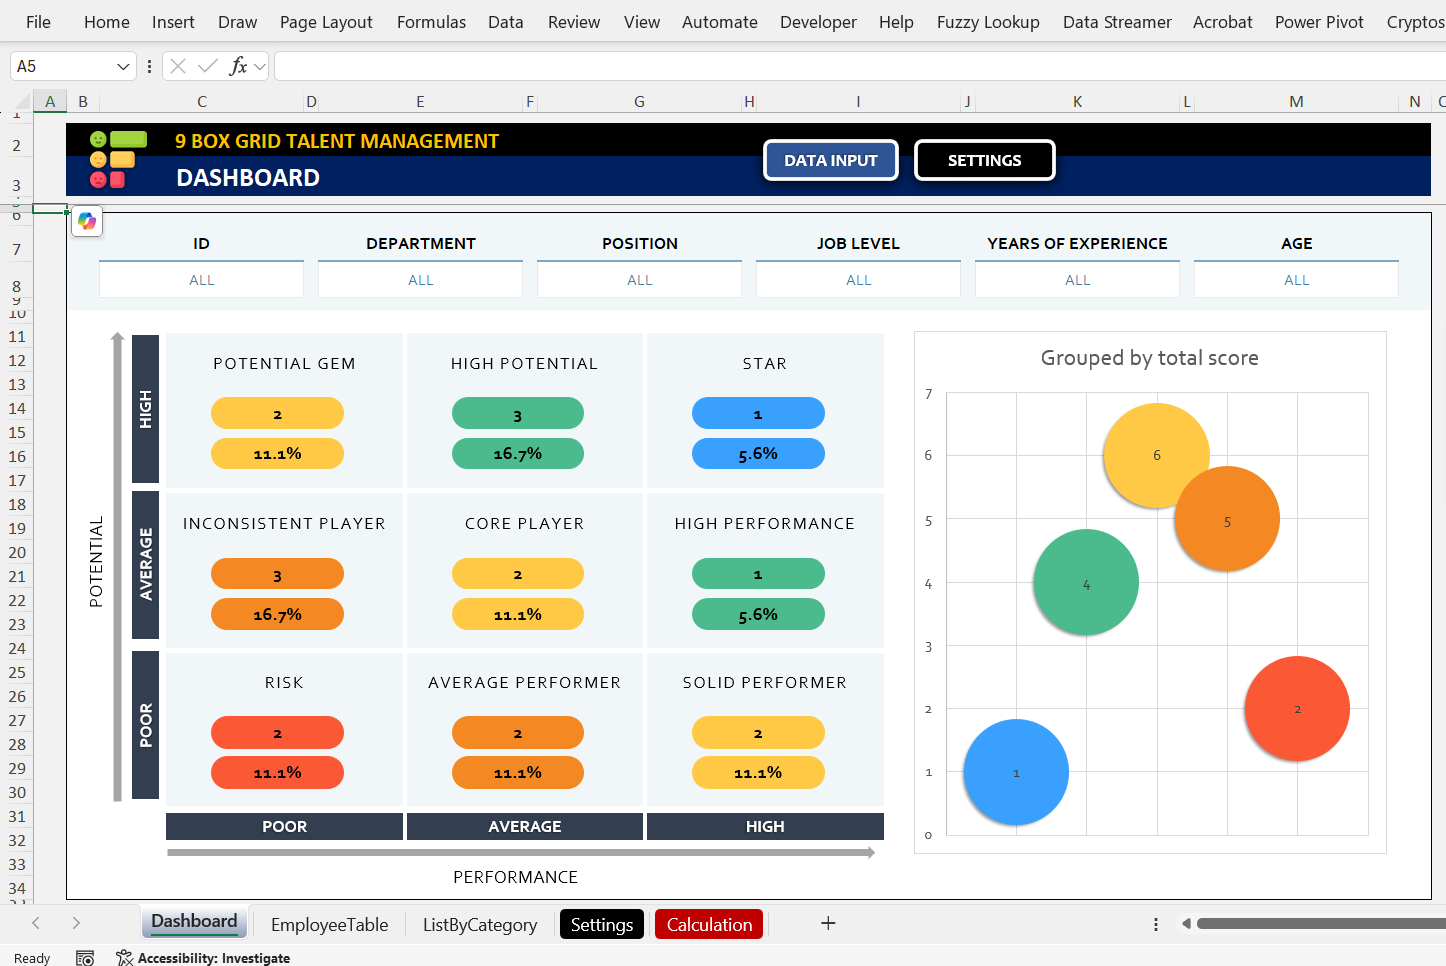
9 Box Grid Talent Management Excel Template - McKinsey 9 Box Talent Matrix HR
9 Box Grid Excel Template to map your talent pool for different positions and departments. This Excel file will let you make McKinsey 9 Box Talent Matrix
Founder & CEO - Excel Basement, Microsoft MVP (Excel) 2025, MCT, MSOM, Excel & POWER BI Trainer & Consultant, MBA (MIS), Emerging Data ScientistFollow 463
Description
It is crucial to understand the capabilities and development areas of the most important assets of an organization: its people! Once the potential and the performance of an employee are clearly determined, the talent managers can make more effective talent mapping.
By using the 9 Box Grid Talent Management Excel spreadsheet template, you can evaluate the performance and potential of employees and classify team members into nine categories accordingly.
9-grid analysis model will let you make competency-based measurement, calibration, assessment, and segmentation for your talents and candidate pool. With this 9×9 boxes, you’ll also improve hiring process for talents to find the best performers or performance-potential for your organizational leadership. Move the results of your scorecards to a sleek-design employee risk assessment.
9 Box Grid Talent Management Template Features:The template has three main sections. You should start defining the settings and then input the data table with the employee information. When you fill in these sections, the chart is automatically created in the dashboard section.
Settings of McKinsey 9 Box Talent Matrix Excel:
The settings area is mainly for specifying the necessary information before starting the performance evaluation. You can define job-related information such as departments, positions, and titles or job levels. In terms of employee-specific information, you may define the years of experience and age ranges. Besides that, there are additional settings for 9 box categories and evaluation levels.
This section allows you to readjust each piece of information. You can customize all the labels inside the 9-box grid categories such as category names, evaluation levels, and, the respective values for performance/potential.
Data Input:
First, start by entering the following employee information: name and surname, department, position, years of experience, job level, and age. After that, you can continue to input the necessary information to create the 9 Box Grid Talent Management chart. Each employee will be positioned on the chart according to the number selected in the performance and potential columns.
Please do not try to manually modify the grey-colored “9 Box Categorization” column at the right end. This column will be filled automatically based on the values you select for the performance and potential columns. If you want to define another name for a category please do so in the settings sheet.
Dashboard:
Now, your chart is available in the dashboard, based on your data input and settings. You can see the total number of employees and their percentage representation in each category. In addition, the chart is also dynamic. You can click on each category to see the list of all employees included under this particular classification.
This Best Practice includes
1 Excel File
