
Publication number: ELQ-14027-1
View all versions & Certificate

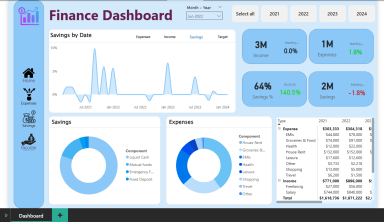
Power BI Financial Dashboard | Revenue, Expenses & Profit Analysis
A clean and professional Power BI Financial Dashboard to track revenue, expenses, and profit in real time. Perfect for businesses and analysts.
Data Analyst | Excel, Power BI, Python, SQL Expert | Turning Data into Decisions | Business AnalystFollow
Further information
The objective of this Power BI Financial Dashboard is to provide businesses and professionals with a ready-to-use, interactive solution for tracking revenue, expenses, profit, and cash flow. It is designed to simplify financial reporting, save time on manual analysis, and support better decision-making with clear visual insights.
Small to medium businesses that want to monitor finances in real time
Finance teams and managers who prepare monthly or yearly reports
Analysts and students looking for professional financial dashboards for practice or projects
Startups that need quick insights into revenue, expenses, and profit trends
Companies that do not use Power BI or are unfamiliar with it
Businesses requiring advanced forecasting, AI-driven predictions, or highly customized solutions beyond standard dashboards
