
Originally published: 26/02/2019 13:58
Publication number: ELQ-12134-1
View all versions & Certificate
Publication number: ELQ-12134-1
View all versions & Certificate

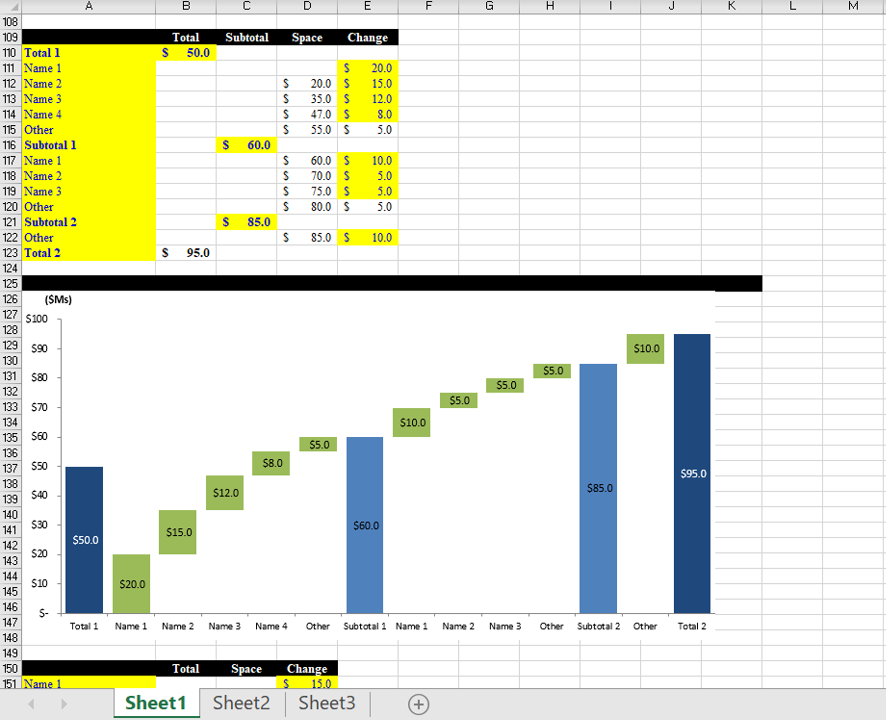
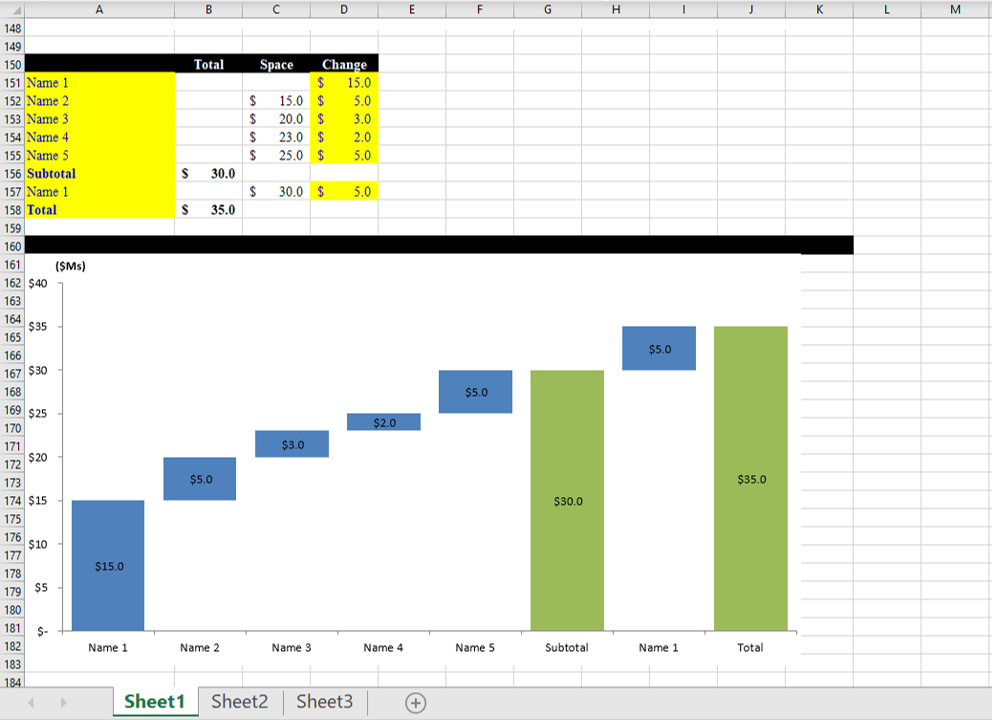
Waterfall Chart Excel Template
An effective tool for quickly working out financial changes over a period.
