
Publication number: ELQ-81379-1
View all versions & Certificate

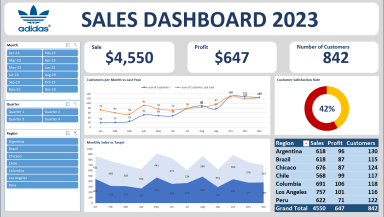
Adidas Sales Performance Dashboard
Beautiful Excel dashboard for Sales performance Analysis of adidas
Data Analyst | Excel Expert | Data Visualization | Python | D3| Financial ModelingFollow
Further information
Here are some objectives for a downloadable best practice Excel dashboard for Adidas sales performance:
Educational:
Provide a practical example: Demonstrate how to create an effective and visually appealing sales dashboard using Excel.
Showcase best practices: Illustrate techniques for data visualization, formatting, and data analysis.
Inspire creativity: Encourage users to adapt and enhance the dashboard for their specific needs.
Practical:
Save time and effort: Provide a ready-to-use template that users can customize and adapt.
Improve decision-making: Enable users to analyze Adidas sales data and make informed decisions.
Enhance reporting and communication: Help users create professional and engaging reports for stakeholders.
Specific to Adidas:
Deepen understanding of Adidas sales performance: Provide insights into key metrics, trends, and opportunities.
Support strategic planning: Help users identify areas for improvement and growth.
Promote data-driven decision-making: Encourage a culture of data-informed decision-making within Adidas.
Overall:
The objective is to provide a valuable resource that helps users learn, improve their skills, and make better decisions related to Adidas sales performance.
Here are some conditions where this downloadable best practice Excel dashboard for Adidas sales performance would be most applicable:
Target Audience:
Individuals learning Excel dashboarding: Those new to creating dashboards in Excel will benefit from the visual structure and practical example.
Adidas employees: Sales, marketing, and data analysis teams within Adidas can use it as a starting point for their own dashboards.
Students or professionals studying business analytics: It provides a real-world example of applying data visualization and analysis techniques.
Specific Use Cases:
Sales performance analysis: Monitoring sales trends, identifying top-performing products, and analyzing regional performance.
Marketing campaign effectiveness: Tracking campaign results, analyzing customer demographics, and optimizing marketing strategies.
Product development: Understanding customer preferences, identifying product gaps, and informing new product launches.
General business intelligence: Gaining insights into key business metrics and identifying areas for improvement.
Conditions for Best Application:
Basic Excel knowledge: Users should have a basic understanding of Excel functionalities and formulas.
Access to Adidas sales data: The dashboard is most effective with relevant Adidas sales data.
Desire for a visually appealing and informative dashboard: Users seeking a well-designed and insightful dashboard will find it valuable.
Need for a starting point or template: Individuals who want to create their own dashboards but need a foundation will benefit from this.
Overall:
This best practice Excel dashboard is most suitable for individuals and teams within Adidas or those studying business analytics who want to learn how to create effective sales dashboards and gain insights from Adidas sales data.
