
Originally published: 17/05/2024 08:51
Last version published: 18/03/2025 10:36
Publication number: ELQ-61589-2
View all versions & Certificate
Last version published: 18/03/2025 10:36
Publication number: ELQ-61589-2
View all versions & Certificate

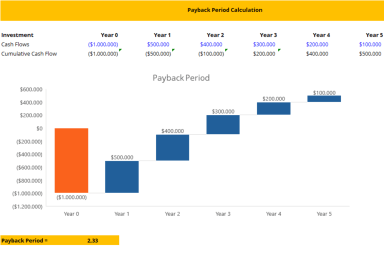
Payback period and Waterfall Chart
We provide this excel template to visualize the free cash flow to a waterfall chart. It is also calculating the payback period of investment.
